billsportsmaps.com

October 30, 2008

Greece: Super League, clubs in the 2008-09 Season.

Filed under: Greece — admin @ 6:46 am

greece_superleague08-09_attendances07-08_post_d.gif


Greek football turned professional after the 1958-59 season of the Panhellenic Championship.  From 1959 to 2005,  the Alpha Ethniki was the first division in Greece.  In 2006,  this competition was replaced by the Greek Super League.  For the professional era,  Olympiacos has the most titles,  26, including the last 4 championships.  Panathinaikos has the second most,  16 (the last in 2004);  AEK Athens is third with 9 (but none since 1994).   These three clubs,  all from Greater Athens,  comprise the big 3 in Greece.  AEK and Pana are both from Athens proper;   Olympiacos are from the port city of Piraeus,  just west of Athens. 

The Olympiacos v. Panathinaikos derby is the biggest in the country.  Here is an article on the rivalry,  from the Bleacher Report site {Click here}.  On 9th November,  Panthinaikos hosts Olympiacos.  For the Greek Super League table and all matches,  {Click here (SoccerStats site) }.

There are only two other clubs who have won a pro title in Greece.  They are PAOK Thessaloniki,  who have been champions twice (last in 1985);  and Larisssa (champs once, in 1988).  PAOK Thessaloniki are from Salonika,  Greece’s second largest city.  Larissa hail from the region of Thessaly,  in central Greece. 

To see a map of the regions of Greece,  {Click here}.   Here is a list of clubs in the league this season,  by region  {Click here}.

Greece’s domestic league is currently ranked #14 by UEFA for competition in Europe  {see this}.

Currently playing in Europe.  In the Champions LeaguePanathinaikos,  in Group B.   {See this,  from Wikipedia…the page has been updated to include breakdowns of the scenarios of all the games on Matchday 4,  which is to be played on 4th and 5th November).   

In the UEFA Cup Group Stage,  the only Greek team competing this season is Olympiacos  {see this}.   [In the 07/08 UEFA Cup Group Stage,  there were 5 clubs from Greece...Panathinaikos,  AEK Athens,  Aris Thessalonika,  Larissa,  and Panionios.]

Thanks to the EFS site,  for the attendance figures {Click here}.

October 27, 2008

NCAA Division I Football: Map- The 58 highest drawing teams (2007 attendance figures).

Filed under: NCAA Gridiron Football,NCAA/fb>attendance map — admin @ 4:48 am

ncaa_football_top58attendances07_post.gif


My last college football map featured the 44th-highest drawing teams (from 2007 attendance figures).  I was able to get up to 58 teams for this one…so this map shows all NCAA Division I teams that drew over 40,000 per game in 2007. 

[I can tell I am really pushing the limit on memory in the drawing program,  because it took a long time to download the map,  when I inserted it into this post.  Plus,  the whole configuration prevents the addition of any more teams...it would just become too crowded and hard to see each team.  So I will put this type of map aside now,  and return to posts featuring maps of  NCAA Division I football Conferences (like I made last November and December).  I will start with the SEC,  next week.] 

This map finally includes the teams that comprise pretty much all of the biggest rivalries in college football.  This can be seen with the inclusion of teams like Oregon State (v. Oregon),  Oklahoma State (v. Oklahoma),  Iowa State (v. Iowa),  Utah (v. BYU),  Kansas and Kansas State,  and Mississsippi and Mississippi State.  Also,  finally,  there are actually some teams from the northeast…Rutgers and Boston College.  The team closest to my hometown (of Rochester, NY),  Syracuse,  did not make the cut.  Their program is really in the doldrums,  with their head coach set for the axe,  and they only drew 35,009 last season (62nd highest). 

On the map,  I wish I could have shown teams that have become recently successful,  like Boise State and TCU,  or that are high-flying upstarts like Ball State.  But all these teams’ average gates fell short of 40,000,  although Boise plays to capacity. 

Boise State’s stadium only holds 30,000,  and they played to 101% capacity last season.  The Broncos are currently ranked #11;  they were the  69th highest-drawing team last season,  at 30,338 per game.

TCU,  Texas Christian University,  drew 30,018 per game in ’07 (68% capacity),  the 77th highest.  The Horned Frogs are currently ranked #12.

Ball State,  of Muncie,  Indiana,  is most famous,  it seems,  for being David Letterman’s alma mater.  In the first week of October,  the Cardinals,  powered by their potent offense,  made it to the AP Poll for the first time ever,  at #25.  They currently are #18,  and remain undefeated.  Ball State averaged only 13,085 per game last season (115th in Division I,  and I bet there were a few lower division teams that outdrew that figure).

 Tulsa is a school better known for it’s very competitive basketball program.  The Golden Hurricanes football team (currently ranked #19) drew 24,539 last season, at 69% capacity and the 86th highest in Division I.

So that’s all the teams in the current AP top 25 Poll  {Click here} that didn’t make the map.  For the record,  the teams that just missed the map,  drawing between 39,881 and 38,068 in 2007 were:  Louisville,  Stanford,  Connecticut,  and Air Force Academy. 

2007 Division I attendance figures {Click here}. 

October 22, 2008

2008 Baseball World Series, Tampa Bay Rays: Team Roster, with Birthplaces and Home Towns Listed.

Filed under: Baseball — admin @ 3:32 pm

mlb_tampa-bay-rays-2008worldseries-roster_birthplace-map_post_a.gif


The map features the full 25-man Tampa Bay Rays World Series roster.  The locations on the map are for where each Tampa Bay Rays player (and their manager) went to high school.  Instead of making this map one that records birthplaces,  I tried to make it better reflect where each player grew up  (ie,  their home town).

Here are the 5 longest serving players on the Devil Rays/ Rays…1. Carl Crawford, OF (since July 20, 2002).   2. Rocco Baldelli, OF (since March 31, 2003).   3. B.J. Upton, OF (since August 2, 2004).   4. Scott Kazmir, P (since Aug. 23, 2004).   5. Edwin Jackson, OF (since April 22, 2006).

As with the Phillies current roster,  the Rays have 2 players who went to high school in the same town.  Rocco Baldelli and bullpen pitcher Dan Wheeler both attended schools in Warwick, Rhode Island.  Two Latin American players now on the Rays were signed in their teens by MLB clubs.  Venezuelan catcher (and All-Star) Dioner Navarro was signed by the New York Yankees when he was 16.  Dominican outfielder Willy Aybar was signed by the Los Angeles Dodgers when he was 17.  And there is one Ray,  back-up catcher Michel Hernandez,  who fled Cuba when his ball club,  Havana Industrial,  was playing in Mexico,  in 1996.  18 years old at the time,  Hernandez sought and received asylum in Venezuela,  where he still lives.

Tampa Bay Rays’ regular season statistics  {Click here}.

Philadelphia Phillies’ regular season statistics  {Click here}.

Here is a nice feature on the MLB site that ties in with the two roster/hometowns maps I posted today:  {Click here for mlb.com’s Pennant Traces}.

___
Thanks to the contributors to the Tampa Bay Rays pages on Wikipedia {Click here}.  Thanks to Baseball Cube  {Click here}.

2008 Baseball World Series: Philadelphia Phillies, Team Roster with Birthplaces and Home Towns Listed.

Filed under: Baseball — admin @ 5:44 am

mlb_philadelphia-phillies-2008worldseries-roster_birthplace-hometown-map_post_b.gif


The map features the full 25-man Philadelphia Phillies World Series roster. The locations listed on the map are for where each Philadelphia Phillies player (and their manager) went to high school.  Instead of making this map one that records birthplaces,  I tried to make it better reflect where each player grew up (ie, their home town). 

Here are the 5 longest serving players on the Phillies…1. Pat Burrell, OF (since May 24, 2000).   2.  Jimmy Rollins, SS (since September 17, 2000).   3. Chase Utley, 3B (since April 4, 2003).   4. Ryan Madson, P (since September 27, 2003).   5. Ryan Howard, 1B (since September 1, 2004). 

It is interesting to note that two Phillies relief pitchers were born in the small north-central Illinois town of Spring Valley, a couple hours’ drive south-west of Chicago.   J.A. Happ ended up attending high school in neighboring Peru, Illinois;  Chad Durbin’s family moved down South when he was young,  and he attended high school in Baton Rouge, Louisiana.  Also,  two Phillies players attended high schools in the same town, Moreno Valley,  in Riverside County, California (just east of Los Angeles:  reliever Ryan Madson,  and 3rd baseman Greg Dobbs.

I have added regular season statistics for each player.  During the baseball playoffs, baseball broadcasts usually don’t show the regular season stats for players in the course of the game.  After the first game of the post season, they will pretty much only show players’ current post season stats,  as if the regular season stats no longer are relevant.   So,  for the pitchers,  there are individual numbers for W-L, ERA, Walks,  and Strikeouts;  for the position players,  there are the numbers for Batting Average,  Home Runs, and Runs Batted In.  I could not squeeze in stats like games played,  innings pitched,  and on-base percentage,  but you can get full  Philadelphia Phillies Regular Season statistics here… {Click here (USA Today site) }.  Tampa Bay Rays Regular Season statistics here {Click here}. 

Thanks to the contributors to the Wikipedia pages of the Philadelphia Phillies {Click here},  and the Tampa Bay Rays {Click here}.

Thanks to Baseball Cube {Click here}. 

Thanks to Diamond Mind Baseball/ SAT Repository site  {Click here},  for linking to this post.

October 21, 2008

UEFA Competitions, 21st through 23rd October, 2008: Champions League Group Stage, Matcday 3; UEFA Cup Group Stage, Matchday 1.

Filed under: UEFA Champions League,UEFA Cup / Europa League — admin @ 5:00 am

championsleague08-09post_b.gif

-

uefa_cup08-09_group-stage_post.gif


Note: The two maps are old content; new content can be seen in the assemblage below.  For best viewing of the Gallery below, click on the image below, then click once more after the gallery appears on it’s own page.

fenerbahce_segment.gif

On Wednesday,  in Champions League Group G  {see standings here},  Arsenal visits the Sukru Saracoglu Stadium in Istanbul, Turkey to face Fenerbahce {Click here, for a photo gallery from the WSoccer site}.  The Sukru Saracoglu Stadium,  which has had all four stands completely rebuilt in the last decade, will host this season’s UEFA Cup Final in May, 2009.

Thanks to erkagunes,  at flikr.com {Click here};  thanks to beepworld.de {Click here};  thanks to wsoccer.com {Click here}.

October 18, 2008

Belgium: Clubs in the 2008-’09 First Division.

Filed under: Belgium — admin @ 8:24 am

belgium_1stdivision08-09_post_b.gif


The Belgian First Division was established in 1895.  Royal Sporting Club Anderlecht, of Brussels,  have the most titles, 29 (the last in 2007).  Club Brugge has 13 titles (the last in 2005).  Reigning champions are Standard Liege;  they have 9 titles.   All three of these clubs drew between 26,400 to 24,900 per game last season.  Another club also drew near this range: Racing Genk, with a 23,200 average.  This club was formed in 1988,  from the merger of two Belgian Limburg-based clubs.  Genk has won 2 titles,  (the last in 2002).  Two other clubs currently in the league have been champions:  KV Mechelen, who only draw around 6,000 per game,  have 4 titles (the last in 1989);  Cercle Brugge have 2 titles (but the last was in 1930).  They drew around 10,000 per game last season.  Strangely, Belgium’s second largest city,  Antwerp,  does not seem to have much of a footballing culture, as there is only one club in the Belgian top tier from there,  Germinal Beerschot,  and they draw only around 9,600 per game.  [For a list of Belgium's largest cities,  {Click here}.]

The Belgian First Division is currently undergoing a contraction,  from 18 to 16 clubs.  This is a wise move,  because when a Western European First Division league is promoting a club which can’t even draw 1,000 fans per game (AFC Tubize),  that league is too big.

Belgium is currently ranked #13 in Europe by UEFA {see this}.

The most fundamental aspect of Belgium as a nation is it’s dual langauges and ethnicities.  The north is Flemish, the south is French-speaking Walloon.  Here is Wikipedia’s page on the north region,  Flanders {Click here}.   Here is the page on the south region of Belgium,  Wallonia  {Click here}.

Club Brugge and Standard Liege are both in the UEFA CupClub Brugge are in Group G  {see this};  they travel to Norway to play Rosenborg on Thursday, 23rd October.  Standard Liege, who are the largest club from the Walloon half of the country,  defeated the English club Everton to qualify for the UEFA Cup.  They are in Group C  {see this},  but do not play in the first matchday.  They will host the Spanish club Sevilla on Thursday, 6th November.

Belgian First Division table, {Click here}.

Thanks to the EFS site for the attendance figures {Click here}.

October 15, 2008

NCAA Division I Football: Map- The 44 highest drawing teams (from 2007 attendance figures).

Filed under: NCAA Gridiron Football,NCAA/fb>attendance map — admin @ 10:07 am

ncaa_football_top44attendance07_post.gif


I wanted to keep on going to 66 teams.  But my computer froze up and shut down, announcing that the drawing program did not have enough memory.  I guess these photos of the helmets that I use take up lots of  memory.  This happened right as I was adding the 44th team.  When I rebooted, I was able to finish that,  but I decided to stop at 44…turns out that this was the cut-off point for teams averaging +50,000 per game.  So I decided to take that as a sign, and stop there.    

The Texas Longhorns are #1,  supplanting the Oklahoma Sooners…{Click here}.  AP College Football Poll,  {Click here}. 

For the complete list of Average Attendance of all 119 NCAA Division I Football teams (in a pdf file),  {Click here}.

October 13, 2008

Non-League Football in England: Attendance Map for October, 2008.

Filed under: 2008-09 English Football — admin @ 9:35 am

england_non-league_attendance-map_october11-2008_post_y.gif


This map shows the 38 highest drawing non-league football clubs this season (just under one third of the season has been played so far in the 5th Level,  about one quarter has been played in most of the other lower levels).   Instead of just focusing on the 5th Level of English Football…the Conference,  which is officially known as the Blue Square Premier League,  I have included all clubs outside the League that have a current average attendance above 800 per game.  All but one club in the Blue Square is on the list,  the exception being the Essex-based Grays Athletic,  who have seen their average gate dip 27%,  to 665 per game.   The West Sussex-based club Crawley Town currently top the Conference table,  with Kettering Town,  Cambridge United,  and Kidderminster Harriers all within touching distance of first.   For the Blue Square Premier League table,  {Click here}. 

Of the 15 clubs on the map below the Conference,  three supporter-run clubs stand out…AFC Wimbledon,  FC United of Manchester,  and AFC Telford United.  Two were recently formed as a direct result of fan antipathy towards the original club they supported,  and one (Telford) was formed when the original went bust. 

AFC Wimbledon were formed in 2002 by dissident supporters,  when Wimbledon FC announced their intention to change their name to the MK Dons,  and move from south London 56 miles north to the Buckinghamshire town of Milton Keynes (this move occured in September, 2003).   In their 6 seasons of existance,  AFC Wimbledon have won promotion 3 times,  including last May,  when the club won the Isthmian League Premier Division playoffs on the third try.  They are currently in the 6th Level,  in the Conference South.  They sit third in the table,  in the playoff places,  level on points with Team Bath (227 avg. attenadance),  and one point behind Hayes & Yeading United (489 avg. attendance).  AFC Wimbledon seem on course for eventually gaining promotion to the League (which means two more promotions),  and more power to them.  The Wimbledon FC fans who saw their plucky underdog club win the 1988 FA Cup,  only to have their club ripped out from under them 14 years later,  must be pretty proud of how far their AFC Wimbledon have come since.  For Wikipedia’s page on AFC Wimbledon,  {Click here}.

FC United of Manchester were formed in 2005,  after fan disaffection in the wake of US trailer-park slumlord/corporate takeover artist/fish-protein baron/NFL owner Malcolm Glazer’s debt-laden buyout of Manchester United  {see this}.  The club plays at Gigg Lane,  home of League Two’s Bury FC.  FC United often outdraw the club they rent from,  (although it must be mentioned that Bury’s attendance is up 15%, to 2,996 per game,  in the wake of the Shakers’ excellent form under manager Alan Knill).  FC United won promotion to the Northern Premier League’s Premier Division last spring (the league is usually referred to as “the Unibond”),  in the 7th Level.   This season seems one of consolidation for the club,  as they sit right in the middle of the table,  at 11th  {Unibond Premier League table, Click here}.

AFC Telford United were formed in May, 2004, by supporters,  when it became clear that that their club Telford United FC,  noteworthy FA Cup Giant-killers {see this},  were about to fold.  The phoenix club’s motto, numquam obliviscere,  is Latin for “never forget”.   AFC Telford won promotion twice in their first three seasons,  going from the 8th to the 6th Level,  and currently sit 7th in the Conference- North,  six point behind leaders Southport  {Conference- North table, Click here}. 

Thanks to the  King’s Lynn FC  website,  for non-league gate figures  {Click here}.

Thanks to the  Two Hundred Percent  site,  for excellent coverage of non-league football  {Click here}.  [Note:  the 18th September post, 'Stable Management And The Conference',  is good.]

Thanks to Tony’s English Football Site  {Click here}.

Pyramid Passion is a site for nice photos, etc. of Non-League football grounds…{Click here}.

October 9, 2008

Major League Baseball: Map with all 30 ball clubs, showing each club’s titles; with a list showing 20th and 21st Century franchise shifts.

Filed under: Baseball — admin @ 3:27 pm

baseball-mlb30hats_post_b.gif


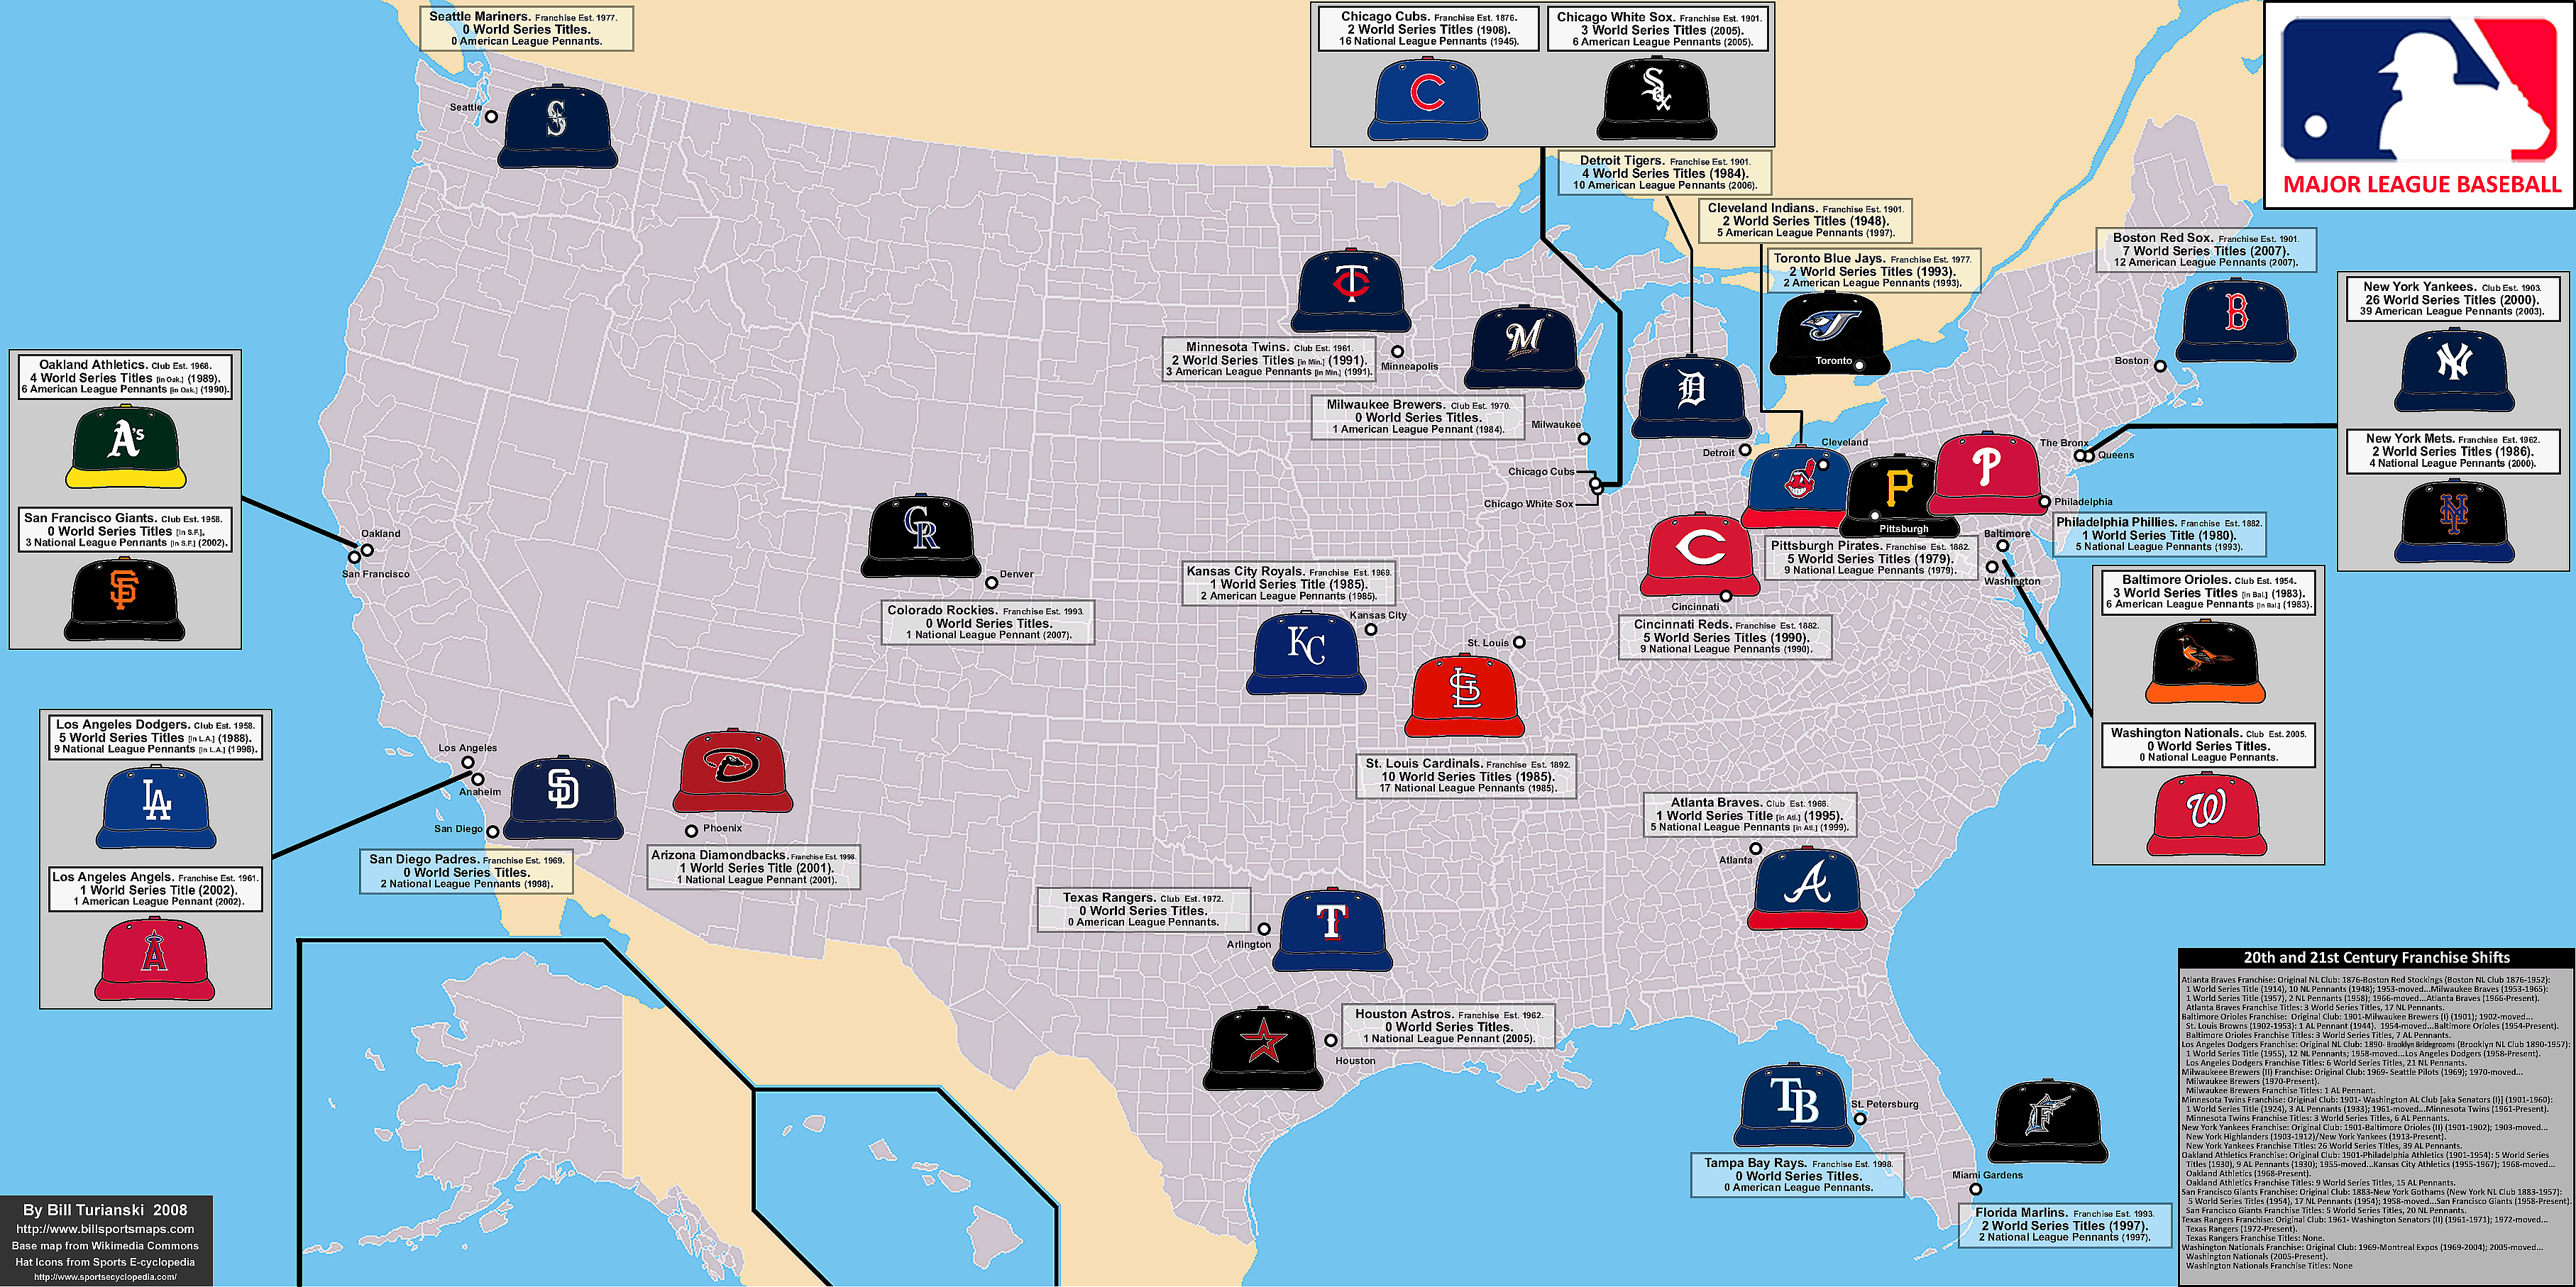
(Note: my most current map of MLB teams an be found at the following, category: Baseball > Paid-Attendance.)

A little while back,  I got a question asking if I had made,  or knew of,  a chart showing all the franchise shifts in Major League Baseball.   So when I was making this map,  I decided to add a table showing all the franchise shifts in MLB during the 20th and 21st Centuries.  No bells and whistles like colors and logos,  though  (maybe I’ll do one like that in the future),  just the ball clubs’ names,  years in existance,  franchise shifts,  and titles.  

I skipped the 19th Century franchise shifts…there were a whole lot of fly-by-night ball clubs in the formative years of the National League.  But for the record,  here are the defunct 19th Century National League ball clubs that won NL Pennants…Providence Grays,  2 NL Pennants (1879 and 1884).   Detroit Wolverines,  1 NL Pennant (1887).   Baltimore Orioles (I),  3 (consecutive) NL Pennants (1894-1896).   For the complete list of National league Pennant winners from 1876 to 1968 (the extra tier of playoffs began in 1969),  {Click here}. 

The National League was founded in 1876.  In total,  there were 27 National League franchises from the 19th century  {see this}.   No NL ball club has folded since 1899.  The 8 franchises that survived the NL’s contraction from 12 teams to 8 teams,  after the 1899 season,  are still in the National League today  {see this},  although the Chicago Cubs are the only NL ball club that has remained in the same city,  uninterrupted,  since 1876.   I know this gets confusing,  but the Chicago Cubs were originally called the Chicago White Stockings (I).   [This ball club had no connection to the American League franchise formed a quarter-century later.]   It wasn’t until 1902,  and two name changes (the Chicago Colts,  then the Chicago Orphans),  that the NL Chicago ball club officially became the Chicago Cubs.   

The Atlanta Braves’ franchise also dates back to 1876;  this ball club began as the Boston Red Stockings (aka Red Caps).  [Again,  this National League Boston club had no connection with that American League franchise formed a quarter-century later who later became the Boston Red Sox.]  The Braves’ franchise has went through 10 name changes and 3 cities. 

The third and fourth oldest National League franchises still in existence both date back to 1883.  They are the Philadelphia Phillies (originally known as the Philadelphia Quakers) and the San Francisco Giants (originally the New York Gothams;  but known as the New York Giants from 1885 to 1957).  

The fifth oldest NL franchise is the Pittsburgh Pirates,  who joined the National League as Allegheny (no city name and no plural, initially),  in 1887.  The club had left the rival late 19th Century major league called the American Association (which existed from 1882 to 1891;  see this).   The ball club got their present name after the Philadelphia Athletics of the AA accused them of piracy,  in acquiring one of Philadelphia’s best players.  The Pittsburgh club took the pejorative and used it to their advantage,  renaming themselves the Pittsburgh Pirates in 1891.  Not incidentally,  this affair was one of the contributing factors which led to the demise of the American Association,  the next year.

The sixth and seventh oldest NL franchises both date to 1890.  They are the Cincinnati Reds and the Los Angeles Dodgers.  The Reds were not connected with the two Cincinnati Red Stockings ball clubs,  the first being the first nationally successful pro baseball club (from 1866 to 1870 and pre-dating the National League…see this).  The latter Cincinnati Red Stockings were a founding member of the National League in 1876,  but were expelled from the league in 1880 for serving beer at games,  and for violating ballpark lease arrangements.  The present-day Cincinnati Reds joined the National League in 1890,  leaving the American Association  (see this time-line of the American Association).  Another club left the AA to join the NL in 1890…the Brooklyn Bridegrooms.  This club went through 2 name changes prior to the endearingly anachronistic Bridegrooms moniker,  and 4 more name changes before they officially became the Brooklyn Dodgers (in 1932).  They were known in the period from approximately 1899 to 1910,  bizarrely,  as the Brooklyn Superbas (after a popular acrobatic troupe of the time).  By this time,  the nickname of Trolley Dodgers had gained currency for the Brooklyn club…the story goes that their ball park then was at the confluence of several mass transit lines,  so the fans were literally dodging trolleys and streetcars to get to the park.  But from 1914 to 1931,  the club was officially known as the Brooklyn Robins,  after their manager Wilbert “Uncle Robbie” Robinson.  However,  fans and sportswriters alike used the Dodgers moniker interchangeably in describing the hapless,  yet beloved ”Bums” of Brooklyn.   Of course,  the Brooklyn Dodgers toiled in futility,  then later in agonizing runners-up status (with 6 World Series losses,  the last 5 all to the New York Yankees,  between 1941 and 1953),  until they finally won the World Series in 1955.  The underdog borough of Brooklyn had little time to revel in its new status as champions.   Two years later the management of the Brooklyn Dodgers,  succumbing to the lure of free,  soon-to-be valuable land to build a new stadium,   broke the heart of the borough by moving clear across the country to Los Angeles,  California.

The eighth oldest National League ball club is the St. Louis Cardinals.  They were yet another club that arrived in the National League via the American Association.  This occurred in 1892,  after the AA folded.  They were first known as the St. Louis Brown Stockings.  In 1899, they called themselves the St. Louis Perfectos.  In 1900,  the club changed their name to the St. Louis Cardinals,  but not after the bird,  but the shade of red.   In the 19th Century,  it was traditional for many ball clubs to name themselves after the color of their socks,  and the term cardinal was a more common name for a shade of red back then than it is now.   The Cardinals in fact did not display ornithological iconography until 1922  {see this}.

The American League began in 1901.  All 8 of the founding franchises still exist,  but only 4 are still in the same city…the Chicago White Sox (who began as simply as the White Stockings),  the Cleveland Indians (who began as the Cleveland Blues),  the Detroit Tigers,  and the Boston Red Sox (this ball club had no official nickname until they adopted the Red Sox name in 1908).  For the complete list of American League franchises,  names,  and shifts,  {Click here}.    

For the complete list of AL Pennant winners,  {Click here}.

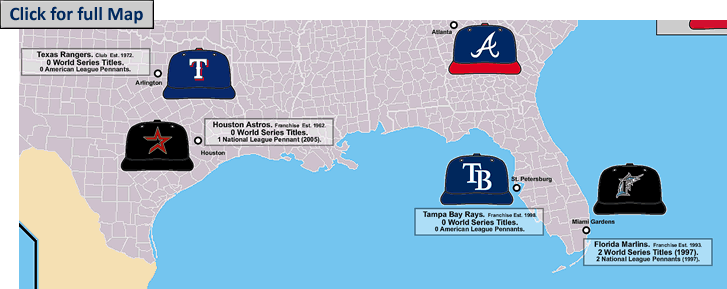
The map shows all 30 current MLB clubs,  with each club’s primary ball cap.  On the main map,  titles are listed for the city the ball club plays in now.  Total franchise titles are listed in the chart at the bottom.

As with regards to the dots showing each ball club’s geographic placement… I listed the actual city,  town,  or metropolitan borough the ball club plays in  (ie,  the New York Yankees play in The Bronx;  the Florida Marlins play 15 miles north of downtown Miami,  in Miami Gardens,  etc.).

Thanks to the Sports E-cyclopedia site, for the baseball hat icons.  http://www.sportsecyclopedia.com/.

Thanks to all the nameless contributors to the invaluable MLB pages which are on Wikipedia.

October 7, 2008

UEFA Cup: 2008-2009 Group Stage.

Filed under: UEFA Cup / Europa League — admin @ 6:31 am

uefa_cup08-09_group-stage_post.gif


Here are the groups {Click here}.   Here is the UEFA site’s description of the draw {Click here}. 

There are 7 clubs who played in the 07/08 UEFA Cup Group Stage,  and are returning this season… From England:  Tottenham.   From Germany:  Hamburg.   From Portugal:  Sporting Braga.   From Russia:  Spartak Moscow.   From Turkey:  Galatasaray.   From Croatia:  Dinamo Zagreb.   From Denmark:  Copenhagen.

After playing in the Champions League in 07/08,  Sevilla return to the UEFA Cup.  The Andalusian club won the UEFA Cup in consecutive years (in 2006 and 2007).

This is the 38th edition of the UEFA Cup,  and the 12th since the single-match final was established.  Here is a list of the last 11 finals {Click here}.   It is interesting to note that 10 of the 11 winners are either in this season’s Champions League,  or UEFA Cup;  the exception is 1999 UEFA Cup winners Parma.  Four of the clubs on the list are currently in the Champions League this fall (Internazionale,  Liverpool,  Porto,  and last season’s UEFA Cup champion,  Zenit St. Petersburg).  On the other hand,  six of the UEFA Cup runners-up from the last 11 seasons are not playing in Europe at all this season,  clubs that range from German giants Borussia Dortmund to the small Basque Country club Alaves;  and including the last three finals losers:  Middlesbrough (2006),  Espanyol (2007),  and Rangers (2008).  Talk about a setback.   This is the big risk of playing  in the UEFA Cup,  especially for smaller clubs without the resources to field a large squad.

Thanks to the EFS site for attendance figures.  I set the link to last season’s attendance figures from the 07/08 UEFA Cup {Click here}.

Older Posts »

Powered by WordPress