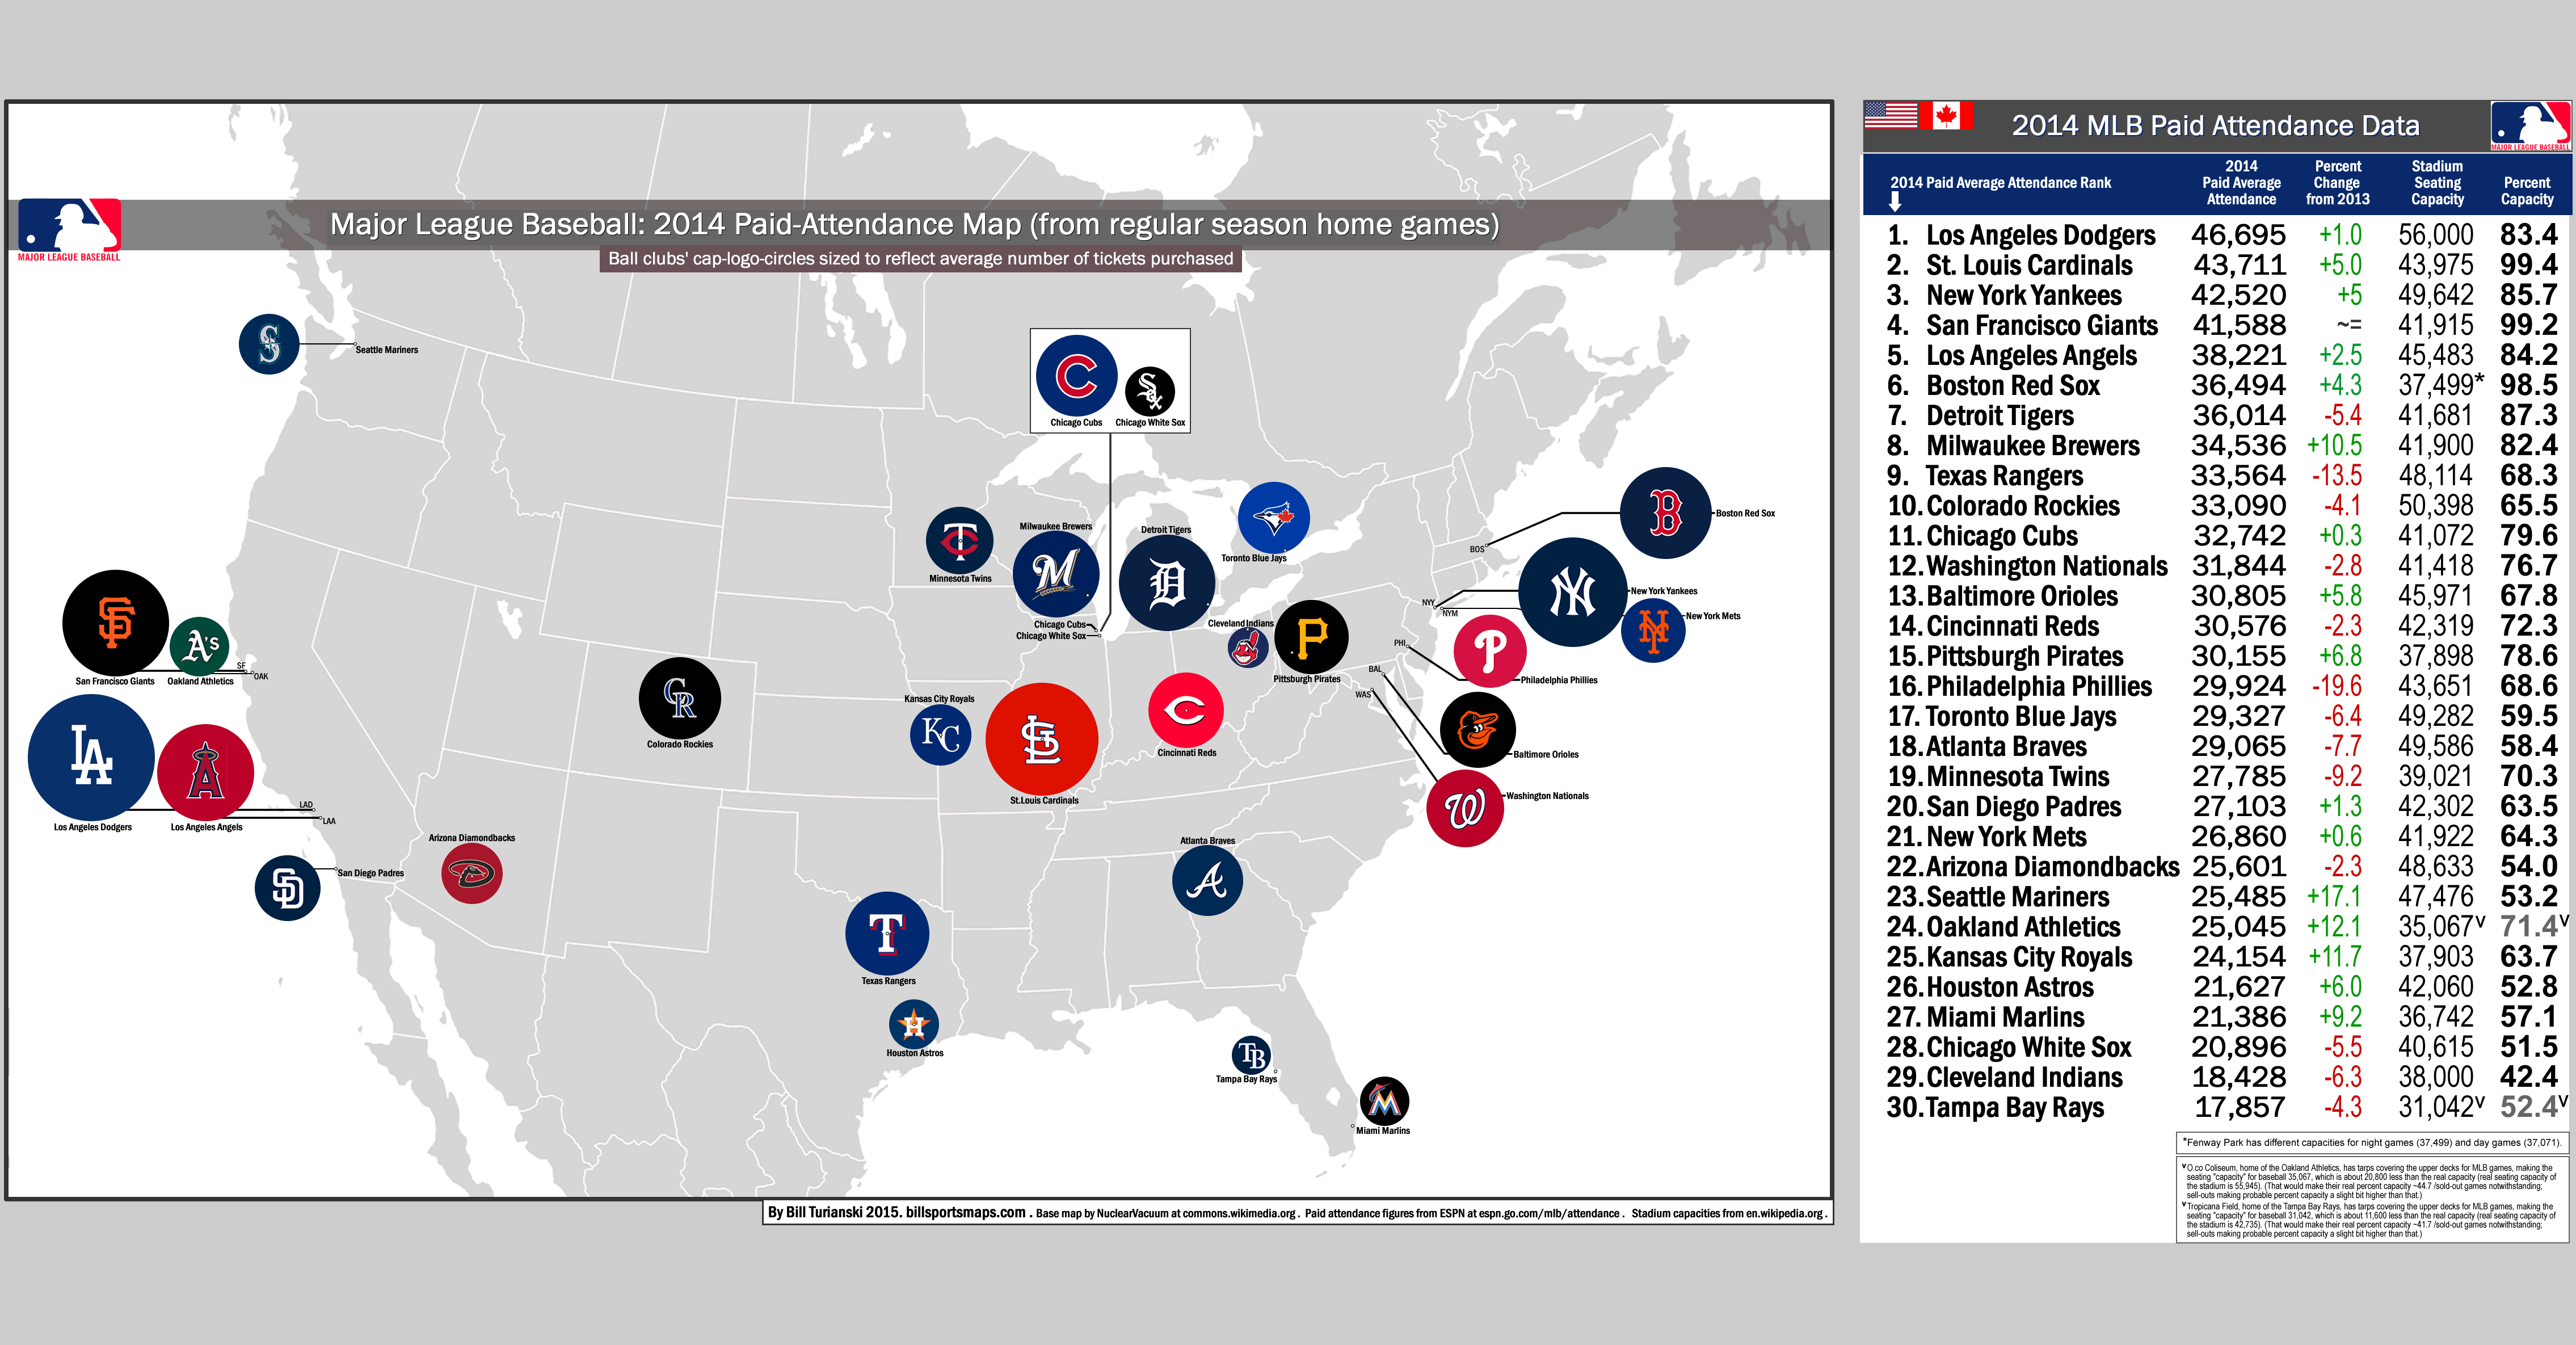
MLB: Paid Attendance (tickets-sold) map for 2014
…
…
Please note: to see the most recent MLB paid-attendance map-and-post, click on the following: category: Baseball >paid-attendance.
…
MLB attendance is defined as tickets sold.
If you buy a ticket for a Major League Baseball game, and then you don’t attend that game, your ticket that MLB sold you still counts in the officially announced attendance figure for that game. To put it another way, MLB attendance figures do not represent actual attendance, but rather, the total tickets sold for that game. The National League used to count turnstile clicks (aka ‘people in seats’), while the American League has always counted tickets sold. In 1992, the National League also began counting tickets sold instead of how many ticket-holders actually attended. Some sources say this was mainly because of revenue sharing (and the need to standardize the bookkeeping for all the MLB franchises), but revenue sharing only began ten years later, in 2002, which was a decade after the NL had started measuring attendance by tickets sold {see this, Attendance figures that count tickets sold, not turnstile clicks, make it hard for fans to reconcile what they hear with the empty seats they see (by Bill Shaikin at the Los Angeles Times)}.
In any case, counting tickets sold rather than turnstile clicks conveniently allows all 30 Major League ball clubs to get away with consistently painting a rosier picture of their attendance than what the reality is. The sad truth of the matter is, late in the season, with respect to games where the home team is out of the Pennant race, many MLB games have actual crowds that are up to around 40% less than the announced crowd size. That is because many fans who had bought tickets for that game earlier in the year then decided that it wasn’t worth attending a meaningless game late in the season, because their basement-dwelling ball club had nothing to play for.
Here is an article on this subject from the New York Times baseball blog, by Ken Belson, from Sept. 22 2012, The Official Attendance Can Become Empty of Meaning (bats.blogs.nytimes.com).
If you think that this is all pretty disingenuous, I won’t argue with that. I will simply point out this…the way that they tabulate official attendance figures in two of the three other major leagues – the NBA and the NHL – is far more dishonest. That is because the NBA and the NHL count tickets distributed toward what their official attendance figures are announced as. [Meanwhile, the NFL leaves it up to the teams, and 30 NFL teams count tickets sold, while the New York Giants and the Pittsburgh Steelers count turnstile clicks/ {see this, specifically paragraph 6 (cbssports.com by John Breech)}; {also see this, which lists the 4 major leagues' attendance-count policies, The book on attendance (utsandiego.com by Mark Zeigler)}].
And when the NBA and the NHL are measuring attendance by tickets distributed, that includes the often sizable number of tickets given away for free {see this article, How Sports Attendance Figures Speak Lies (by Maury Brown of the Biz of Baseball site, at forbes.com)}. And it is even more dishonest, because as they inflate the attendance by measuring it this way, they are inflating the “attendance” figure even more, because that tickets-distributed-attendance-figure includes all tickets distributed…even in those cases when the recipient of the free ticket didn’t even attend the game (seriously). Some NHL teams, particularly those outside of Western Canada and Toronto and Montreal, as well as those outside of the US Northeast and the US Upper Midwest, give away up to 3,000 free tickets a game! Which is how poor-drawing major-league hockey clubs in the Sunbelt, for example, can pretend they have far more ticket-buying fans than they really do. Thankfully, some franchises are seeing the corrosive effects of this (how would you feel if you shelled out big bucks for season tickets for a major-league hockey team, when sitting all around you are people seeing the game for free?)…{see this article from Oct.2014, where one of those under-supported-NHL-Sunbelt teams (the Florida Panthers) now has new ownership that is trying to stop the attendance-figure-dishonesty, by announcing actual turnstile clicks as the announced attendance, The Florida Panthers’ Empty Den (onlyagame.wbur.org)}.
So, at least, when you are given figures that measure not the actual attendance, but instead measure total tickets purchased (as in MLB)…well, you know one thing for sure, and that is that they (the MLB teams) are not lying about how many ticket they sold. They are only lying about the number of actual spectators at (some of) their games.
…
-
Below, 2014 tickets-sold, the biggest change versus 2013 figures: change in tickets-sold of over 1,000 per game
(11 MLB teams with plus-1,000-or-more tickets-sold / 9 MLB teams with minus-1,000-or-more tickets sold)…
Best increases in tickets sold in 2014 (versus 2013)…
Seattle Mariners: +3,738 per game.
Milwaukee Brewers: +3,287 per game.
Kansas City Royals: +2,540 per game.
Oakland Athletics: +2,399 per game.
Pittsburgh Pirates: +2,293 per game.
St. Louis Cardinals: +2,109 per game.
Miami Marlins: +1,802 per game.
Boston Red Sox: +1,516 per game.
New York Yankees: +1,507 per game.
Baltimore Orioles: +1,320 per game.
Houston Astros: +1,234 per game.
Worst decreases in tickets sold in 2014 (versus 2013)…
Philadelphia Phillies: -7,266 per game.
Texas Rangers: -5,145 per game.
Minnesota Twins: -2,803 per game.
Atlanta Braves: -2,400 per game.
Detroit Tigers: -2,502 per game.
Toronto Blue Jays: -1,988 per game.
Cleveland Indians: -1,673 per game.
Chicago White Sox: -1,452 per game.
Colorado Rockies: -1,401 per game.
…
On the map page…
At the far right of the map page is 2014 paid-attendance for all 30 MLB teams, along with 3 other statistics: percent-change from 2013, 2014 ballpark seating capacity, 2014 percent-capacity (which is paid-attendance divided by stadium seating capacity). At the lower right-hand corner of the map page, there are asterisk-type notes on 3 things: Boston’s different home capacities for day games and night games at Fenway Park in Boston, MA; notes on the Oakland A’s pretend-capacity (via huge tarps covering the upper decks at O.co Coliseum in Oakland, CA); and also notes on the Tampa Bay Rays’ pretend-capacity (also thanks to the egregious deployment of tarps, at Tropicana Field in St. Petersburg, FL).
The circular-cap-logos on the map page are all each MLB teams’ 2014 home cap logo, except with respect to Baltimore’s circular-cap-logo, which is of their all-black road cap, because the Orioles wear their white-paneled cap at home, and I wanted to maintain a uniformity to all 30 of the circular-cap-logos on the map. The circular-cap-logos were then sized to reflect crowd size, utilizing a constant gradient (the larger the ball club’s 2014 home regular season average paid-attendance, the larger their circular-cap-logo is on the map). I used cap logos from either the ball clubs’ pages at Wikipedia or at the excellent Chris Creamer’s Sports Logos.net, depending on which was more accurate in terms of actual cap-color as well as in terms of the logo itself (Yankees and Cubs cap logos are wrong at Wikipedia, and it looks like about 17 cap-logo background colors are wrong there as well).
___
Thanks to NuclearVacuum for the blank map, File:BlankMap-North America-Subdivisions.svg (commons.wikimedia.org).
Thanks to ESPN for attendances & percent capacities, espn.go.com/mlb/attendance.
Thanks to Chris Creamer’s Sports Logos.net, for several (~17) of the cap logos, sportslogos.net.
Thanks to the contributors at en.wikipedia.org, en.wikipedia.org/wiki/Major_League_Baseball#Current_teams.
