billsportsmaps.com

November 15, 2016

NCAA Division I Men’s Ice Hockey – 2015-16 average attendance map of all 60 teams in D1-hockey (with arena capacities & percent capacities).

Filed under: Hockey,NCAA ice hockey map 2011,2016,NCAA, ice hockey — admin @ 6:09 pm

ncaa_ice-hockey_attendance-map_2015-16_60-teams_post_b_.gif
NCAA Division I Men’s Ice Hockey – 2015-16 average attendance map of all 60 teams in Division I (with arena capacities & percent capacities)


By Bill Turianski on 15 November 2016; twitter.com/billsportsmaps.

Links…
-D1 Men’s Hockey coverage…uscho.com.
-Teams, etc…College ice hockey/Division I (en.wikipedia.org).

-Conference-maps for NCAA Division I (aka D1) men’s ice hockey
(Note: already-posted D1-hockey conference maps are linked-to, below.)
I am making a location-map for each of the 6 D1-hockey conferences, which are…
Atlantic Hockey Association (11 teams/est. 1998-99/ zero titles).
Big Ten Conference hockey (6 teams [7-teams in 2017-18]/est. 2013-14/ 23 titles won amongst its six teams).
ECAC Hockey (12 teams/est. 1961-62/ 7 titles won amongst its twelve teams).
∙Hockey East Association (12 teams [11 teams in 2017-18]/est. 1984-85/ 13 titles won amongst its twelve teams).
National Collegiate Hockey Conference (aka NCHC) (8 teams/est. 2013-14/ 18 titles won amongst its eight teams).
Western Collegiate Hockey Association (aka WCHA) (10 teams/est. 1951-52/ 8 titles won amongst its ten teams).

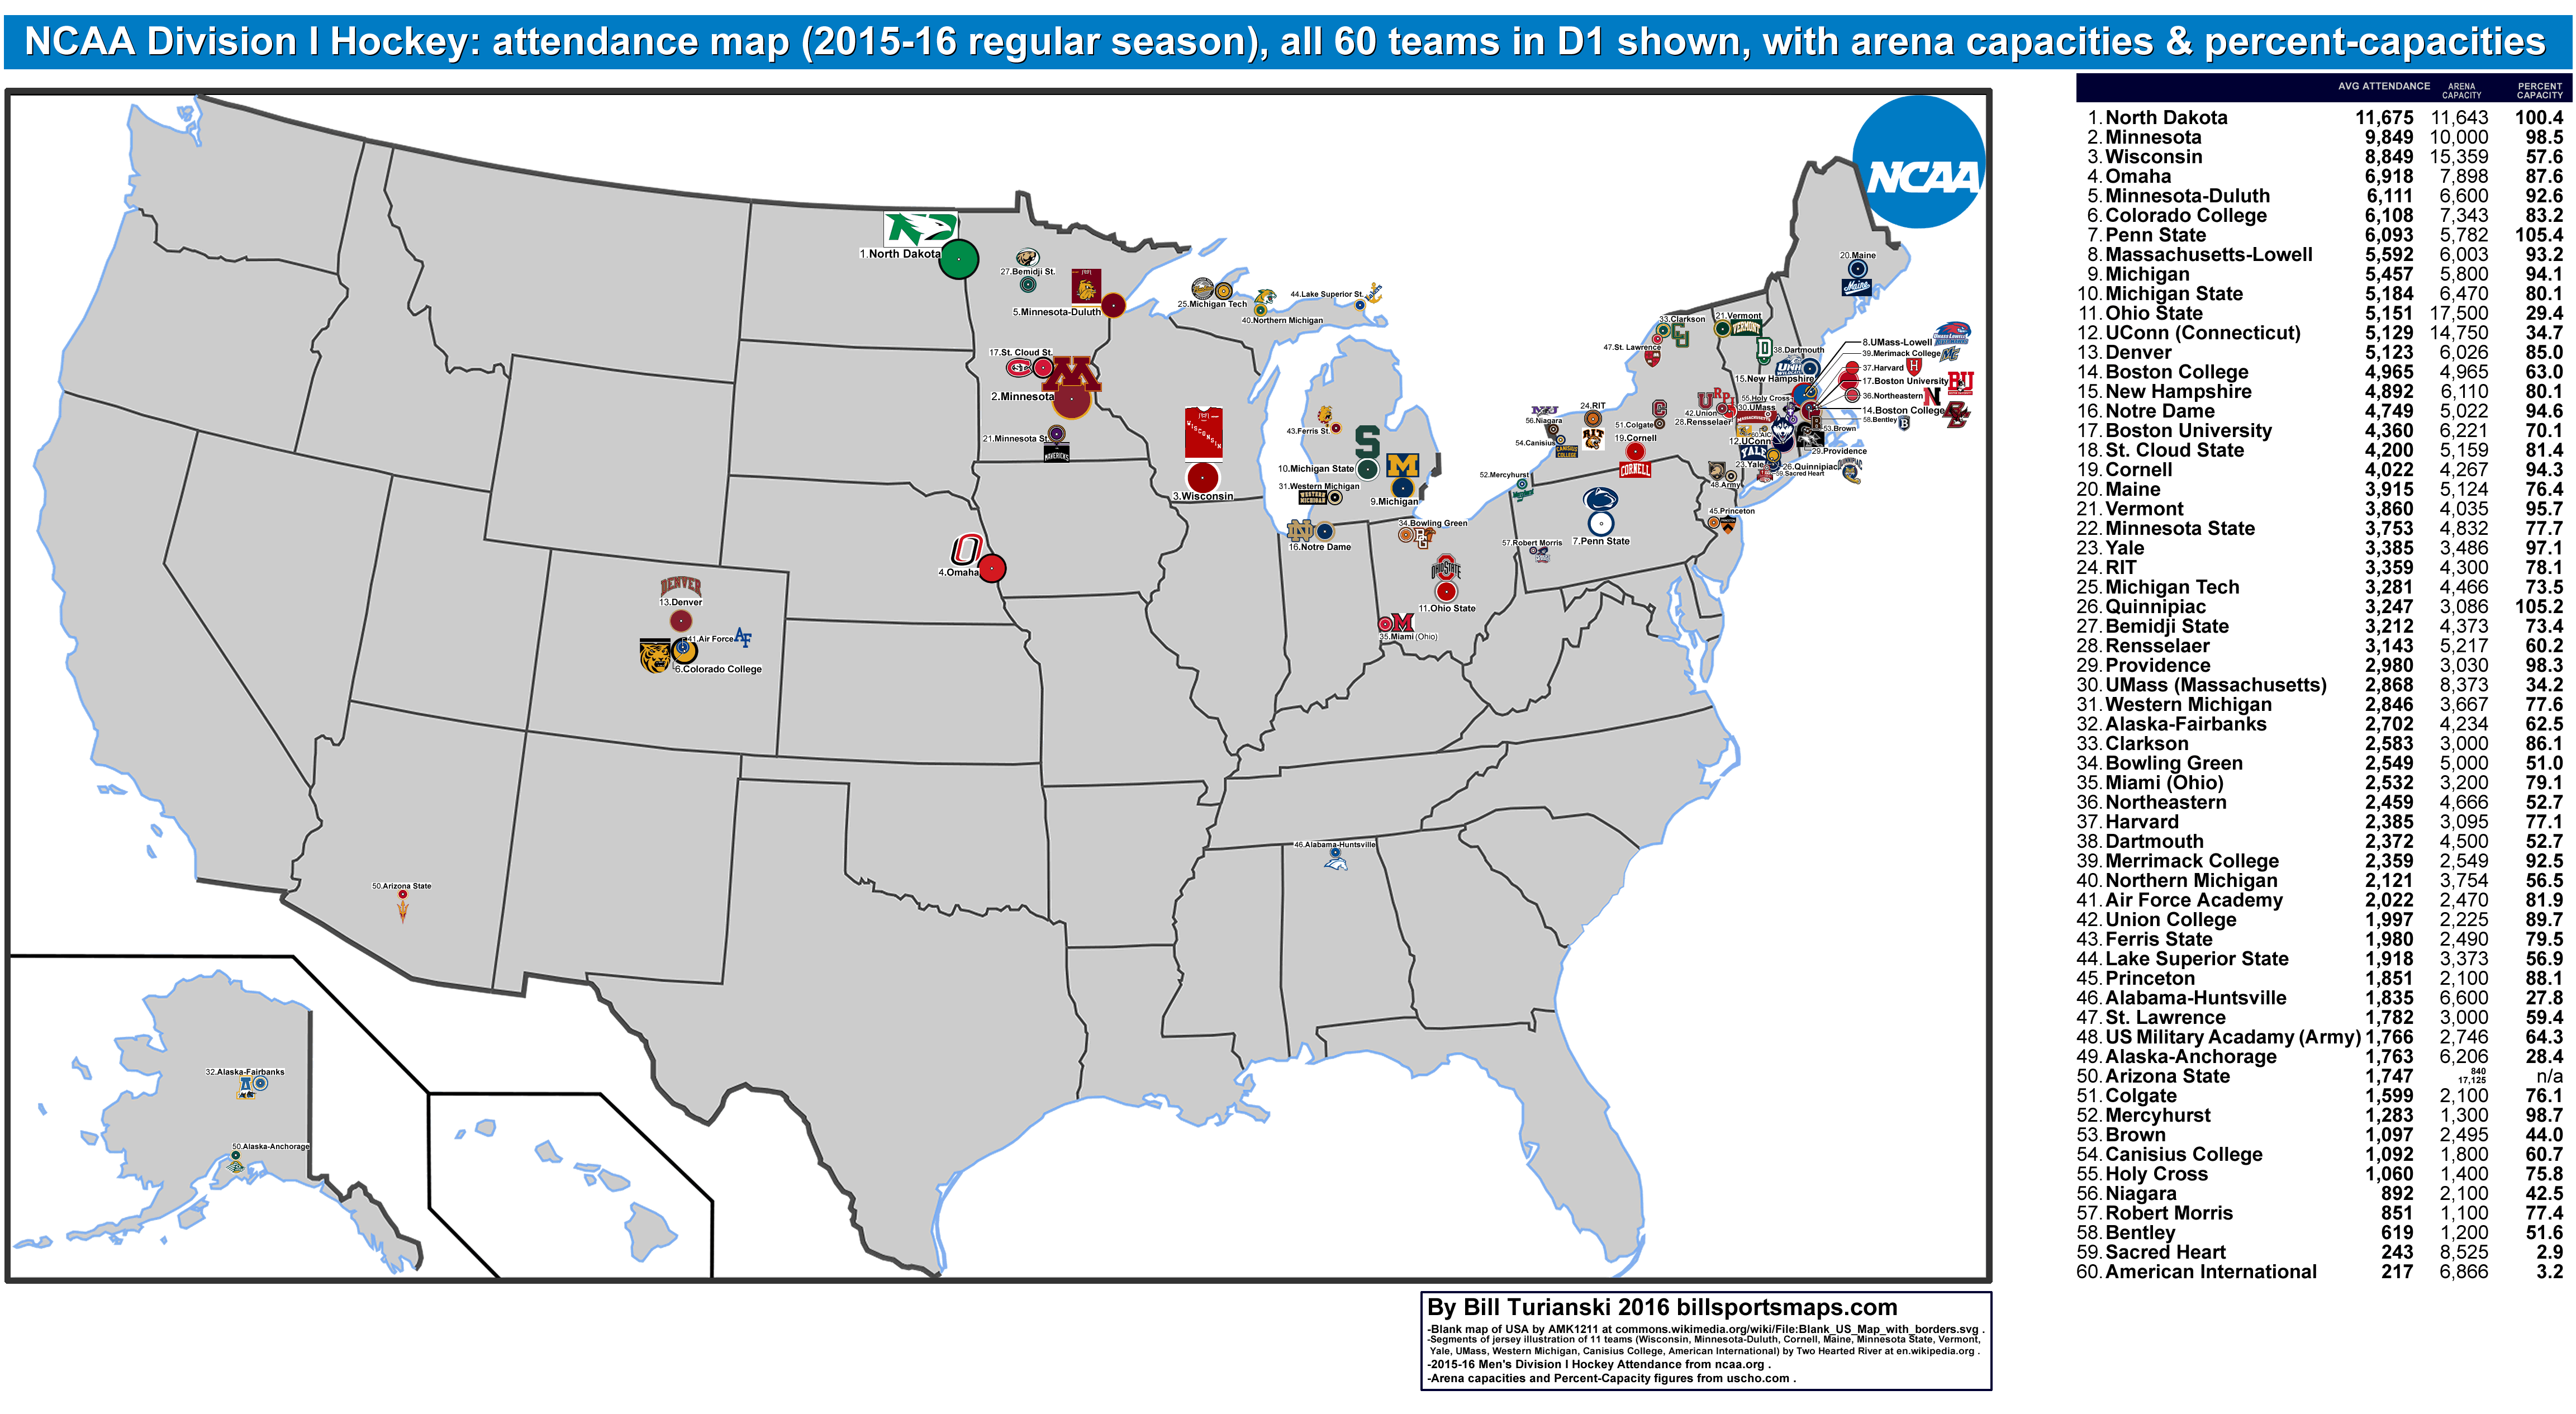
Here is a list of all D1-hockey teams (14 teams) which drew above 90 percent-capacity in 2015-16…
Team [location], percent-capacity, average attendance, (D-1 attendance-rank).
Penn State Nittany Lions [of University Park, PA], 105.4% at 6,093 per game (#7 in attendance).
Quinnipiac Bobcats [of Hamden, Greater New Haven, CT], 105.2% at 3,247 per game (#27 in attendance).
North Dakota Fighting Hawks [of Grand Forks, ND], 100.5%, at 11,675 per game (#1-best attendance).
Mercyhurst Lakers [of Erie, PA], 98.7%, at 1,283 per game (#54 in attendance).
Minnesota Golden Gophers [of Minneapolis/St. Paul, MN], 98.5% (#2 in attendance.
Providence Friars [of Providence, RI], 98.3%, at 2,980 per game (#29 in attendance).
Yale Bulldogs [of New Haven, CT], 97.1%, at 3,385 per game (#23 in attendance).
Vermont Catamounts [of Burlington, VT], 95.7%, at 3,860 per game (#21 in attendance).
Notre Dame Fighting Irish [of Notre Dame, IN], 94.6%, at 4,749 per game (#16 in attendance).
Cornell Big Red [of Ithaca, NY], 94.3%, at 4,022 per game (#19 in attendance).
Michigan Wolverines [of Ann Arbor, MI], 94.1%, at 5,457 per game (#10 in attendance).
UMass-Lowell River Hawks [of Lowell, Greater Boston, MA], 93.2%, at 5,592 per game, at 6,111 per game (#5 in attendance).
Minnesota-Duluth Bulldogs [of Duluth, MN], 92.6%, at 6,111 per game (#5 in attendance).
Merrimack College Warriors [of North Andover, Greater Boston, MA], 92.5, at 2,359 per game (#39 in attendance).

Division I NCAA hockey was instituted in 1948.
(Division I NCAA hockey titles, 1948 to 2015-16/ 69 titles.)
The inclusion of Penn State as a D1-hockey team (who debuted in 2012-13), led to the 2011-2013-era realignment in D1-hockey. The shakeup in D1-hockey conferences occurred in much the same way (and in nearly the same time-period) as the recent realignments in NCAA D1-football and in NCAA D1-basketball. After the dust had settled in D1-hockey, there was 6 conferences instead of 5, and one conference was dissolved – the Central Collegiate Hockey Associaition (CCHA). (The CCHA existed as a D1-hockey conference from 1973-2013.) (Note: there is one D1-hockey team that is currently an Independent, newcomers Arizona State.)

Since 2013-14, there are two new conferences in D1-hockey:
Big Ten Conference hockey,
National Collegiate Hockey Conference (NCHC).

    The highest-drawing NCAA college hockey team & the 2016 NCAA Division I champions:
    The University of North Dakota (of Grand Forks, ND
    ).

-From USA Today.com from April 10, 2016, North Dakota beats Quinnipiac 5-1 to capture NCAA hockey title (usatoday.com).
-From the official UND site, Ralph Englestad Arena (article, with photos, at undsports.com).
University of North Dakota hockey team – 2016 Division I champions…
north-dakota_fighting-hawks_hockey_2016-div1-champs_2016-best-attendance_ralph-engelstad-arena_grand-forks-nd_d_.gif

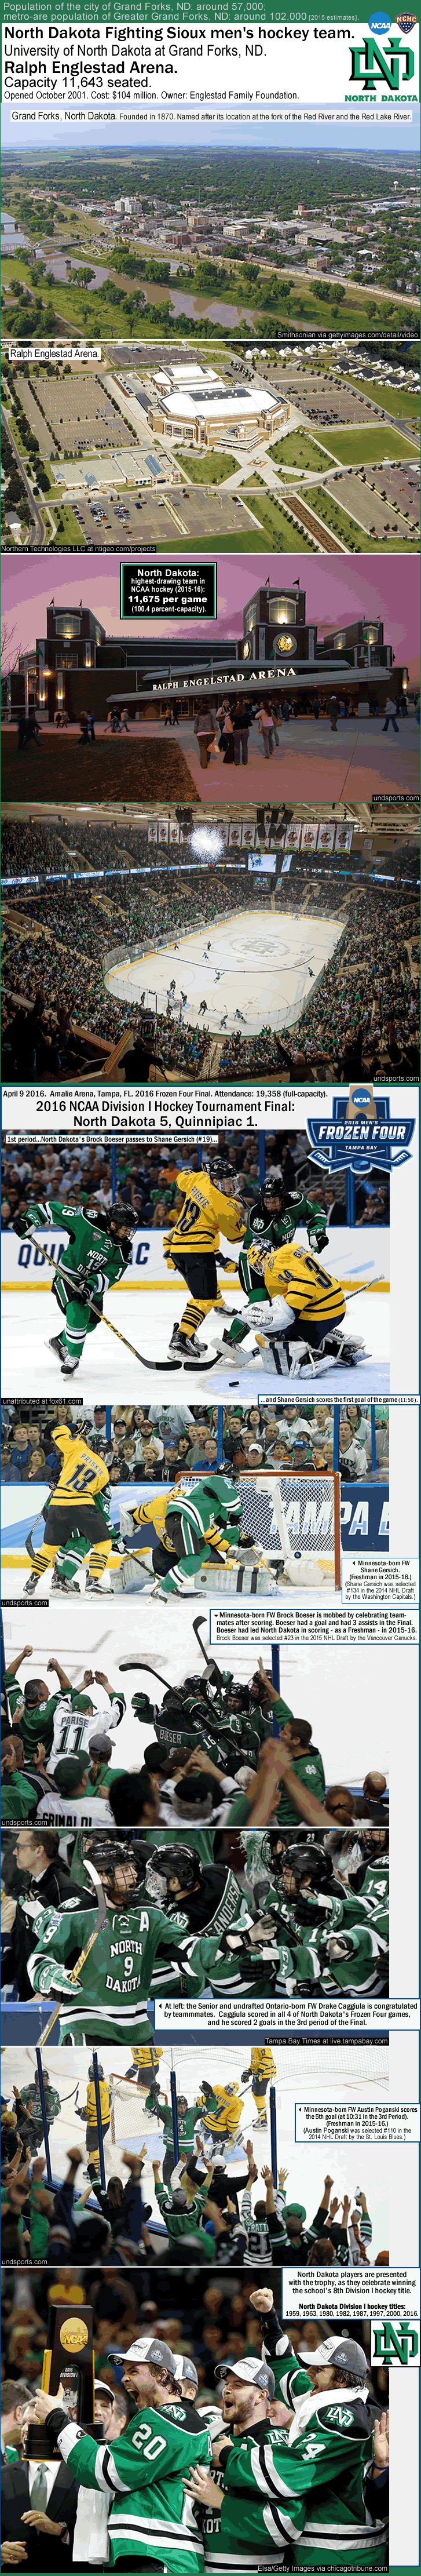
Photo and Image credits above -
Aerial view of Grand Forks [video image] from Smithsonian via gettyimages.com/video/view-of-grand-forks-town-square-and-red-river-grand-stock-footage. Shot of exterior of Ralph Englestad Arena at twilight, photo by undsports.com. Aerial shot, photo by Northern Technologies, LLC at ntigeo.com/projects/project-example-two-2 [Ralph Englestad Arena]. Interior shot of full crowd at the Ralph, photo by undsports.com. Game-action shot of 2016 Final, photo unattributed at fox61.com [New Haven, CT]. 4 game-action shots of 2016 Final, photos by UNDsports.com at undsports.com/PhotoAlbum [2016 Final]. Drake Caggiula slapping teammates gloves, photo by Tampa Bay Times at live.tampabay.com/Event/Live_blog_2016_Frozen_Four_in_Tampa. North Dakota players getting the trophy, photo by Elsa/Getty Images via chicagotribune.com/sports/college.

__
Thanks to all at the following links…
-Thanks to AMK1211 for blank map of USA, ‘File:Blank US Map with borders.svg”>File:Blank US Map with borders.svg‘ (commons.wikimedia.org).
-Thanks to Two Hearted River at en.wikipedia.org/[each teams' page at Wikipedia], for small segments of jersey illustrations of several teams (Wisconsin, Minnesota-Duluth, Cornell, Maine, Minnesota State, Vermont, Yale, UMass, Western Michigan, Canisius College, American International), such as at File:ECAC-Uniform-Cornell.png.
-Thanks to USCHO site for attendance data, Men’s Division I Hockey Attendance: 2015-2016 (uscho.com).

October 20, 2011

NCAA Division I Men’s Ice Hockey – 2010-2011 average attendance map of all 58 teams in Division I.

Filed under: Hockey,NCAA ice hockey map 2011,2016,NCAA, ice hockey — admin @ 9:40 pm

Please note:
There is a more recent map (2016) of D1-hockey attendance; click on the following,
NCAA Division I Men’s Ice Hockey – 2015-16 average attendance map of all 60 teams in D1-hockey (with arena capacities & percent capacities).
.
.
.
.
.
.
.
.
.
.
ncaa_ice-hockey_2010-attendances_post_e.gif
NCAA Ice Hockey Attendance Map


The 2011 Frozen Four was comprised of Michigan, Minnesota-Duluth, North Dakota, and Notre Dame. And on April 9, 2011, the 2011 NCAA men’s ice hockey champions were the Minnesota-Duluth Bulldogs, who beat Michigan 3-2 in overtime. This was Minnesota-Duluth’s first ice hockey title. The team has made 4 Final Four appearances and 7 NCAA Men’s Ice Hockey Tournament appearances (16 teams currently qualify for the tournament). Minnesota-Duluth averaged 5,810 per game in 2010-11, which was 9th-best in the 58-team Division I men’s ice hockey set-up.

The highest-drawing team was once again the Wisconsin Badgers, who pulled in 13,226 per game last season. The Badgers played to a 86.8 percent-capacity at the 15,237-capacity Kohl’s Center in Madison, WI. The Badgers men’s ice hockey team have made 12 Frozen Four appearances and have won 6 NCAA titles (last in 2006).

michigan-stadium_104thousand-in-attendance_outdoor-ice-hockey-game_.gif

Helped by playing a game in the school’s football stadium, the Michigan Wolverines‘ men’s ice hockey team had the second-highest average attendance in 2010-11, at 12,291 per game. 104,173 packed in to Michigan Stadium on December 11, 2010, to see the Wolverines beat their in-state rivals the Michigan State Spartans by the score of 5-0. That game now tops this list, ‘List of ice hockey games with highest attendance‘ (en.wikipedia.org). The Wolveines have won 9 NCAA men’s ice hockey titles (but none since 1998). The Wolverines have the most titles in men’s ice hockey and have made 23 Frozen Four appearances (the most), as well 21-tournament-appearances consecutively (since 1991). That 21 straight tournament appearances is also a record. The Wolverines men’s ice hockey team plays at the 78-year-old, 6,637-capacity Yost Ice Arena.

Third highest-drawing team last season was the North Dakota Fighting Sioux. They played to 101 percent-capacity, drawing 11,756 per game at the 11,640-capacity Ralph Englestad Arena in Grand Forks, ND. Grand Forks has a metro area population of around 98,000 {2010 figure}, so that 11,700 per game is pretty darn impressive for the 7-time-champions the Fighting Sioux.

Fourth-highest-drawing last season was the Minneapolis/St. Paul-based Minnesota Golden Gophers, who played to 95.4 percent-capacity and drew 9,544 per game. The Golden Gophers have 5 men’s ice hockey titles (last in 2003), and 19 Frozen Four appearances. The state of Minnesota has 5 Divison I men’s ice hockey teams – Minnesota, St. Cloud State, the aforementioned Minnesota-Duluth, Bemidji State, and Minnesota State [Mankato, MN] – and between them they cumulatively averaged over 28,000 per game in 2010-11.

Fifth-highest-drawing team was the Nebraska-Omaha Mavericks, who averaged 7,994 per game at the 16,680-capacity CenturyLink Center in Omaha, NE. The Mavericks have never made a Frozen Four, and have just 2 NCAA Men’s Ice Hockey Tournament appearances.

Sixth-highest-drawing last season was the Colorado College Tigers, who drew 6,687 per game to the 8,000-capacity Colorado Springs World Arena and Ice Hall, for a solid 91.1 percent-capacity figure. Colorado College won their 2 NCAA men’s ice hockey titles early on in the competition’s history, in 1950 and 1958 (the tournament was first played in 1948, and initially was only a 4-team field). 7 of Colorado College’s 10 Frozen Four appearances occurred in the 1940s and the 1950s (their last Frozen Four was in 2005). There are 3 Division I men’s ice hockey teams in the state of Colorado – Colorado College, Denver University, and Air Force Academy – and the 3 teams cumulatively averaged over 13,500 per game last season.

Two seasons ago, 2010 Frozen Four winners were Boston College, who won their fourth NCAA Ice Hockey title then. In 2010-11, the Boston College Eagles drew 7th-best in Division I. The Eagles averaged 6,292 per game in 2010-11 at the 7,884-capacity Conte Forum in Chestnut Hill, MA [5 miles west of Boston]. Boston College’s 79.8 percent-capacity was among 26 Division I teams that had a percent-capacity above 75%. Boston College is one of 5 Div. I hockey teams in the Boston metro area (plus there are 3 more nearby), and between those 5 – Boston College, Boston University, Harvard, Northeastern, and Bentley College – they cumulatively averaged over 16,000 per game last season.

The map shows all 58 NCAA Division I Ice Hockey teams’ locations. Each teams’ circle is in team colors and is sized to reflect 2010-11 average attendance (from home games, with ~14-22 home games per team). Text size and team logos are also sized. Attendances are listed at the far right. Also listed are each team’s NCAA Division Men’s I Ice Hockey titles (and years the team were the champion). To see stadium capacities and percent-capacities by team, go to the US Hockey Online link 4 paragraphs down [Note: you might also be interested in checking out another link at the bottom of this post, which is the Hockey News' poll of favorite college hockey jerseys (from 2008).]

Conferences that each team are in can be seen by going to the following page at en.wikipedia.org, ‘NCAA Hockey Division I [map]‘.

This is the first time I have covered this subject, and I am just getting up-to-speed on the goings-on, of which there have been plenty, recently. That is because, just like college football, college ice hockey is in the midst of some pretty drastic re-alignments. In 2013-14, a new Division I hockey program will be born in Penn State. Also in 2013-14, the Big Ten will be starting an ice hockey conference. Michigan, Michigan State, Minnesota, Ohio State, and Wisconsin announced in March 2011 that they will leave the CCHA (Central Collegiate Hockey Association) to join the Big Ten for 2013-14.

Excerpt from en.wikipedia.org…”In response to the creation of the Big Ten hockey conference, Miami University [Miami of Ohio] will join Denver, Colorado College, North Dakota, Nebraska-Omaha, and Minnesota-Duluth of the WCHA (Western Colege Hockey Association) to create the National Collegiate Hockey Conference. In response to the creation of the National Collegiate Hockey Conference, Northern Michigan University will join the WCHA in 2013. Invitations to join the WCHA were eventually extended to Alaska-Fairbanks, Bowling Green, Ferris State, Lake Superior State, and Western Michigan in late August of 2011. Alaska-Fairbanks, Ferris State and Lake Superior State have accepted and will join Northern Michigan into the WCHA in 2013. Western Michigan and Notre Dame have been rumored as the 7th and 8th additions to the new NCHC…”{end of excerpt}

I may not know much about NCAA hockey, but I know this: having the two Alaska teams in different conferences was always a ridiculous situation, so at the very least all this re-shuffling will have accomplished putting the Alaska-Anchorage Seawolves and the Alaska-Fairbanks Nanooks in the same conference.
National Collegiate Hockey Conference [to be instituted in 2013-14]‘.

I will be posting a map for the 2012 Frozen Four competition in March, which will include an all-time list of Frozen Four appearances by team.
_

Thanks to U.S. College Hockey Online.com for 2010-11 Division I Men’s Ice Hockey average attendance figures.
Thanks to The Hockey News.com, for this article ‘The Hockey News’ ECAC, WCHA and AHA Jersey Rankings [Aug.27 2008]‘.
Thanks to the contributors to the pages at en.wikipedia.org, ‘College Ice Hockey‘.

Thanks to Mr_Math_14 for, 5 years after the fact, re-posting this map on Reddit.com/r/college-hockey, Blast from the (recent) past: 2010-2011 Average Attendance Map – Midwest, my how things change… .

Powered by WordPress