billsportsmaps.com

November 30, 2008

2008-’09 FA Cup. Clubs from the Second Round that remain for the Third Round Draw.

Filed under: 2008-09 FA Cup — admin @ 5:21 pm

[Now Updated to 29th December...Droylesden ruled out/ Chesterfield now in  {see this (from the FA site) }.

{FA to rule Monday, 29th December on Droylsden roster irregularity  {see this}.

Through 23rd December: Droylsden 2-1 Chesterfield. {see this (Sky Sports)}.

Through 16th December: Blyth Spartans 1-0 Bournemouth;  Droylesden 0-2 Chesterfield, abandoned after 72 minutes (floodlight failure).

Through 10th December: Kettering Town 2-1 Notts County.

Through 9th December: Chesterfield 2-2 Droyslden (Replay necessary);  Stockport County 1-2 Gillingham;  Tranmere Rovers 1-2 Peterborough United. 

Through 3rd December: Morecambe 2-3 Cheltenham Town;  Carlisle United 0-2 Crewe Alexandra. ]

2008-09_fa-cup_2nd-round-clubs-which-survived-for_3rd-round-draw_post_b.gif


FA Cup Third Round Draw,  {Click here}.  Fixtures {Click here}.

Histon shocks Leeds United {see this}.   Second Round Results {see this].

November 29, 2008

FA Cup, the 44 clubs to be added to the 3rd Round Draw (ie, 20 Premier League clubs, and 24 League Championship clubs).

Filed under: 2008-09 English Football,2008-09 FA Cup — admin @ 4:28 pm

2008-09_fa-cup_3rd-round_44clubs-from-premier-league_and-league-championship_post.gif


I have never made a map of the top two divisions in England,  so this was a good opportunity to do so.  Plus, you can see each club’s gate figures, and the percentage change from last season.   Late Sunday I will post the map of the Second Round Proper,  updated.

Thanks to Tony’s English Football site, for the gate figures (which are from 25th November, 2008),  {Click here}.

November 28, 2008

2008-’09 FA Cup Second Round Proper, 28-30th November, 2008 (featuring Barrow AFC).

Filed under: 2008-09 English Football,2008-09 FA Cup — admin @ 9:17 am

afc-barrow_holker-street_segment.gif
 FA Cup Second Round Proper Map, Click on the follwing title…2008-09_fa-cup_2nd-round_games-for-29th-november_updated-18-nov.gif

Fixtures, results {Click here (BBC site) }.   The English FA Cup, Second Round Proper starts this weekend,  with 2 matches scheduled for Friday,  15 matches for Saturday,  and two for Sunday.   One of the matches Friday is Barrow AFC v. Brentford FC,  to be broadcast on Setanta.   Barrow-in-Furness is up in the north-west of England,  in Cumbria.   Barrow are in the Conference this season,  currently struggling,  in 17th place;  Brentford (from Hounslow,  in west London) are playing well in League Two,  in 6th place.    Thanks to Tims 92 site {Click here}.    Thanks to dub steps site.   Here is the visit to Barrow AFC that dub steps (formerly Hobo Tread) site made {Click here}.

Here is a profile of Hoker Street ground from the BBC Non-league show page  {Click here}. .

November 26, 2008

NCAA Division I-A / Football Bowl Subdivision, the Big East: Team Profiles and Attendance Map (2007 figures).

Filed under: NCAA Gridiron Football,NCAA/fb-Big East — admin @ 7:08 am

ncaa_big-east_team-profiles_2007attendance-map_post_.gif


The Big East’s football conference began play in 1991.  I wrote a bit about the conference last November {see this}.


The Big East’s football conference combines a few schools with storied pasts:  PittsburghSyracuse,  and West Virginia,  with some schools that never really had football programs to brag about,  but are now improving:  CincinnatiConnecticutRutgers,  and South Florida.   Louisville is the other school in the conference,  and is sort of in both categories. 

Friday, the 101st edition of the Backyard Brawl will take place,  as the West Virginia Mountaineers visit the Pitt Panthers (who are #25 in the BCS)  {see this}.  Here is an article from USA Today on the 100th Backyard Brawl  {Click here}.

pitt-westvirginia_1908.gif

-

South Florida has seen their average attendance rise from 30,222 in 2006;  to 53,170 last season.  That rise of nearly 23,000 vaulted them from 76th highest to 38th highest.  The nascent USF football program has only been in existence since 1997.

south-florida-bulls_attendance-increase07.gif

Thanks to http://www.nationalchamps.net/NCAA/database/index.h.   Thanks to the contributors to the Big East football pages on Wikipedia.   Thanks to AP Poll Archive  {Click here}.  

Thanks to http://gobearcats.cstv.com/.   Thanks to http://www.scarletknights.com/football/history/first-game.asp  (Click on it and check out the nice illustration of what the first college football game looked like, in 1869: Princeton vs. Rutgers.)    Thanks to Ask-ville  {Click here}.   Thanks to The Sports Fanattic Shop {Click here}.

Thanks to Helmet Hut  {Click here};   The Helmet Project  {Click here};   Chris Creamer’s Sports Logos Page  {Click here}.;   Logo Server  {Click here};   Logo Shak  {Click here}.

November 24, 2008

Junior Hockey in Canada: The QMJHL, 2008-09 Season.

Filed under: Canada,Hockey — admin @ 6:39 am

Please note: I have made a more recent map-and-post of the QMJHL (May 2016), here:
Ligue de Hockey Junior Majeur du Québec (LHJMQ) [English: Quebec Major Junior Hockey League (QMJHL)]: location-map with: 2015-16 attendance data, QMJHL titles & CHL/Memorial Cup titles listed/+ illustrations for the 2 QMJHL teams with the best attendance in 2015-16 (the Quebec Remparts & the Halifax Mooseheads), and the 2 QMJHL teams with the best-percent-capacity figures in 2015-16 (the Rouyn-Noranda Huskies & the Val-d’Or Foreurs).
.
.
.
.
.
.
.
.
.
.
.
.
.
.
.
qmjhl_hockey-08-09_post.gif


The Quebec Major Junior Hockey League was formed in 1969,  from a merger of two junior leagues in the province of Quebec.  In the French it is called la Ligue de Hockey Junior Majeur du Quebec,  and its abbreviation in the French is LHJMQ. 

The QMJHL is one of three junior hockey leagues in Canada.  The other two are the Ontario Hockey League and the Western Hockey League.   These three leagues are governed by the umbrella organization called the Canadian Hockey League.  All three leagues are for players aged 16 to 20 years old,  after which they are eligible for the National Hockey League Draft. 

[Note: I made maps of both the OHL and the WHL earlier this year:  to see them,  click on "Canada" in the Categories list]. 

In the early days of the QMJHL,  most of the teams were within a few hours drive of Montreal.  Shawingun is the sole team that has remained in the same city,  uninterrupted.  Starting in 1994,  the ”Q” began to expand into the Maritime provinces of New Brunswick,  Nova Scotia,  Newfoundland,  and Prince Edward Island.  This was to fill the void left when the American Hockey League (the largest minor-league hockey entity) pulled its teams out of cities in the Maritimes.  In 2003,  the team from Sherbrooke,  Quebec moved across the border to Lewiston, Maine,  USA.  That club became the Lewiston MAINEiacs;  they won the league title,  called the President’s Cup,  in 2007.  Last season,  the championship was won by the Gatineau Olympique (Gatineau is just across the Ottawa River from the Canadian national capital of Ottawa).

The QMJHL is known for it’s swift,  offense-oriented style of play;  it has traditionally produced profficient skatrs and goal scorers,  as well as stand-out goalkeepers (the NHL is chock full of French-Canadian goalies).  QMJHL alumni who have been elected to the Hockey Hall of Fame include Guy Lafluer,  Pat Lafontaine,  Mario Lemieux,  and Patrick Roy.

Here is a list of the 10 highest drawing junior hockey teams in North America [it has been updated] {Click here}.  The Qubec Remparts drew the most in 2007-08,  averaging 10,981;  the other team from the “Q” in the top 10 then was the Halifax Mooseheads, whose average gate was 7,589.  As a whole,  the QMJHL averaged 3,612 per game in 2007-08.

As with my other two Canadian junior hockey league maps,  this map is not an attendance map per se,  as it shows all the team crests at an equivalent size.  Attendances are listed in the chart on the left hand side,  though,  along with the populations of each team’s home metropolitan area.  In some cases,  of course,  there is no metro area…the team plays literally in a small town.  In fact,  the reigning champions,  the Rouyn-Naranda Huskies,  hail from a mining town of about only 40,000 inhabitants.  Two teams draw around 10% of their home town’s population: the Rimouski Oceanic,  and the Cape Breton Screaming Eagles,  of Sydney,  Cape Breton,  Nova Scotia.  On the other hand,  as with the OHL and the WHL,  there are QMJHL teams that play in the metro area of cities which have franchises in the world’s biggest hockey league,  the NHL.  Gatineau must “compete” with the NHL’s Ottawa Senators;  as must the new team called the Montreal Junior Hockey Club with the storied Montreal Canadiens (the NHL team with the most titles,  and the highest avearge attendance).  But fans in these cities who go to junior hockey games instead of NHL games do so for different reasons.  First of all,  it is way cheaper.  Secondly,  they can usually get better seats.  And perhaps most of all,  they can see the stars of tommorrow playing for a hockey club the fans can feel more a part of.

QMJHL site, in English  {Click here}.

QMJHL standings {click here}.

Wikipedia’s page on the QMJHL  {Click here}.

Thanks to this site,  for the attendance figures… http://www.mib.org/~lennier/hockey/leagueatt.cgi.


November 20, 2008

NCAA Division I-A / Football Bowl Subdivision, the Big 12: Team Profiles and Attendance Map (2007 figures).

Filed under: NCAA Gridiron Football,NCAA/fb-Big 12 — admin @ 10:02 am

ncaa_football_big-12_team-profiles_2007attendance-map_post_.gif


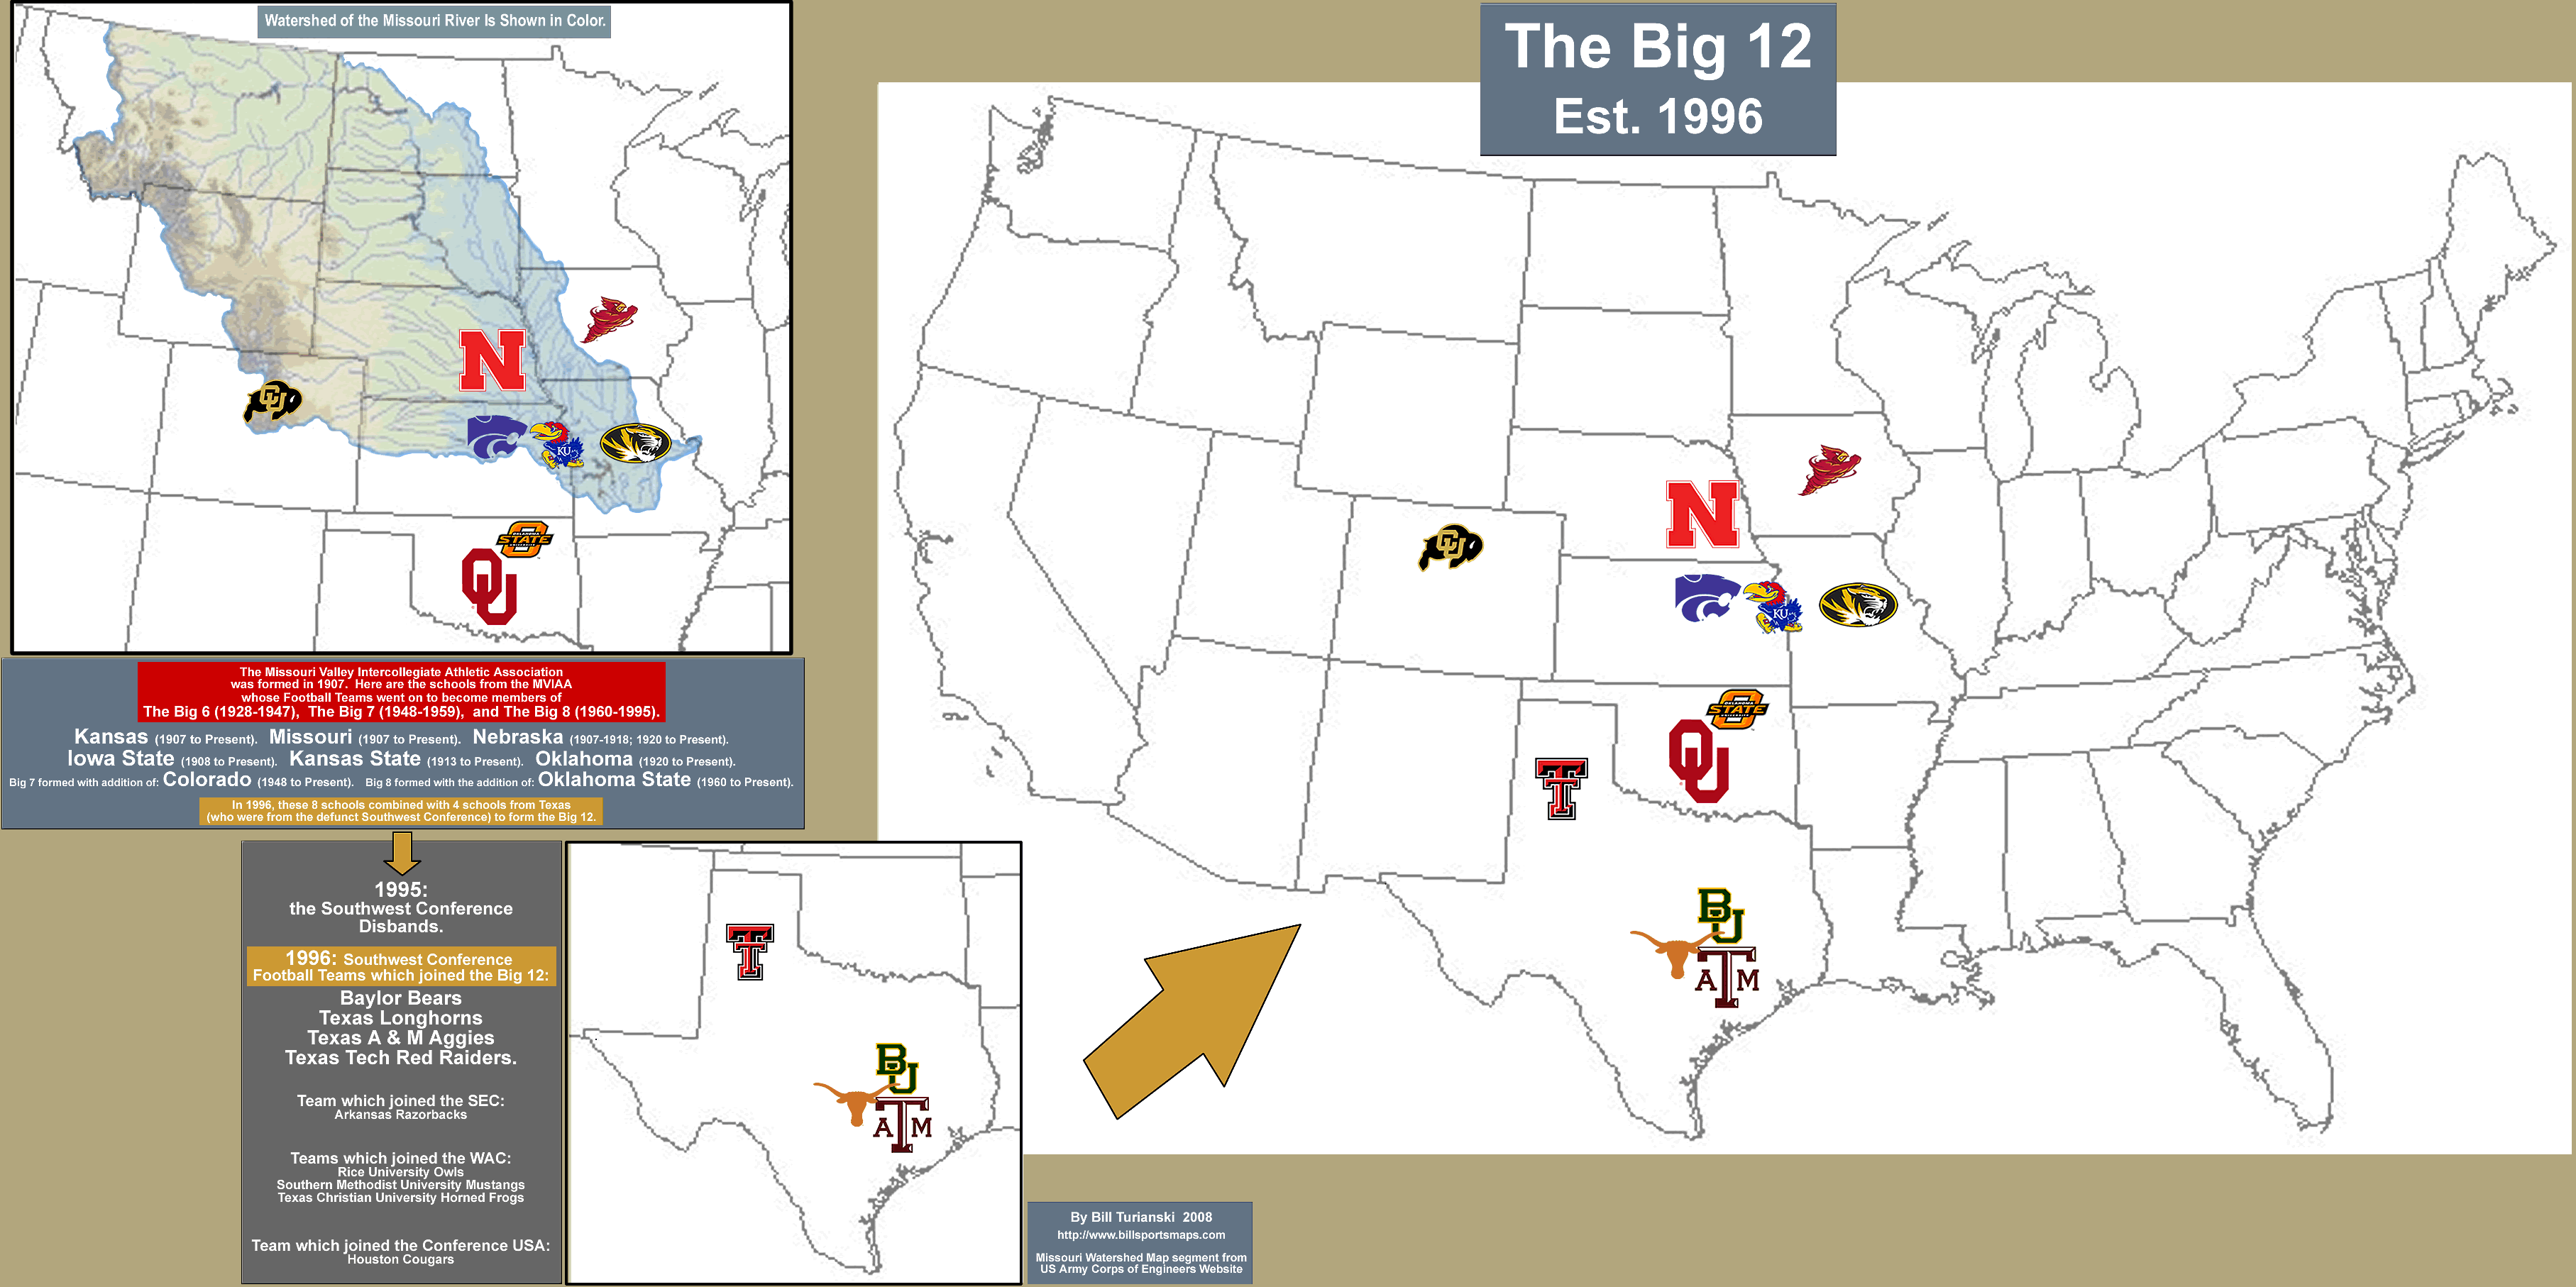
The Big 12 was formed in 1994,  when the Big 8 merged with 4 schools from Texas that had come from the just-disbanded Southwest Conference.   The first season of Big 12 football was in 1996.

The Big 8 has it’s origins in the Missouri Valley Intercollegiate Athletic Association,  which began football competition in 1907.   Founding schools were the University of Kansas (Lawrence, KA),  the University of Missouri (Columbia, MO),  the University of Nebraska (Lincoln, NE),  and Washington University (St. Louis, MO).   The next year, 1908,  Drake University (Des Moines, IA)  and Iowa State (Ames, IA) joined.   Kansas State (Manhattan, KA) joined in 1913.   Grinnell College (Grinnell, IA) joined in 1919.   The University of Oklahoma (Norman, OK) joined in 1920.    Oklahoma A & M (Stillwater, OK) joined in 1925;  this school is now called Oklahoma State.

Three years later,  though,  Oklahoma A & M left the conference, along with the smaller schools,  to form the Missouri Valley Conference (the MVC). 

The other large schools remained together as the MVIAA;  the conference began to become popularly known as the Big 6…Iowa State,  KansasKansas StateMissouriNebraska,  and Oklahoma.

The Big 6 remained stable throughout the 1930s and World War II.   In 1948,  the University of Colorado (Boulder, CO) joined,  and the conference became known as the Big 7

A decade later,  Oklahoma State rejoined,  and began play for football in 1960.   The conference then became known as the Big 8

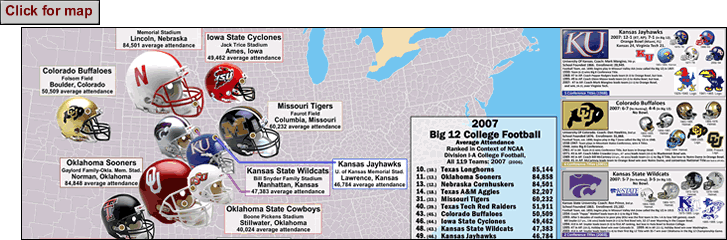
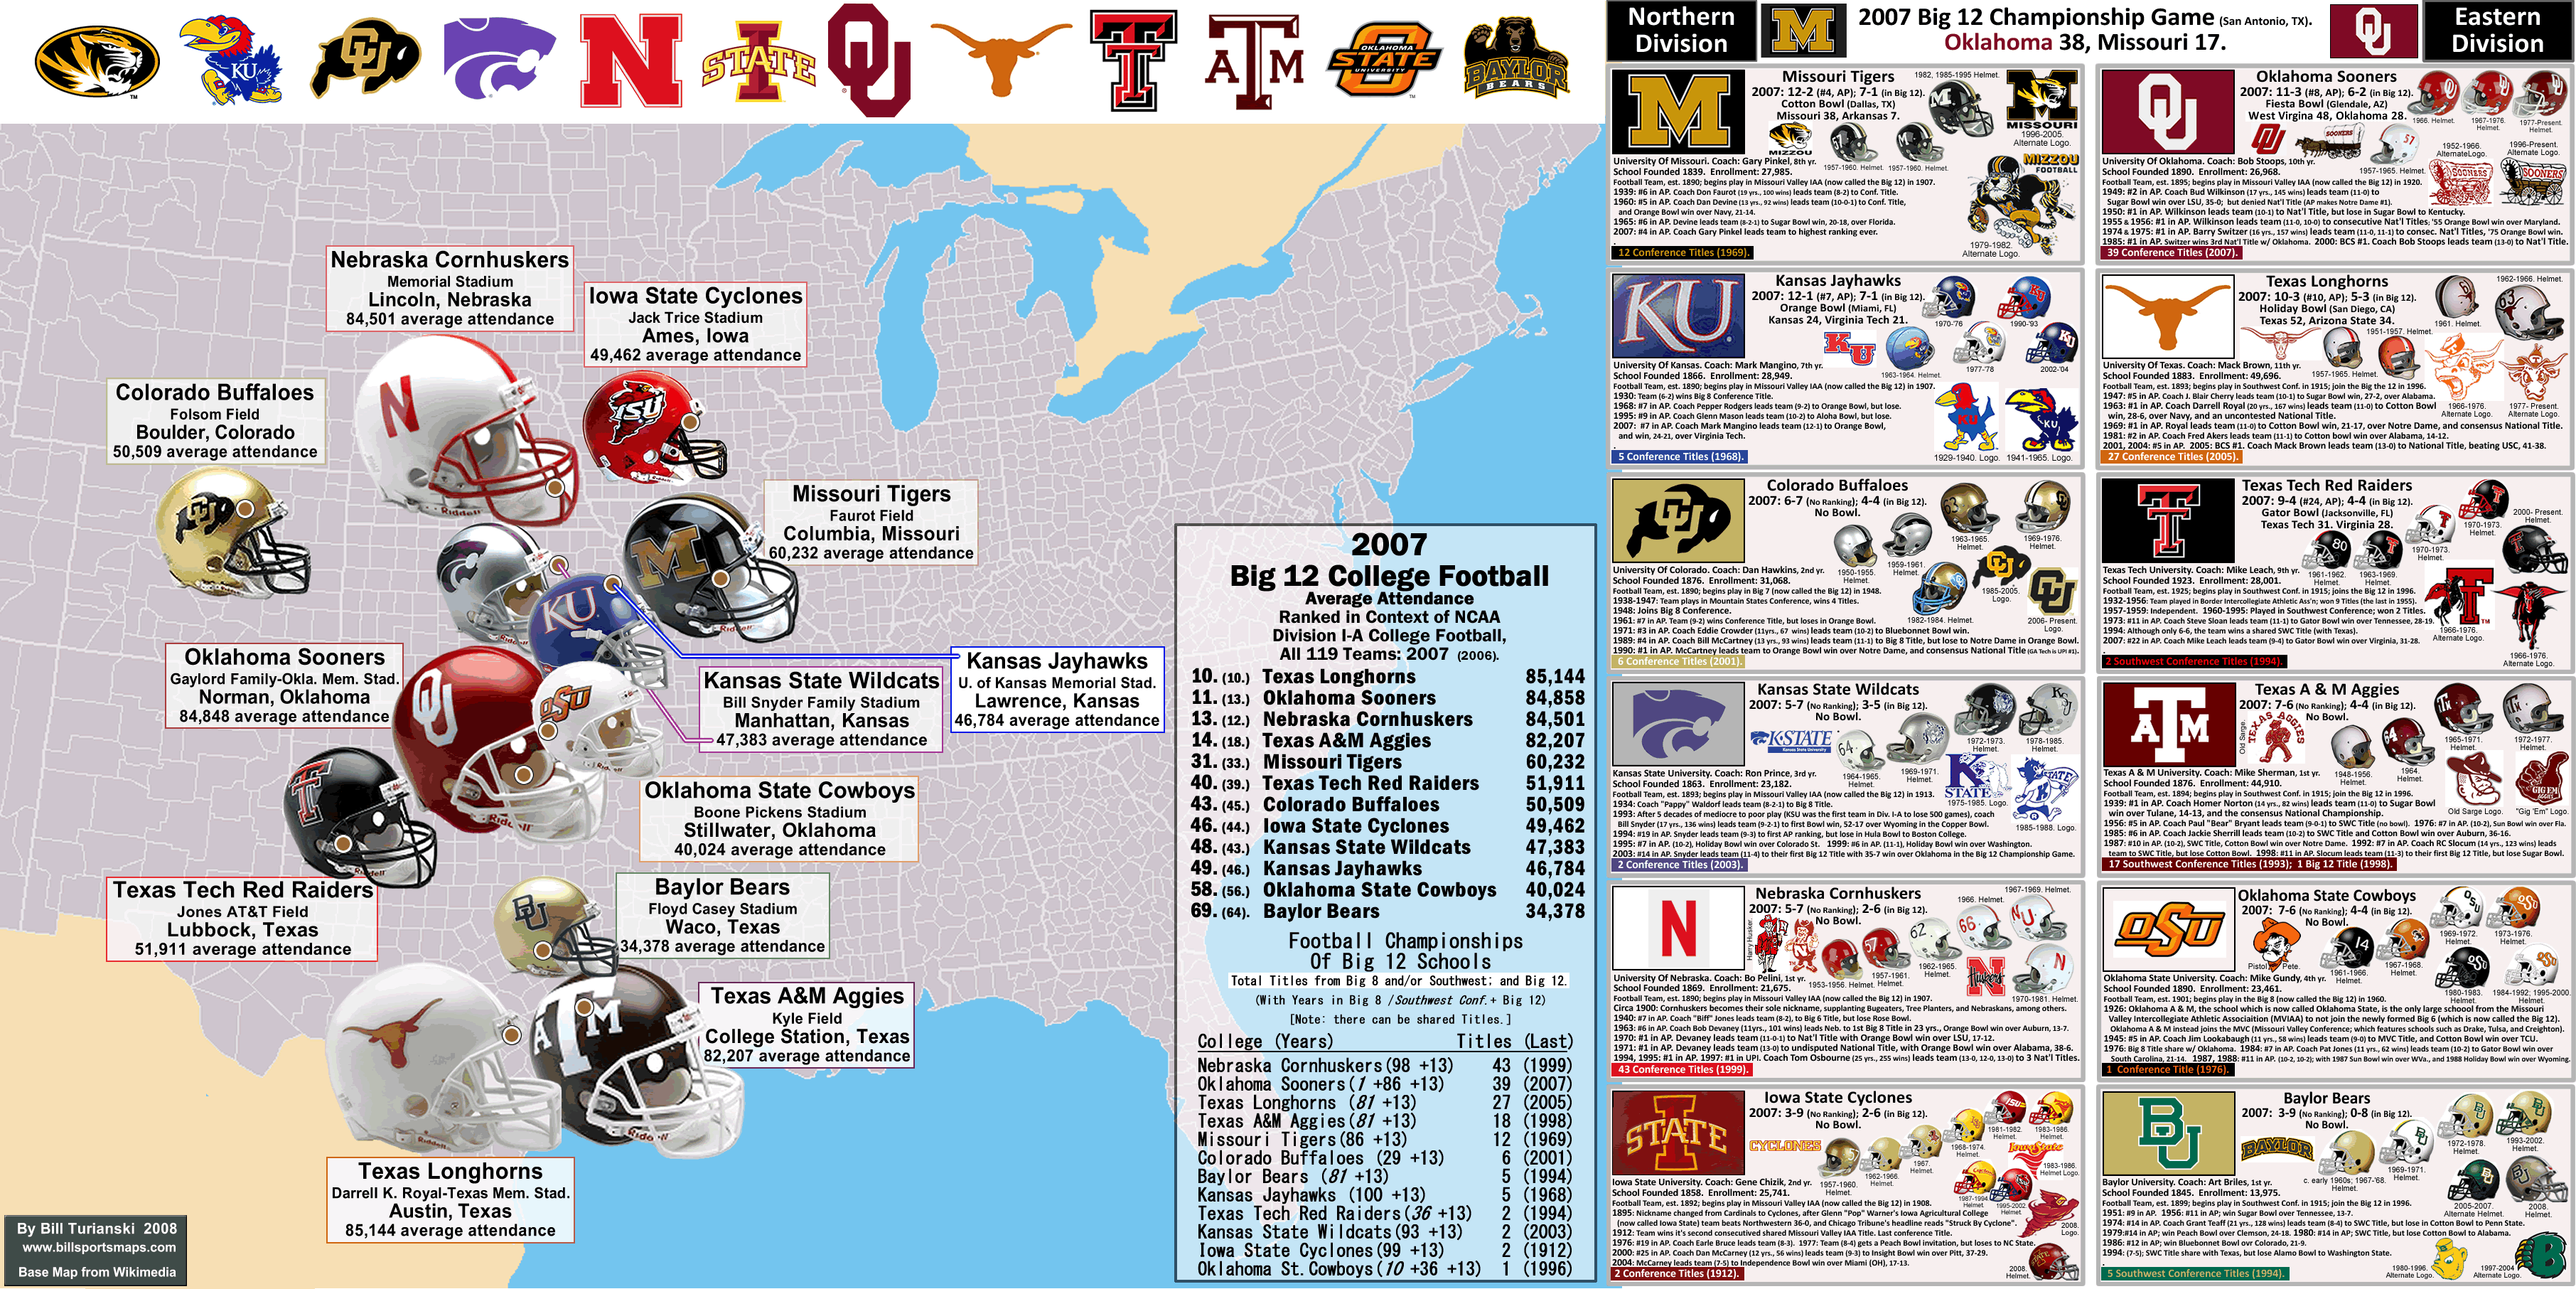
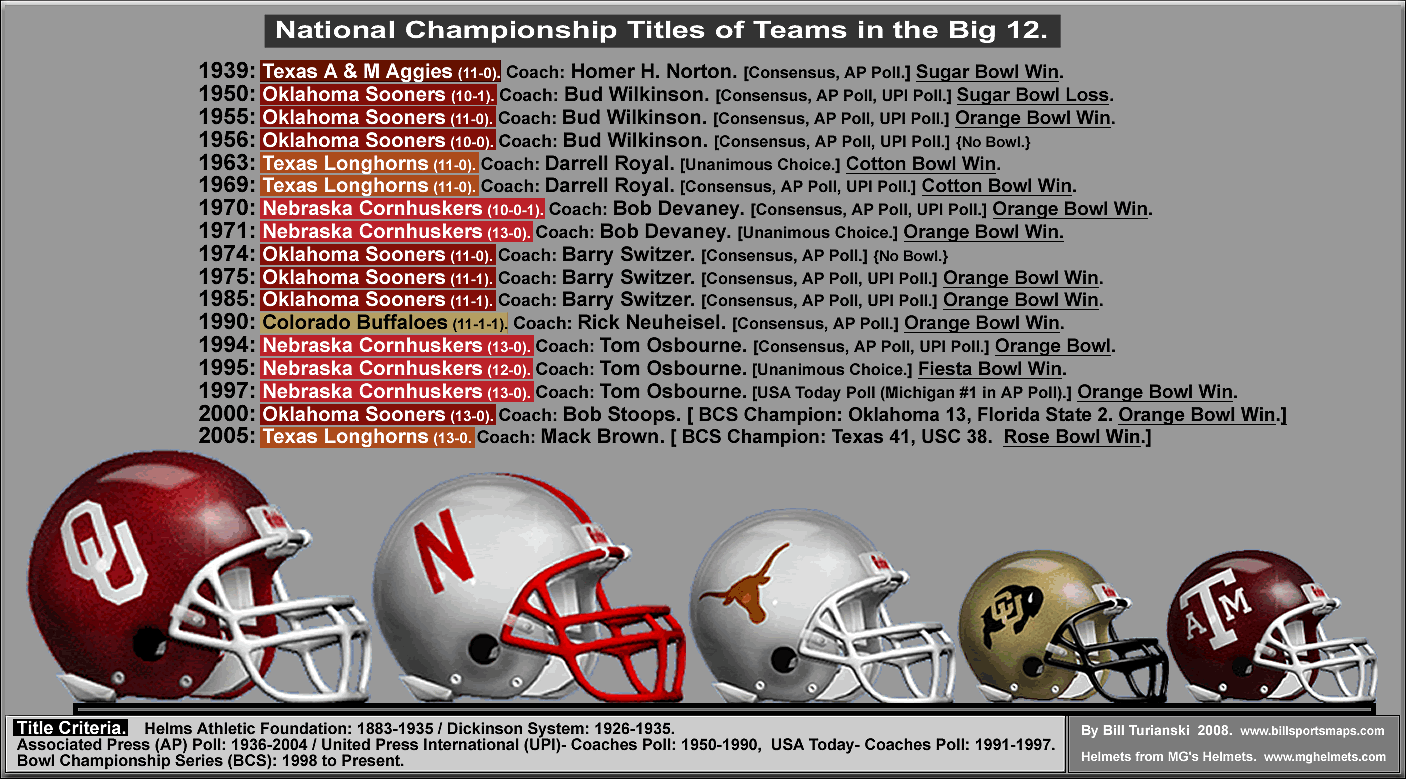
The conference remained the same throughout the sixties,  seventies, eighties,  and early 1990s.   During this time 2 of the schools in the Big 8 emerged as national powerhouses…the Oklahoma Sooners and the Nebraska Cornhuskers.   Both of these teams currently draw over 80,000 per game.   Oklahoma has won 7 National Titles (the last in 2000),  Nebraska has won 5 National Titles (the last in 1997).

Since the merger with the four Texas teams from the SWC,  the conference has seen their national exposure only grow,  as the football  programs of the Texas Longhorns and the Texas A & M Aggies similarly draw over 80,ooo per game.   Texas has won 3 National Titles (the last in 2005);  Texas A & M won their only National Title in 1939.   The only other team in the Big 12 that has won a National Title is Colorado,  in 1990.   The Buffaloes draw around 50,000 per game.

In recent years,  the Big 12 has seen the emergence of the football programs of Kansas State,  Kansas,  Missouri,  and Texas Tech.   For around 40 years,  Kansas State was one of the worst Division I-A teams in the country…it was 69 years between conference titles for the Wildcats (1934, 2003).   The Kansas Jayhawks were a mediocre-to-poor football team for around 35 years,  but last year achieved a #7 AP ranking and an Orange Bowl victory.   The Missouri Tigers,  while not as historically bad as the two Kansas teams,  still had not done much to brag about since 1965 (#4),  but in the last few years have emerged as a real threat.    Last year the Tigers made it to the Big 12 Championship Game (which they lost to Oklahoma),  and won the Cotton Bowl.   At 12-2,  Missouri was ranked #4 in the AP Poll in 2007.

Finally,  there is Texas Tech  {team profile,  from CBS Sports site,  Click here;  Wikipedia page here}.  The Red Raiders are from Lubbock (metro population of around 261,000),  {Visit Lubbock site here}.,  in a region referred to as the South Plains (comprising the Texas panhandle {see this},  plus the area to the immediate south).  

For 25 years (1932-’56),  Texas Tech played in the obscurity of the old Border Intercollegiate Athletic Association (which was composed of football teams from schools in Arizona,  New Mexico,  and west Texas).   In 1960,  Texas Tech joined the SWC.   They have won 9 BIAA Titles (the last in 1955),  and 2 SWC Titles (the last in 1994,  when they were only 6-6,  but managed a share of the conference title,  with Texas).

Though Texas Tech has not won a Big 12 Conference Title,  they are the only team to have maintained a winning record in every season of the Big 12.    

Mike Leach inherited the Texas Tech football program from Spike Dykes (13 years, 82 wins) after the 1999 season.  The team has gone to a Bowl game every year during the innovative Leach’s tenure,  and have won at least 8 games for 7 straight years.   Raised in Cody,  Wyoming,  Leach grew up a fan of the relatively near-by Brigham Young University football team,  whose high-flying offense (which won BYU a National Title in 1984)  can be now seen as a harbinger of the current college game.   Leach graduated from BYU,  then earned a Law Degree at Princeton.   

Mike Leach did not play football at the college level (unusual for Division I coaches,  although another of the six coaches in this category is also in the Big 12:  Mark Mangino of Kansas).   Leach’s trademark is the prolific,  passing-oriented offense,  which is known as the spread offense,  for the way it spreads the defense out,  revealing weaknesses exploited by the multiple wide reciever/ wing-back formations.    Leach was offensive coordinator at Valdosta,  Kentucky,  and Oklahoma.   He came to Texas Tech in the same role,  and became head coach in 2000.

This season,  the mighty Texas Tech offense continues to roll (they average 47.9 points per game).   Their next test is Saturday,  when they travel across the state-line to play #5 Oklahoma.    #2 Texas Tech has a real shot at the championship.   If they can beat the Sooners,  Tech finishes the regular season against perennial pushovers Baylor.   If they win that too,  Texas Tech will be in the BCS Championship Game,  opponent,  of course,  TBD.

Thanks to nationalchamps.net/ All-Time Database  {Click here}.   Thanks to the College Football Data Warehouse  {Click here}.   Thanks to the contributors to the pages of the Big 12,  Big 8,  the SWC,  and the BIAA,  on Wikipedia.   Thanks to the writers at Sports Illustrated August 11, 2008 print edition, including Austin Murphy  {si.com,  Click here}.  

Thanks to Chris Creamer’s Sports Logos Page  {Click here}.   Thanks to Logo Shak  {Click here}.   Thanks to Logo Server  {Click here}.  

Thanks to Helmet Hut  {Click here}.

Thanks to the Helmet Project  {Click here}. 

Thanks to MG’s Helmets  {Click here}.

Thanks to Sports Logos and Screen Savers  {Click here}.   Thanks to FootballFanatics.com  {Click here}. 

AP Poll,  and BCS Standings  {Click here}.

November 18, 2008

Origins of the Big 12 Football Conference.

Filed under: NCAA Gridiron Football,NCAA/fb-Big 12 — admin @ 5:29 pm

Origins of the Big 12 mapClick on title: origins-of-the-big12_c.gif.

Thanks to MG’s Helmets  {Click here}.   Thanks to College Football Data Warehouse  {Click here}.   Thanks to Army Corps of Engineers site  {Click here}.

November 16, 2008

England: FA Cup 2008-’09, Second Round Proper. The 39 Clubs who have qualified.

Filed under: 2008-09 FA Cup — admin @ 11:24 am

2008-09_fa-cup_2nd-round_games-for-29th-november_updated-18-nov_post_b.gif


[ Note: Map is updated to all games played on 18th November.  Text below is not updated.   All re-plays have been played,  except for Grays Athletic v. Carlisle United.  All clubs that won re-plays have been added to the map.  Sorry if there are any errors...I just wanted to get the updated map out there before I shut down for today.] 

FA Cup First Round replays are scheduled for Monday and Tuesday.  There was one match on Monday…Northampton Town 2-5 Leeds United.  There are 14 replay matches scheduled for Tuesday…{Click here}.

On the chart to the right of the map,  clubs which have secured passage to the Second Round are listed in large type.  These 26 clubs have thieir crests shown on the map,  along with a thumbnail description of the club,  which includes the club’s name,  it’s location,  it’s league and level,  and it’s average attendance as of 10th November, 2008.  

Clubs which must play replays on 18th November are listed in small type.  When the replays are all done,  I will add the winners’ crests and thumbnail information to the map, and make another post before the Second Round Proper (which is scheduled for 29th November) .

The current  attendance figures of clubs which have advanced to the Second Round so far range from the 19,747 per game that League One’s Leicester City draw,  all the way down to the 240 per game that Curzon Ashton are drawing.

Of the 26 clubs who have qualified,  there are 18 clubs from the League,  and 8 non-League clubs.

Curzon Ashton FC,  from Ashton-under-Lyme,  Greater Manchester,  plays in the Unibond First Division North.   This league is in the 8th Level in the English Football pyramid.  Here is the official site of the Unibond leagues:   http://www.unibondleague.com/.

There is one club from the 7th Level who has qualified:   Eastwood Town FC,  of Nottinghamshire.  [ Note: the image on ETFC's crest is of Badgers,  which is their nickname. ]   The club plays in the Unibond Premier Division.  Here are the tables for the Unibond Leagues (7th and 8th Levels) : http://www.unibondleague.com/tables.php

Two clubs from the 6th Level have qualified:  Alfreton FC,  of Derbyshire,  and Blyth Spartans AFC,  from Northumberland.   Both are in the Conference, North…currently billed as the Blue Square North.  

There are 4 clubs from the 5th Level,  which has been traditionally known as The Conference (official name is now the Blue Square Premier  League) :   Kidderminster Harriers FC are from around 15 miles south-west of Birmingham,  in Worcester .   Torquay United FC hail from the Torbay area of Devon.   Histon FC are from a small suburb of Cambridge.   Forest Green Rovers FC are from the Cotswold Hills {see this},  in the small town of Nailsworth,  which is near Stroud, Gloucestershire.   Here is the 5th and 6th Levels’ official site:  http://www.footballconference.co.uk/.

17 clubs have qualified from the League.   [The league,  of course,  being the top 4 Levels,  the top two of which don't enter the FA Cup until the Third Round.] 

There are 10 clubs from the 4th Level,  League Two.    They are (in descending order of current average attendance) :  Bradford City FC Port Vale FC,  Gillingham FC,  Notts County FC,  Wycombe Wanderers FC,  AFC Bournemouth,  Brentford FC,  Chesterfield FCMorecambe FC,  and Macclesfield Town FC.

The 8 clubs from the 3rd Level,  League One,  are (in descending order of current average attendance) :  Leeds United FCLeicester City FC,  Millwall FCPeterborough United FC,  Tranmere Rovers FC,  Scunthorpe United FC,  Leyton Orient FC,  and Crewe Alexandra FC.

There are six clubs who are still alive who are from Greater Manchester.  There are five clubs from Greater London who are still alive.  There are three clubs are from the south Derbyshire/ south Nottinghamshire region of the East Midlands who have qualified for the Second Round:   Alfreton Town,  Eastwood Town,  and Notts County.  These three clubs are located rather close together,  within a circle with a radius of about 10 miles. 

Thanks to Tony’s English Football Site for attendance figures   [Note: the link is set to go to the League One attendance figures. ] {Click here}.

FA site: http://www.thefa.com/TheFACup/TheFACup/.

November 13, 2008

NCAA Division I-A / Football Bowl Subdivision, the Pac-10: Attendance map (2007 figures) and Team Profiles.

Filed under: NCAA Gridiron Football,NCAA/fb-Pac 10 & Pac-12 — admin @ 6:11 am

ncaa_football_pac-10_team-profiles_2007attendance-map_post.gif


The Pac-10 was formed in 1959.   Its roots are in the Pacific Coast Conference,  which began play for football in 1916,  and existed to 1959.   Founding schools in the PCC were California (of Berkeley, CA),  Washington (of Seattle, WA),  Oregon (of Salem, OR),  and Oregon State (of Corvallis, OR).   The following year, 1917,  Washington State (of Pullman, WA) joined.   Stanford (of Palo Alto, CA) joined the next year,  1918.  

In 1922,  the conference expanded to 8 teams with the addition of Southern California [ie, USC] (of Los Angeles, CA),  and Idaho (of Moscow, ID).    Montana (of Missoula, MT) joined in 1924.   The PCC swelled to 10 teams when UCLA (of Los Angeles, CA) joined in 1928.   Montana left the PCC in 1950, to join the Mountain States Conference. 

The dominant schools in PCC football were the four California schools.   UCLA won 12 Conference Titles,  both USC and California won 11 Titles,  and Stanford won 8 Titles.    The 6 other schools won a total of 14 Titles,  the highest being Oregon with 5.   The two Rocky Mountain schools,  Idaho and Montana,  never won a football title. 

The divide between the California schools and the other 6 schools was also evident in another way.  Many university leaders in the California schools considered the Northwest schools academically inferior,  and advocated a split to form a separate California conference,  for schools that held a higher standard of the student athlete.

So it is ironic that the split-up of the Pacific Coast Conference came about after a scandal involving illegal payments  to players on the UCLA and USC teams.   UCLA officials and coaches eventually admitted to widespread payments to players,  and in turn blew the whistle on phony USC programs that paid players.   3 of the 4 California schools  (but not Stanford),   as well as Washington,  were eventually implicated in the pay-for-play scandal,  and the PCC disbanded in 1959.

In July, 1959,  the Athletic Association of Western Universities was formed,  comprising  CaliforniaStanfordUCLAUSC,  and Washington.   This in spite of the fact that many at Stanford had wanted UCLA to be expelled for their part in the pay-for-play/ slush fund scandal.   For its first few years, 1960-’62,  the AAWU was popularly known as the Big Five.   The Northwest schools were initially blocked from joining,  but Washington State was able to join in 1962,  and it became known as the Big Six.

Oregon and Oregon State were finally able to join in 1964.  Idaho was never invited,  and stayed independent until joining the Big Sky Conference in 1963.

In 1968, the AAWU changed its name to the Pacific 8 Conference,  aka the Pac-8.

In 1978,  the conference added two schools from the Western Athletic conference:  Arizona State (Tempe, AZ),  and Arizona (Tuscon, AZ),  and changed its name to the Pacific-10 Conference,  aka the Pac-10.

Thanks to the contibutors to the Wikipedia pages on the PCC  {Click here} and the Pac-10  {Click here}.   Thanks to the College Football Data Warehouse  site  {Click here}.   Thanks to the College Football All-Time Database (http://www.nationalchamps.net/NCAA/database/index.htm).   Thanks to the College Football History site…I have set he link to the Oregon Ducks page,  which talks about the origins of their mascot and how Oregon officials were able to secure rights for use of the Donald Duck character (but only on merchandise sold in-state)  {Click here}.

Thanks to Helmet Hut  {Click here}.   Thanks to Chris Creamer’s Sports Logos Page  {Click here}.   Thanks to the Helmet Project site  {Click here}.

Thanks to MG’s Helmets.  This is a site I have just come across,  which has beautiful computer aided illustrsations of football helmets in most every league and conference.   I also like it because the site has a very comprehensive set of old NFL helmets (but alas,  no old college helmets…for that you have to go to the Helmet Project site).   MG’s Helmets is the best site out there for throwback NFL helmets.   {Click here,  for MG’s Helmets.}

November 11, 2008

2008-’09 Turkiye Kupasi (Turkish Cup), 3rd Round: Zoom Map of all 20 clubs in the 4 Groups.

Filed under: Turkey,Zoom Maps — admin @ 10:03 am

turkiye-kupasi_2008-09_3rd-round_post.gif


A slate of matches in the Turkish Cup’s 3rd Round are to be played on the 11th through the 13th of November.  The 3rd Round is unusual for a European national Cup competition in that it is in a league format.  The 20 clubs still in the competition have been split up into 4 groups.  The top four 07/08 Super Lig finishers are seeded, and placed in seperate groups.  Those clubs are:  Galatasary (reigning champions),  2nd place finishers Fenerbahce,  3rd place finishers Besiktas,  and 4th place finishers Sivasspor

Teams play all four other teams in their group,  with the top two advancing to the 4th Round,  which is a standard knockout competition.

In this season’s 3rd Round,  there are 6 clubs from the lower leagues,  including 2 clubs that are in the 3rd Level (which is called the TFF Second League):  Tokatspor and Alanyaspor.  

Four clubs are from the the 2nd Level,  which is known as the TFF First League,  but is officially called the Bank Asya 1. Lig.    Altay SK of Izmir,  has won the Cup twice,  the last time in 1980. 

Here is Wikipedia’s page on the Turkiye Kupasi,  which includes a list of all the clubs that have won the Turkish Cup  {Click here}.

Cup holders are the central Anatolian club Kayserispor.  One interesting sub-plot in the Turkish Cup is the perennial failure of giants Fenerbahce to win the Cup,  for 25 years running.  In 2005,  Fenerbahce was demolished by Galataaray 5-1.  Fenerbahce then lost the next year to Besiktas,  3-2 in AET.   A Galatasaray supporter sent me this image of his fellow fans mocking Fenerbahce’s cup history,  the inference being that they haven’t won the Cup since the Stone Age  {see this}.

Thanks to the pclion fc site  {Click here},  for information and images.

Thanks to the Soccerway site for fixtures and results  {Click here}.

Older Posts »

Powered by WordPress