billsportsmaps.com

December 7, 2014

Netherlands: 2014 football attendance map, all Dutch clubs (32 clubs) drawing over 2 K per game [from 2013-14 home league matches].

Filed under: European Leagues- -attendance maps,Netherlands — admin @ 10:37 pm

eredivisie_2014-attendance-map_all-clubs-drawing-above-2k_post_f_.gif
Netherlands: 2014 football attendance map, all Dutch clubs [32 clubs] drawing over 2 K per game


This continues my category of European leagues – attendance maps. Last season [2013-14], Netherlands had the 6th-highest average attendance for its first division in Europe (see chart below). The top five in Europe for 2013-14 I have done previously {here: Germany, England, Spain, Italy, France).

Below – Chart: the 20 highest drawing association football leagues in Europe

2013-14_europe_best-drawing_domestic-leagues_ger_eng_spa_ita_fra_etc_top20_.gif

Source of data, http://www.european-football-statistics.co.uk/attn.htm.


Elements of the map page
The cut-off for clubs on this map is 2,000 per game average attendance, unlike the first five I did in this style, which had a cut-off of 4,000 avg. attendance. The reason I did it this way for Netherlands is basically because I could (could fit them all in the map, that is). There are 32 clubs on the map (all 18 Eredivisie clubs from last season; 13 of the 20 clubs from the Dutch 2nd division; and 1 of the 32 semi-pro teams in the Dutch 3rd division). Had I done the map in the 4-K-cut-off-style, there would have been 23 clubs (23 clubs in Netherlands drawing over for 4 K per game in 2013-14). That is not too shabby. Netherlands only has around 16.8 million inhabitants, yet it still is able to maintain a leagues system that has at its apex a league (the Eredivisie) which draws 19.5 K per game, which is only slightly lower than a nearby country with more than three-times the population – France. France, which has a population of around 66.6 million, has a top flight, Ligue Un, which averaged 20.6 K per game in 2013-14 (or only 1,125-more-per-game than the Netherlands’ top flight). In fact two seasons ago [2012-13], the Eredivisie was outdrawing Ligue Un (19,619 vs. 19,211).

Listed for each club, at the chart at the far-right-hand side of the map page, are: average attendances (from home league matches in 2013-14), stadium capacities, percent-capacities, Eredivisie titles, seasons spent in the Eredivisie by team, and KNVB Beker (Dutch Cup) titles.

On the map are shown are the 12 provinces of European Netherlands; they are listed in the Dutch. With only about 50% of its land exceeding one meter above sea level, the Dutch people have spent the last four centuries (successfully) keeping the Sea at bay. And so, because the Dutch are second-to-none at land-and-water management, I decided to include waterways on the map – so prominent bodies of water including rivers and canals (kanals) are shown and listed. I listed them also in the Dutch.

[{Here is a map of the Rhine River, Map of the Rhine basin (by WWasser at en.wikipeia.org).} In case you might be confused (and man, was I confused), the Rhine (Rijn, in the Dutch) flows from its source in the southeastern Swiss Alps near the Austria/Liechtenstein border, north to Lake Constance (depending on the lake's water level, the flow of the Rhine's water is clearly visible along the entire length of Lake Constance, which is a large Alpine lake which sits on the eastern part of the Swiss/German border including a portion that is in far-west Austria), and then as it emerges from the western edge of the lake, the Rhine continues to form the Swiss/German border all the way to the Swiss city of Basel, then at Basel the Rhine swings northerly and forms part of the French/German border, flowing past Strasbourg, then near the southwestern German city of Karlsruhe it continues to flow north but ceases to be part of the Franco/German border as it flows into southwest and west-central Germany (aka the Rhineland) as the Lower Rhine, then it swings west into the Netherlands...where, just west of Arnhem it is diverted into three distributaries: the Waal River, the Nederrijn ("Nether Rhine") and the IJssel; then the Nederrijn's name changes to the Lek as some of the Rhine's volume passes through Europe's largest shipping port at Rotterdam, then via the Nieuwe Waterweg ("New Waterway"), into the North Sea. But the Rhine's course through the Netherlands is way more complicated than that...
{excerpt from Rhine/Delta at en.wikipedia.org}..."From here, the situation becomes more complicated, as the Dutch name Rijn no longer coincides with the main flow of water. Two thirds of the water flow volume of the Rhine flows farther west, through the Waal and then, via the Merwede and Nieuwe Merwede (De Biesbosch), merging with the Meuse, through the Hollands Diep and Haringvliet estuaries, into the North Sea. The Beneden Merwede branches off, near Hardinxveld-Giessendam and continues as the Noord, to join the Lek, near the village of Kinderdijk, to form the Nieuwe Maas; then flows past Rotterdam and continues via Het Scheur and the Nieuwe Waterweg, to the North Sea. The Oude Maas branches off, near Dordrecht, farther down rejoining the Nieuwe Maas to form Het Scheur. The other third of the water flows through the Pannerdens Kanaal and redistributes in the IJssel and Nederrijn."... {end of excerpt}.]
___

Thanks to Lencer at en.wikipedia.org, for the blank map of Netherlands, File:Netherlands location map.svg.

Thanks to Alphathon at commons.wikipedia.org, for provinces/waterways map of Netherlands, File:Map provinces Netherlands-nl.svg.

Thanks to worldcanals.com/english/netherlands.html.

Thanks to European-football-statistics.co.uk, for Dutch attendance figures, http://www.european-football-statistics.co.uk/attn.htm.

Thanks to the contributors at ne. and en.wikipedia.org, at 2014–15 Eredivisie.

September 29, 2014

Italy: 2014 football attendance map, all Italian clubs [42 clubs] drawing over 4 K per game [from 2013-14 home league matches].

Filed under: European Leagues- -attendance maps,Italy — admin @ 7:23 pm

italy_2014_highest-drawing-clubs_all-italian-clubs-drawing-over-4k_42-clubs_post_h_.gif
Italy: 2014 football attendance map [all Italian clubs drawing over 4 K per game]


(Note: to see my latest map-and-post on Italian football, click on the following, category: Italy.)

This continues my new category of European football leagues attendance maps. This map for Italy shows all football clubs in the Italian football leagues system which drew over 4,000 per game in the 2013-14 season (from home domestic league matches). The larger the club-crest, the higher the club’s attendance. I have added an extra detail on the map of showing all the Regions of Italy [the Regions are the first level of political subdivision in Italy].

The chart at the right-hand side of the map page shows 2013-14 average attendance, stadium capacity, and percent capacity. Also shown at the far right of the chart are: each club’s Italian titles (with year of last title), seasons spent in the Italian first division (with last season in the first division noted, if applicable), and Italian Cup titles (with year of last title).

You might have noticed the large red-white-green shield and the large red-white-green circular device above the chart – those are the badges which the winner of the Italian league and Italian Cup wear the following season. Of course, the winners of the Italian national title, or Serie A title, are known as the winners of the Scudetto. Since Bologna (the title-winners in 1925) instituted the ritual for the following season (the 1925-26 season), the title-winner gets to show the Scudetto shield on their jersey the following season. Likewise, the winner of the Italian Cup [or, the Coppa Italia] is allowed to sport the Coccorda on their jersey the following season. I know Turkey does a similar thing on their league and cup winners’ jerseys, but very few other countries do this. Which is a pity, because the Scudetto shield and the Coccorda device look so cool on the reigning champions’ kit. It is a bit of a boast, but not too much of a boast. And the Scudetto and the Coccorda look great on the winners’ jersey, pretty much no matter what that title-winning club’s color scheme is. {Here is reigning Italian champions Juventus’ 2014-15 home jersey with Scudetto shield on it, juvestore.com/juventus-home-jersey-2014-15. Here is Coppa Italia reigning champions Napoli’s 2014-15 home jersey with Coccorda on it, macron.com/shop/napoli/2014-15/home.}
___
Thanks to Eric Gaba for the blank topographic/political map of Italy at ‘File:Italy map-blank.svg‘ (commons.wikimedia.org).

Thanks to European-football-statistics.co.uk, for Italian attendance figures, http://www.european-football-statistics.co.uk/attn.htm.

Thanks to the contributors at Serie A, at Serie B, and at Lega Pro [Italian 3rd division] (en.wikipedia.org).

August 22, 2014

Spain, 2013-14 attendance map & chart: all clubs in the top two divisions who drew over 4 K [36 clubs] / Plus, an illustrated article on SD Eibar – the smallest-ever club to play in La Liga [3.0 K per game in 2013-14].

Filed under: European Leagues- -attendance maps,Spain — admin @ 9:34 pm

spain_attendance-map_top-2-divisions_2013-14_all-drawing-above_4k_post_.gif
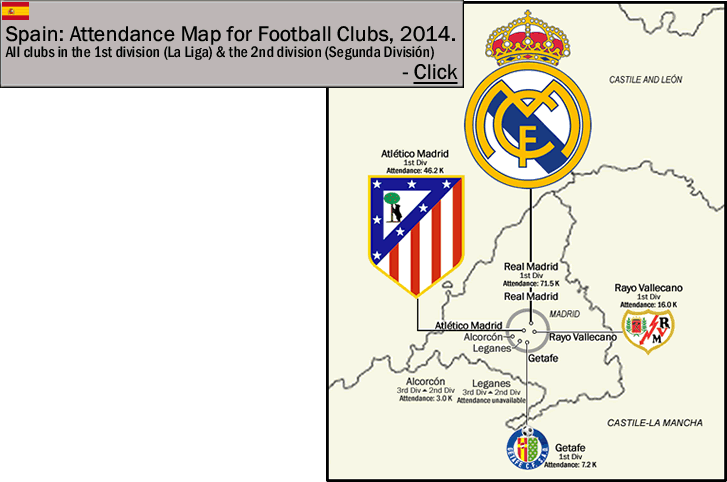
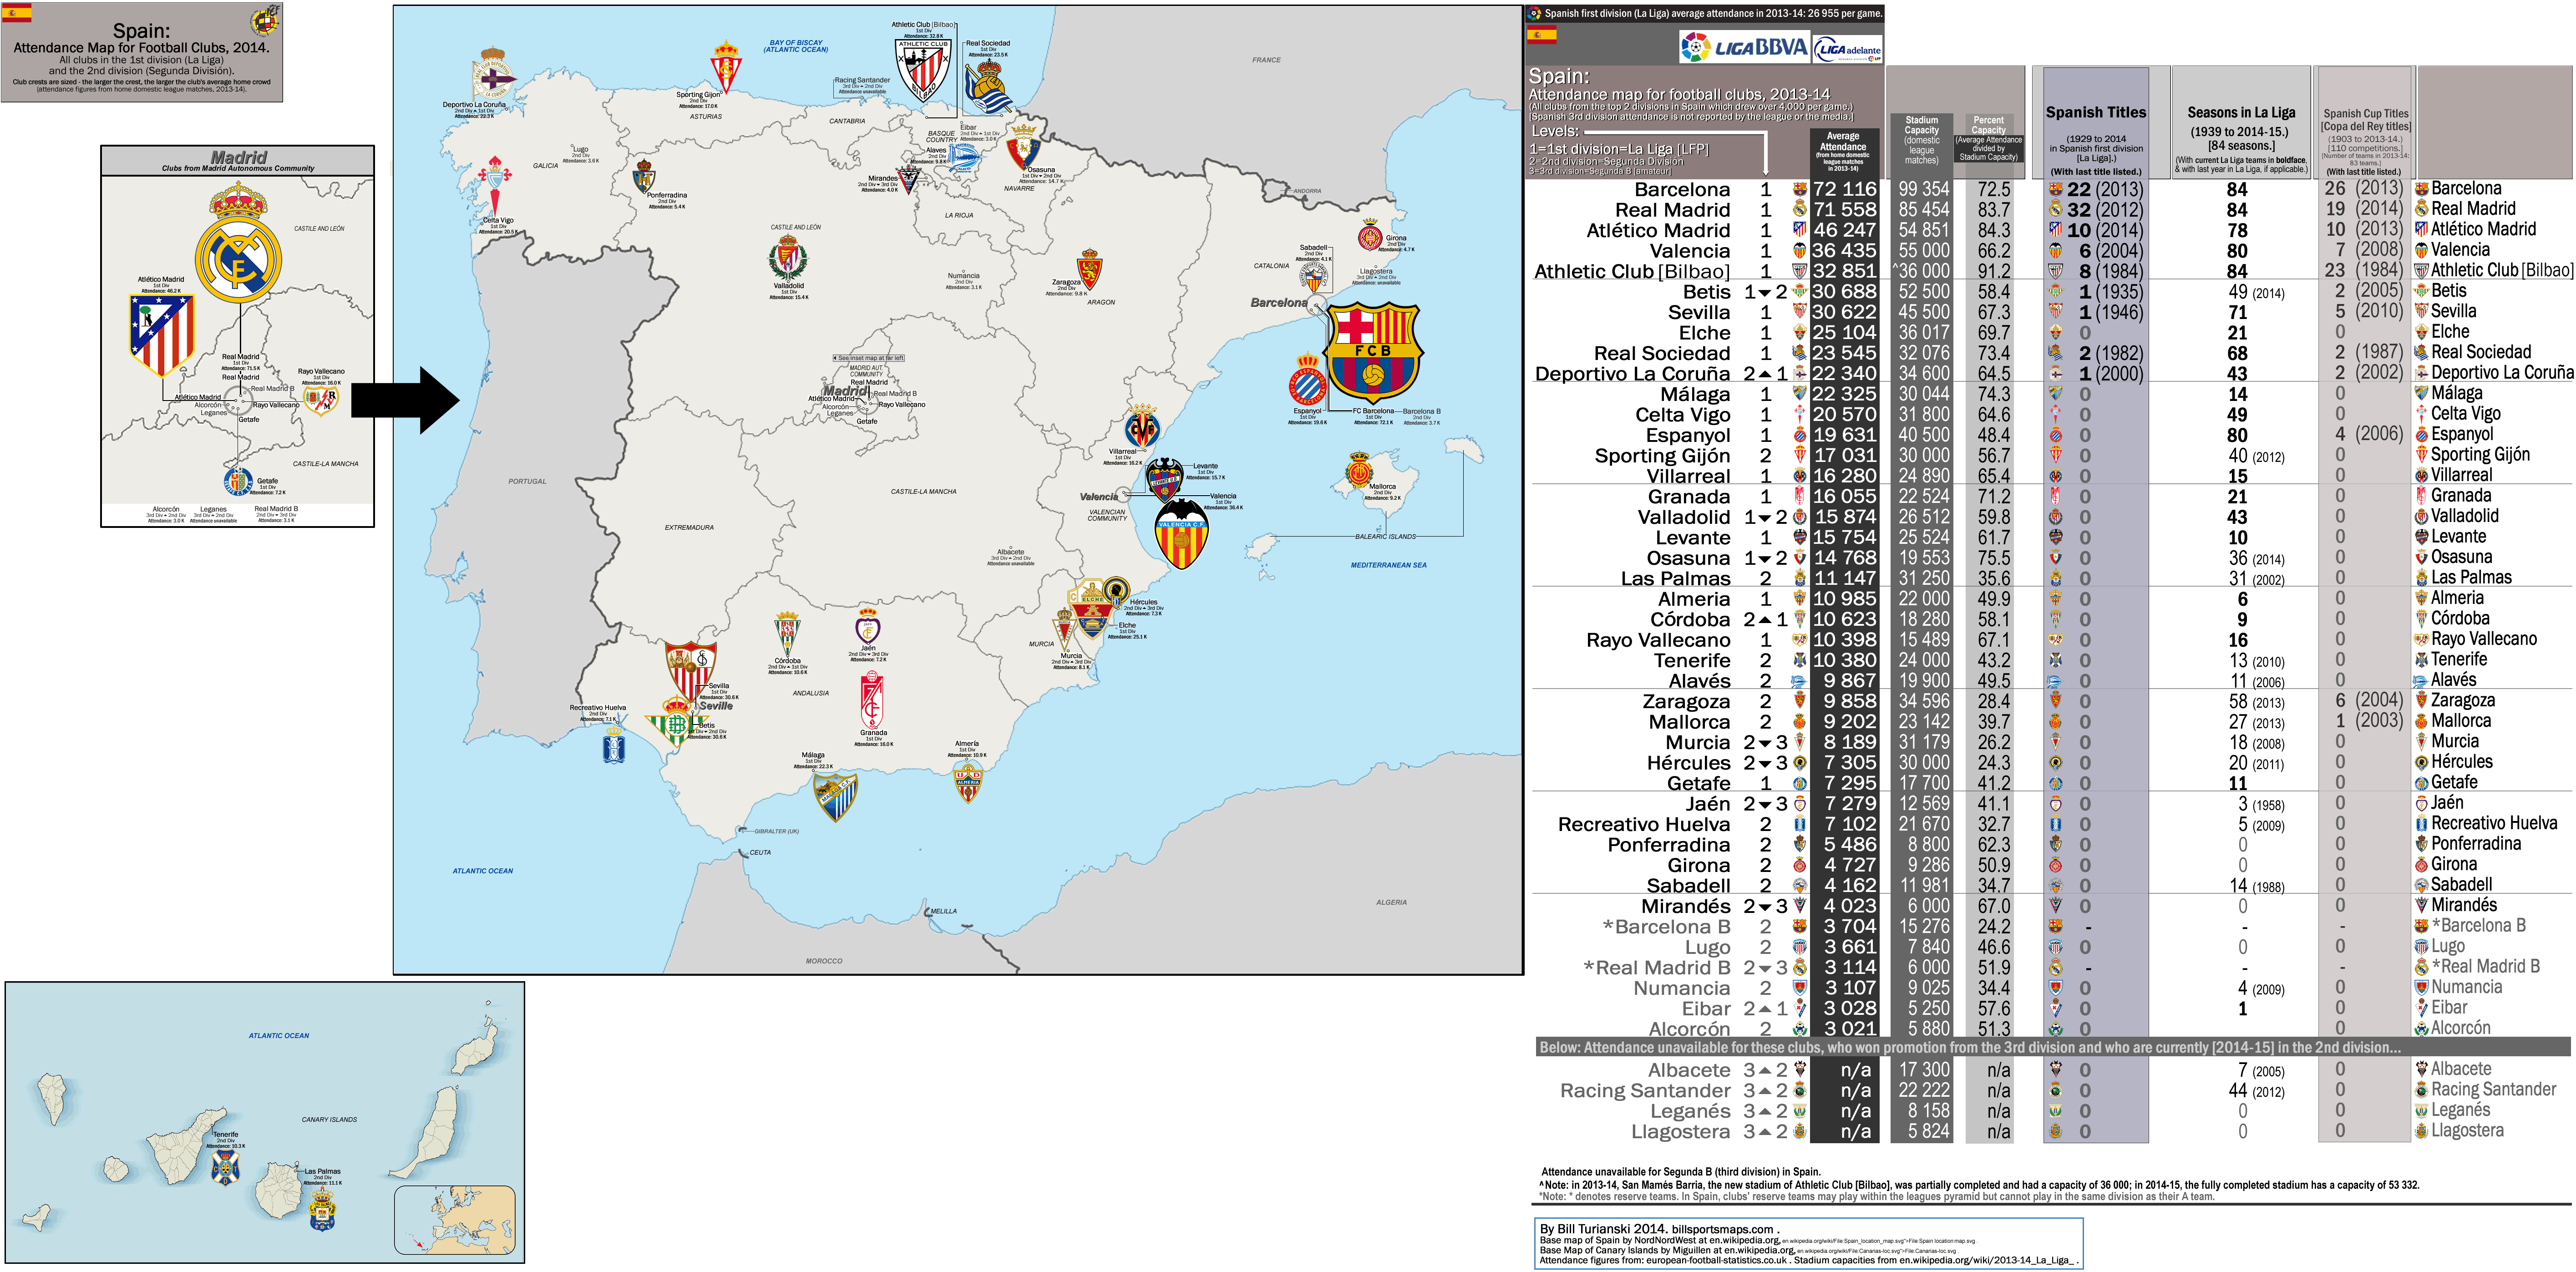
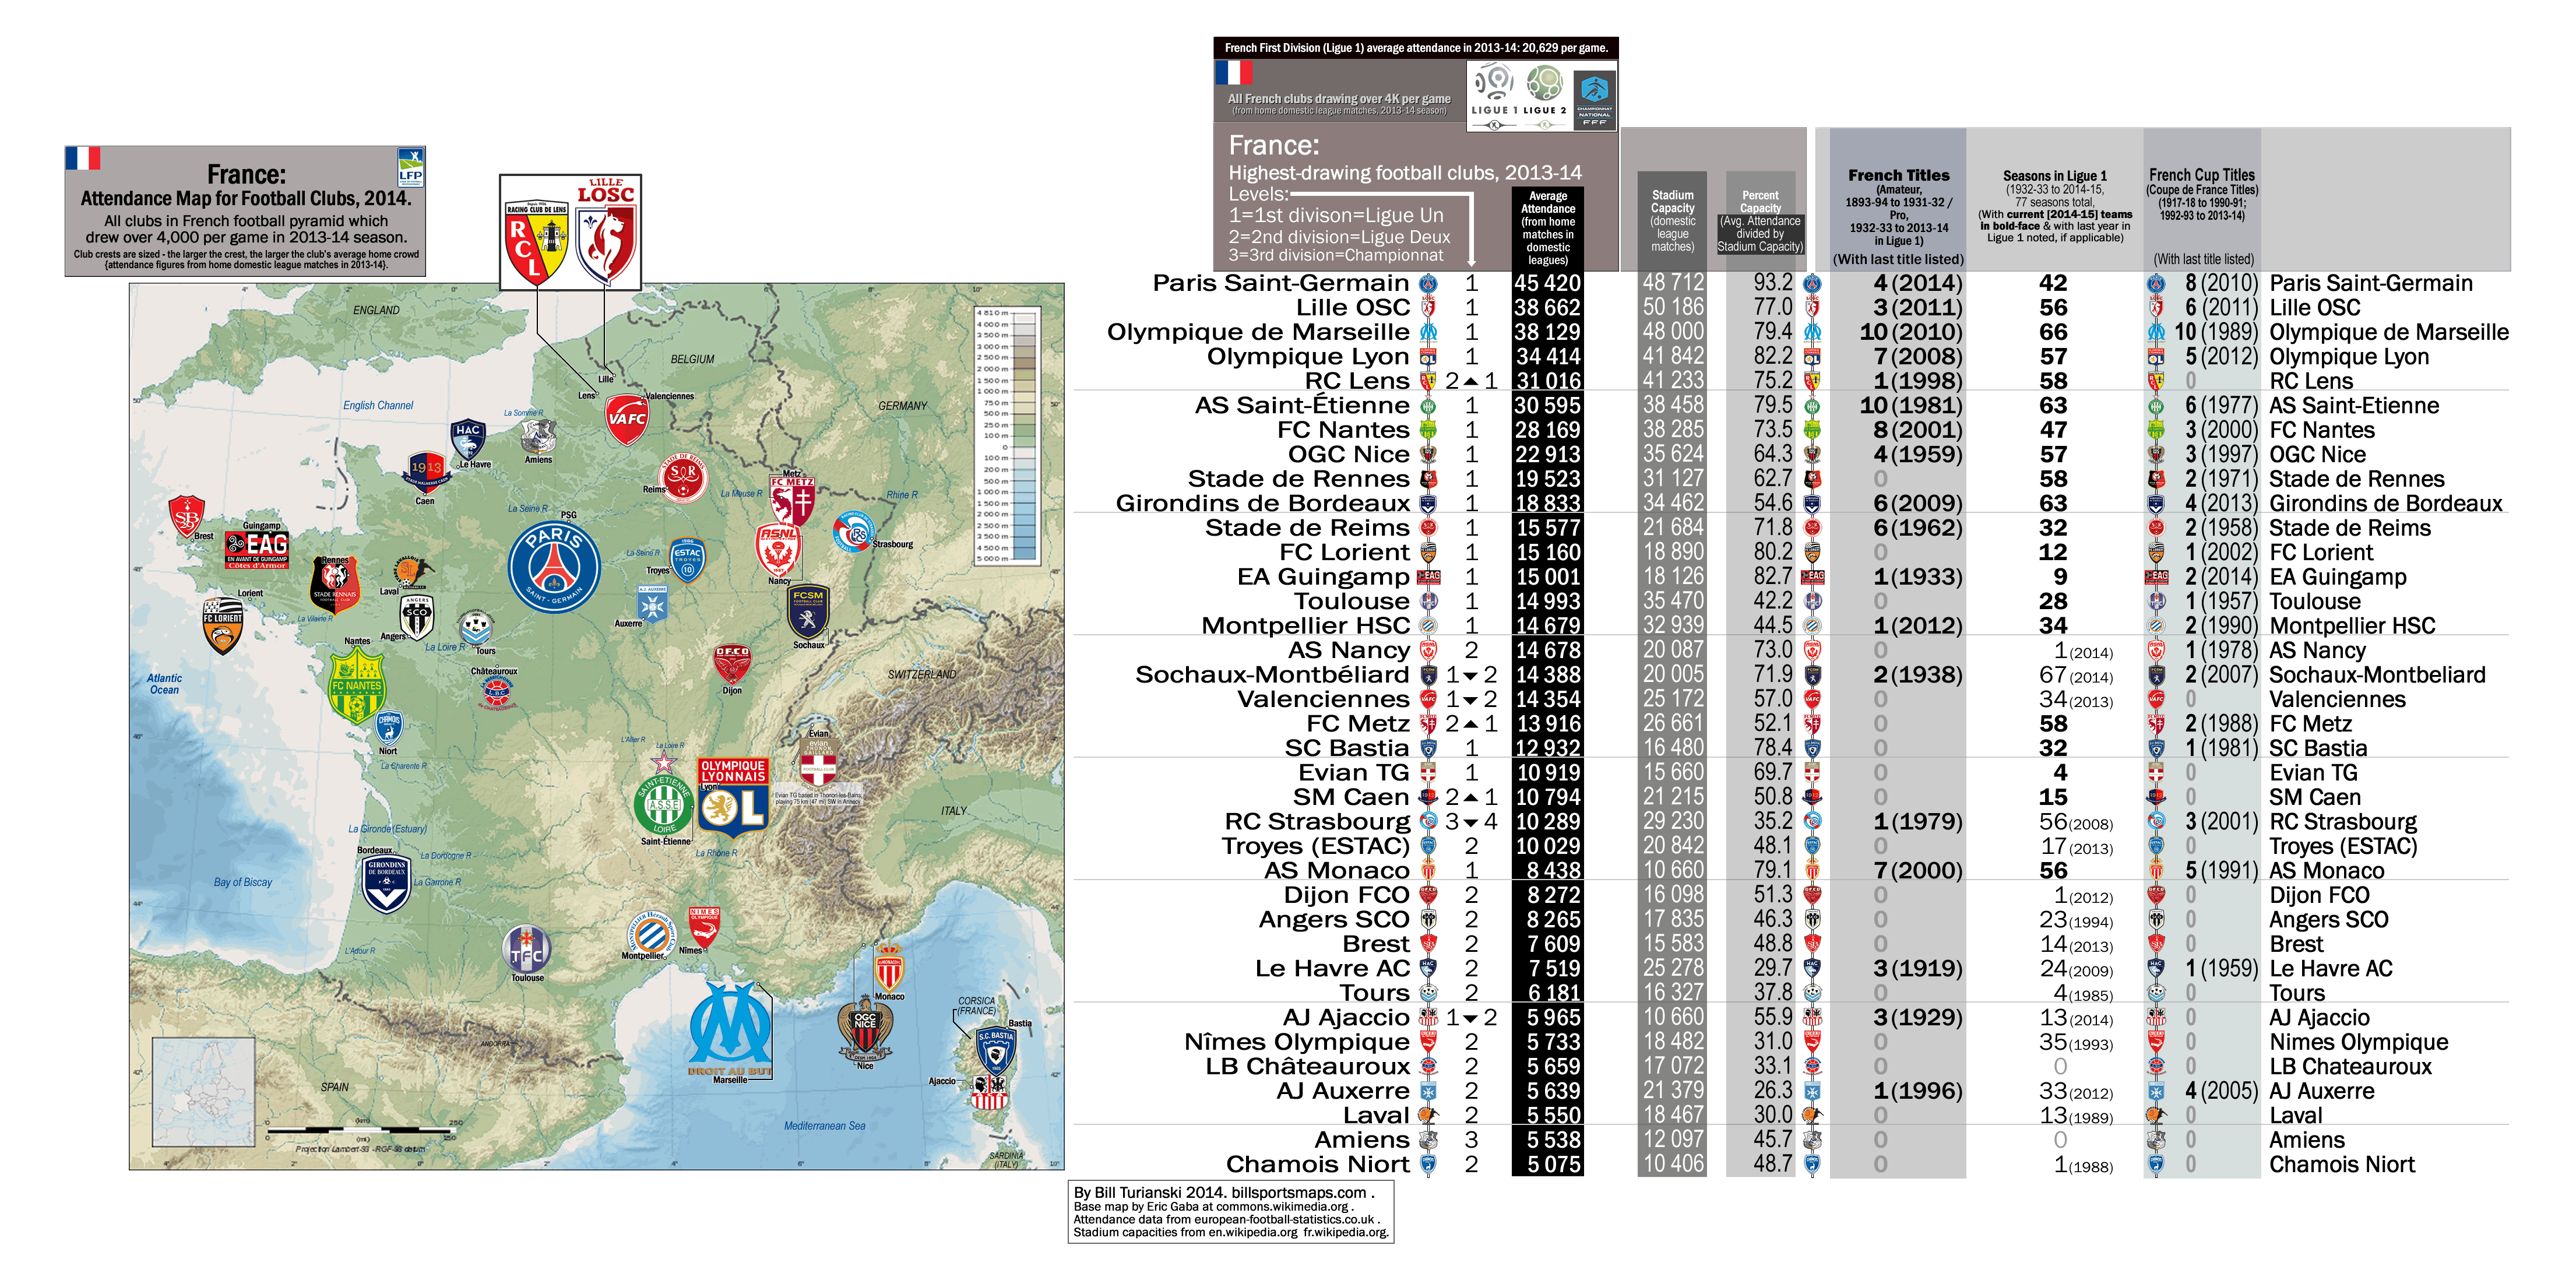
Spain: all clubs [36 clubs] that drew above 4 K per game in the 2013-14 La Liga and Segunda División seasons


Note: to see my latest post on Spanish football, click on the following, category: Spain.

[Please note: this map is different than the previous three 2013-14 attendance maps (of Germany, England, and France), all of which showed every club in those countries which drew over 4,000 per game. The problem here is that because reported 3rd division Spanish attendance figures do not exist, and because it is almost certain that clubs drawing above 4 K in the Spanish third division (Segunda B) do exist (such as for Racing Santander in 2013-14), I had to change the parameters of the map and chart for Spain. So the map shows all clubs that drew above 4 K per game in 2013-14 in Spain from the top two divisions (La Liga and Segunda División), plus...10 other clubs or teams in grey tone sans crests (but with locations shown). Those 10 extra included in grey-tone are... all the clubs that were in the Segunda División last season that didn't draw above 4 K per game (4 clubs as well as 2 teams - Barcelona's B team and Real Madrid's B team) plus the 4 four clubs that were promoted from the third division (Segunda B) to the second division (Albacete, Leganes, Llagostera and Racing Santander). One final point - one of these clubs just mentioned (and that drew below 4 K) is Eibar, who drew 3.0 K last year and won the Segunda División - thereby getting promoted to the Spanish first division for the first time {see below}.]

    SD Eibar – the smallest-ever club to play in La Liga

eibar_ipurua_xabi-alonso_i_.gif
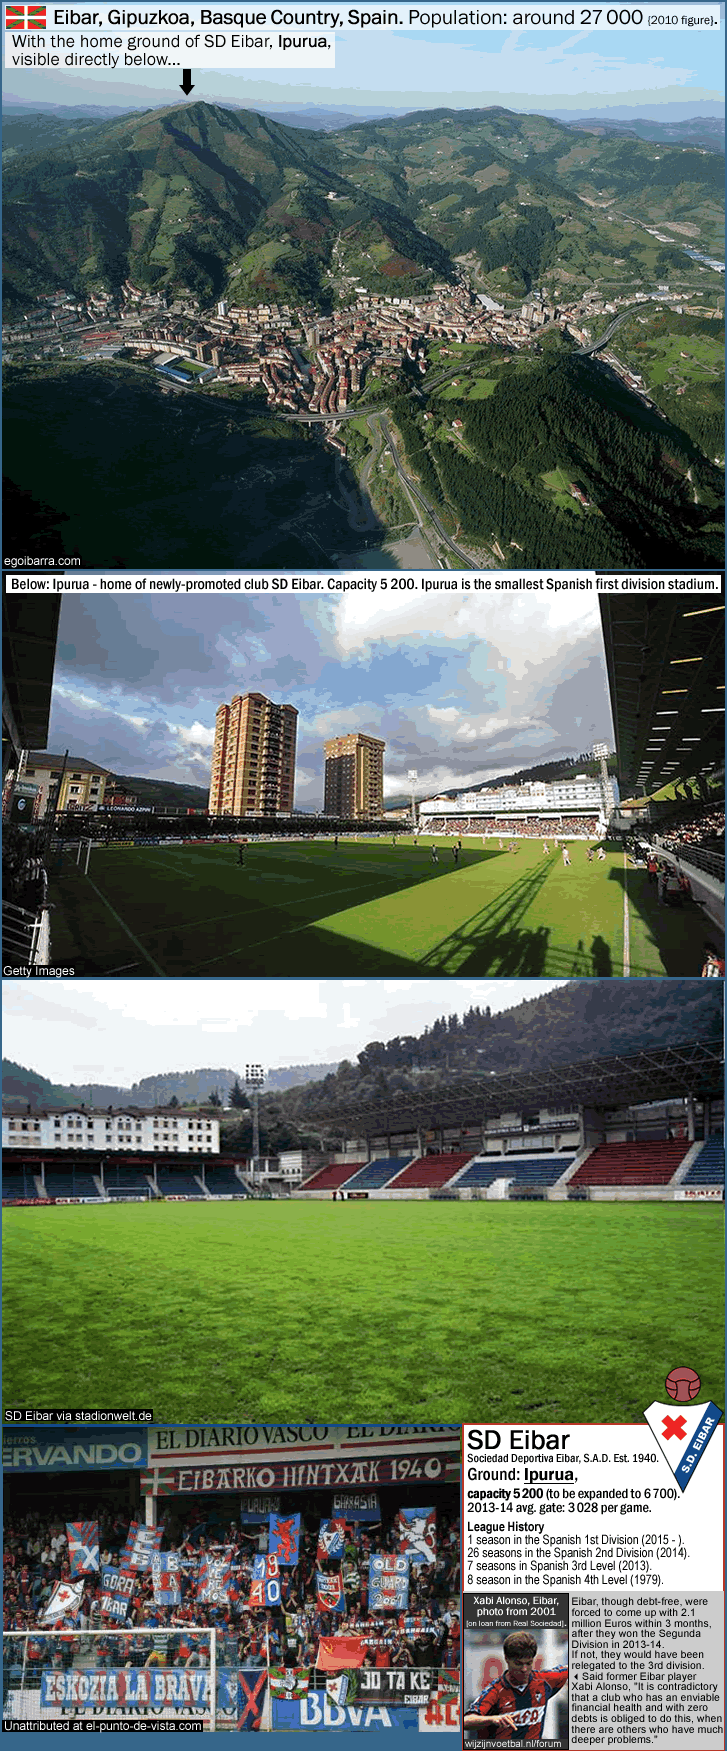
Photo credits above – Town of Eibar seen from aerial view, by egoibarra.com. Interior photo of Ipurua with public housing in background, by Getty Images via the worldgame.sbs.com.au. Interior photo of 2 main stands at Ipurua with hills in background, by SD Eibar via stadionwelt.de. SD Eibar supporters with banners and flags, photo unattributed at el-punto-de-vista.com. Xabi Alonso photo as Eibar player in 2001, unattributed at wijzijnvoetbal.nl/forum/buitenland/48620-sd-eibar-1-baskische-bazen-op-weg-naar-de-primera-division.html.

[Note: Eibar is pronounced "A-bar".] SD Eibar, formed in 1940, are a small club from the Basque Country, in Eibar, Gipuzkoa province, in the steep and looming foothills of the Pyrenees in northern Spain. Eibar is located about equidistant from the two largest Basque cities in Spain – 49 km (30 mi) southeast of Bilbao and 56 km (35 mi) southwest of San Sebastian. The town of Eibar has a population of only around 27,000 {2010 figure). Sociedad Deportiva Eibar wear Barcelona’s colors and play in a 5,200-capacity stadium called Ipurua, and their fan base is about 2,500 or so (they drew 3.0 K in 2013-14). The club often relies strongly on loan players in general – often from the two biggest Basque clubs, Athletic Club [Bilbao] and Real Sociedad (of San Sebastian). Examples from the recent past include Spain national team members Xabi Alonso (of Real Madrid) and David Silva (of Manchester City), both of whom were sent by Real Sociedad to Eibar (14 years ago and 10 years ago, respectively) to toughen them up, early in their careers.

Eibar’s manager is the 39-year-old Bilbao-born Gaizka Garitano, who played in the midfield for Eibar for about 5 seasons total in two different spells (last in 2005), along with spells at all three of the biggest Basque football clubs (with Athletic Club for 111 league appearances from 1993-99; with Real Sociedad from 2005-08; and finishing his playing career with Alavés in 2008-09). Garitano took the reins at Eibar two years ago and has now led Eibar to back-to-back promotions.

Eibar has played 26 seasons in the second division, but had never won promotion to La Liga. Last season [2013-14], Eibar had just won promotion back to the second division, yet still had a higher wage bill than several clubs in Segunda División, including clubs that draw more than three-times-higher than Eibar, like Alavés and Hércules. Thus, Eibar gambled (successfully) on using a slew of somewhat expensive loan signings towards building a team that had a real chance of getting promotion – instead of having the approximately 1.7 million Euros in the bank that would have kept them safe from the stringent rules in place in the Spanish second division concerning fiscal solvency {see next paragraph and also see this article from May 2014 from the blog called El Punto de Vista, Let’s talk about SD Eibar}. As Neil Morris writes in the article at that link, “Much of [Eibar's] wage bill has been taken up by the loan fees of players from the top flight such as Berchiche, Eizmendi, Jota, Morales, Rivas and Garcia, and these deals have certainly helped them in their quest for promotion. The decision to keep a high wage bill seems to be a calculated gamble that has paid off with the ultimate prize.”…{end of excerpt from el-punto-de-vista.com/2014/05/28/lets-talk-about-sd-eibar by Neil Morris}.

The transition from the semi-pro third division to the pro second division is huge and often difficult in Spain because the clubs have to basically change their whole legal structure and become an S. A. D. {definition of S. A. D. in the following paragraph}, and then they have to have millions in the bank to fulfill the extremely stringent criteria. In the Spanish second division, as per a 1999 law intended to curb spending excess, each club must have cash on-hand (capital) equal to 25% of the average expenses of all sides in the second division (not counting the two clubs with the biggest outlays and the two with the smallest) – and in 2013-14, that amounted to about €1.7 million (or about $2.3 million). Last season, Jaén and Mirandés (both promoted to the Segunda División for 2013-14 along with [Basque sides] Alavés and Eibar) had similar problems in transitioning and navigating the red tape and the financial hurdles – Jaen got relegated back to the third (finishing second-to-last in 21st place) while Mirandés (finishing in 19th place) also would have been relegated right back to Segunda B had not the authorities banished Murcia instead on financial irregularities {see this from Marca on 8 August 2014, [article is in the Spanish but with a translation button to the English at the top left at the link], La LFP desciende al Murcia a 2ªB y asciende al Mirandés}. Last season, Eibar could very well have also went right back down to the third division if they remained within the spending rules throughout the whole season.

[Definition of S. A. D., from the Wikipedia page Sociedad Anónima Deportiva, {excerpt}... ..."Sociedad anónima deportiva ("Public limited sports company") is a special type of public limited company in Spain. The new legal status was introduced in 1990 to improve financial management and transparency in sports clubs. Many Spanish football and basketball clubs add the suffix S.A.D. to the end of their official name, e.g. Club Atlético de Madrid, S.A.D.. Every club which plays in Segunda División or [La Liga] and remains in the league is obliged to convert in S.A.D. Due to historical reasons Athletic Club, FC Barcelona, Real Madrid and Osasuna were allowed to retain their status as non-commercial sports associations.”…{end of excerpt}.]

Right when Eibar won the 2013-14 Segunda División in late May, there was talk that the authorities would block their promotion because of S. A. D. guidelines, and the following link is an article from that time period in the late spring of 2014 when it looked questionable for Eibar’s chances of being in the top flight (or the second tier for that matter). From 27 May 2014, from Guardian.com/football, from here is an article by Phil Ball, the author of the excellent book on Spanish football, Morbo
Could Eibar’s astonishing rise to La Liga end before a ball is kicked? The smallest club to enter the top flight of Spanish football, described as a ‘model club’, could be demoted before the season starts due to ‘unfair’ regulations

A small club going up into the second tier, whether it is their first time in the second division or like Eibar in bouncing back up – will invariably find themselves forced to cut corners on player purchases just to remain within the Segunda División’s strict rules about fiscal solvency and the rules about becoming an S. A. D. (and their rule of literally having millions in the bank). One could make the case for the fact that had Eibar not gambled on success, a conservative and penny-pinching fiscal outlay resulting in a weaker squad would have just ended getting them relegated in 2013-14 the old fashioned way – via results on the pitch. If that is all true, I just love Eibar even more. For going for it. Well, via a limited share offering the club put together, football fans from all over (from 48 nations) plunked down cash to help Eibar’s cause, and the small club from hills of the Basque Country did raise the cash (the equivalent of $2.47 million was raised). From 16 June 2014, Eibar raises cash needed to play with the big boys (theworldgame.sbs.com.au via Omnisport).

From the New York Times, from 23 July 2014, by Raphael Minder, A Tiny Club’s Uneasy Rise – Eibar Is Facing Stiff Challenges in Spain’s La Liga.

From CNN, from 22 August 2014, by Chris Murphy and James Masters, Tiny Eibar take on Spanish soccer’s big guns Real Madrid and Barcelona (edition.cnn.com/sport/football).

I’ll leave the last word on this to Xabi Alonso, who with David Silva was instrumental in getting the world out that Eibar needed help from football fans the world over…to be allowed to play in La Liga this season. “It is contradictory that a club who has an enviable financial health and with zero debts is obliged to do this, when there are others who have much deeper problems.”…{quote by Xabi Alonso and can be found at the link third from above}.

    Attendance problems, with lots of empty seats in Spain (plus billions of debt)

From Inside Spanish Football.com, from 5 March 2014, by Jen Evelyn, La Liga’s alarming attendance deficit demands actions (insidespanishfootball.com).

Attendance is down in Spain. As the article above touches on, the late start times (10pm) for some games and the lack of a definite schedule resulting in the switching of some game-dates and game-times – these things have not helped attendances in La Liga. Of course the economy is absolutely dreadful in Spain, but that has not actually eroded attendances since mid-2008 as much as one might have expected (see next paragraph).

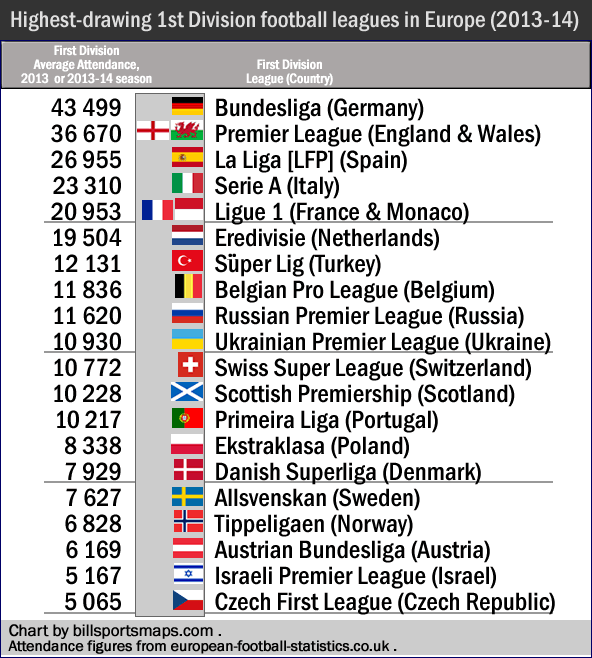
Last season [2013-14] La Liga had a minus-1,282 per game average attendance drop or a 4.5 percent drop (26,995 per game in 2013-14, down from 28,237 in 2012-13). And in the season before, it was a 2 percent drop. If you are wondering about the lingering effects of the 2008 global economic downturn, well, in 2007-08, right before the market-crash, La Liga was averaging 29.1 K; and from 2008-09 to 2011-12 (4 seasons), league attendance stayed in the 28 K range, with it diminishing from 28.7 K average in 2011-12 to 28.2 K average in 2012-13. In other words, the slight-drop-off in crowds from the initial economic devastation in 2008 had already happened, and now in the last two seasons there is starting to be a bit of a steeper drop. From the Row Z Football blog, here is a graph from 2 years ago that shows what I was talking about in the last sentence, rowzfootball.files.wordpress.com/2013/06/european-football-attendance-chart.jpg; and here is a current chart showing attendance change in the Big 5 European leagues last season, European League Attendances 2013-14.

La Liga – playing to 125 thousand empty seats each week
And it is worse than it first appears because, as Ms. Evelyn points out in the article linked to 3 paragraphs above, the average La Liga stadium holds about 37,000, yet the league averaged about 27,000 per game in 2013-14…so La Liga clubs are playing to less than 75 percent capacity. Actually, it is even worse. I did the math {via these stadium capacity figures}, and the 20 La Liga stadiums in the 2013-14 season averaged a 39,531 capacity. So La Liga played to 68.2 percent capacity. That is really bad. That percent capacity figure of 68.2 is like what former-Premier-League clubs in England’s second and third division draw (such as Leeds (63.3) and Wolverhampton (65.8) /see this chart (Eng. 2014 attendances)).

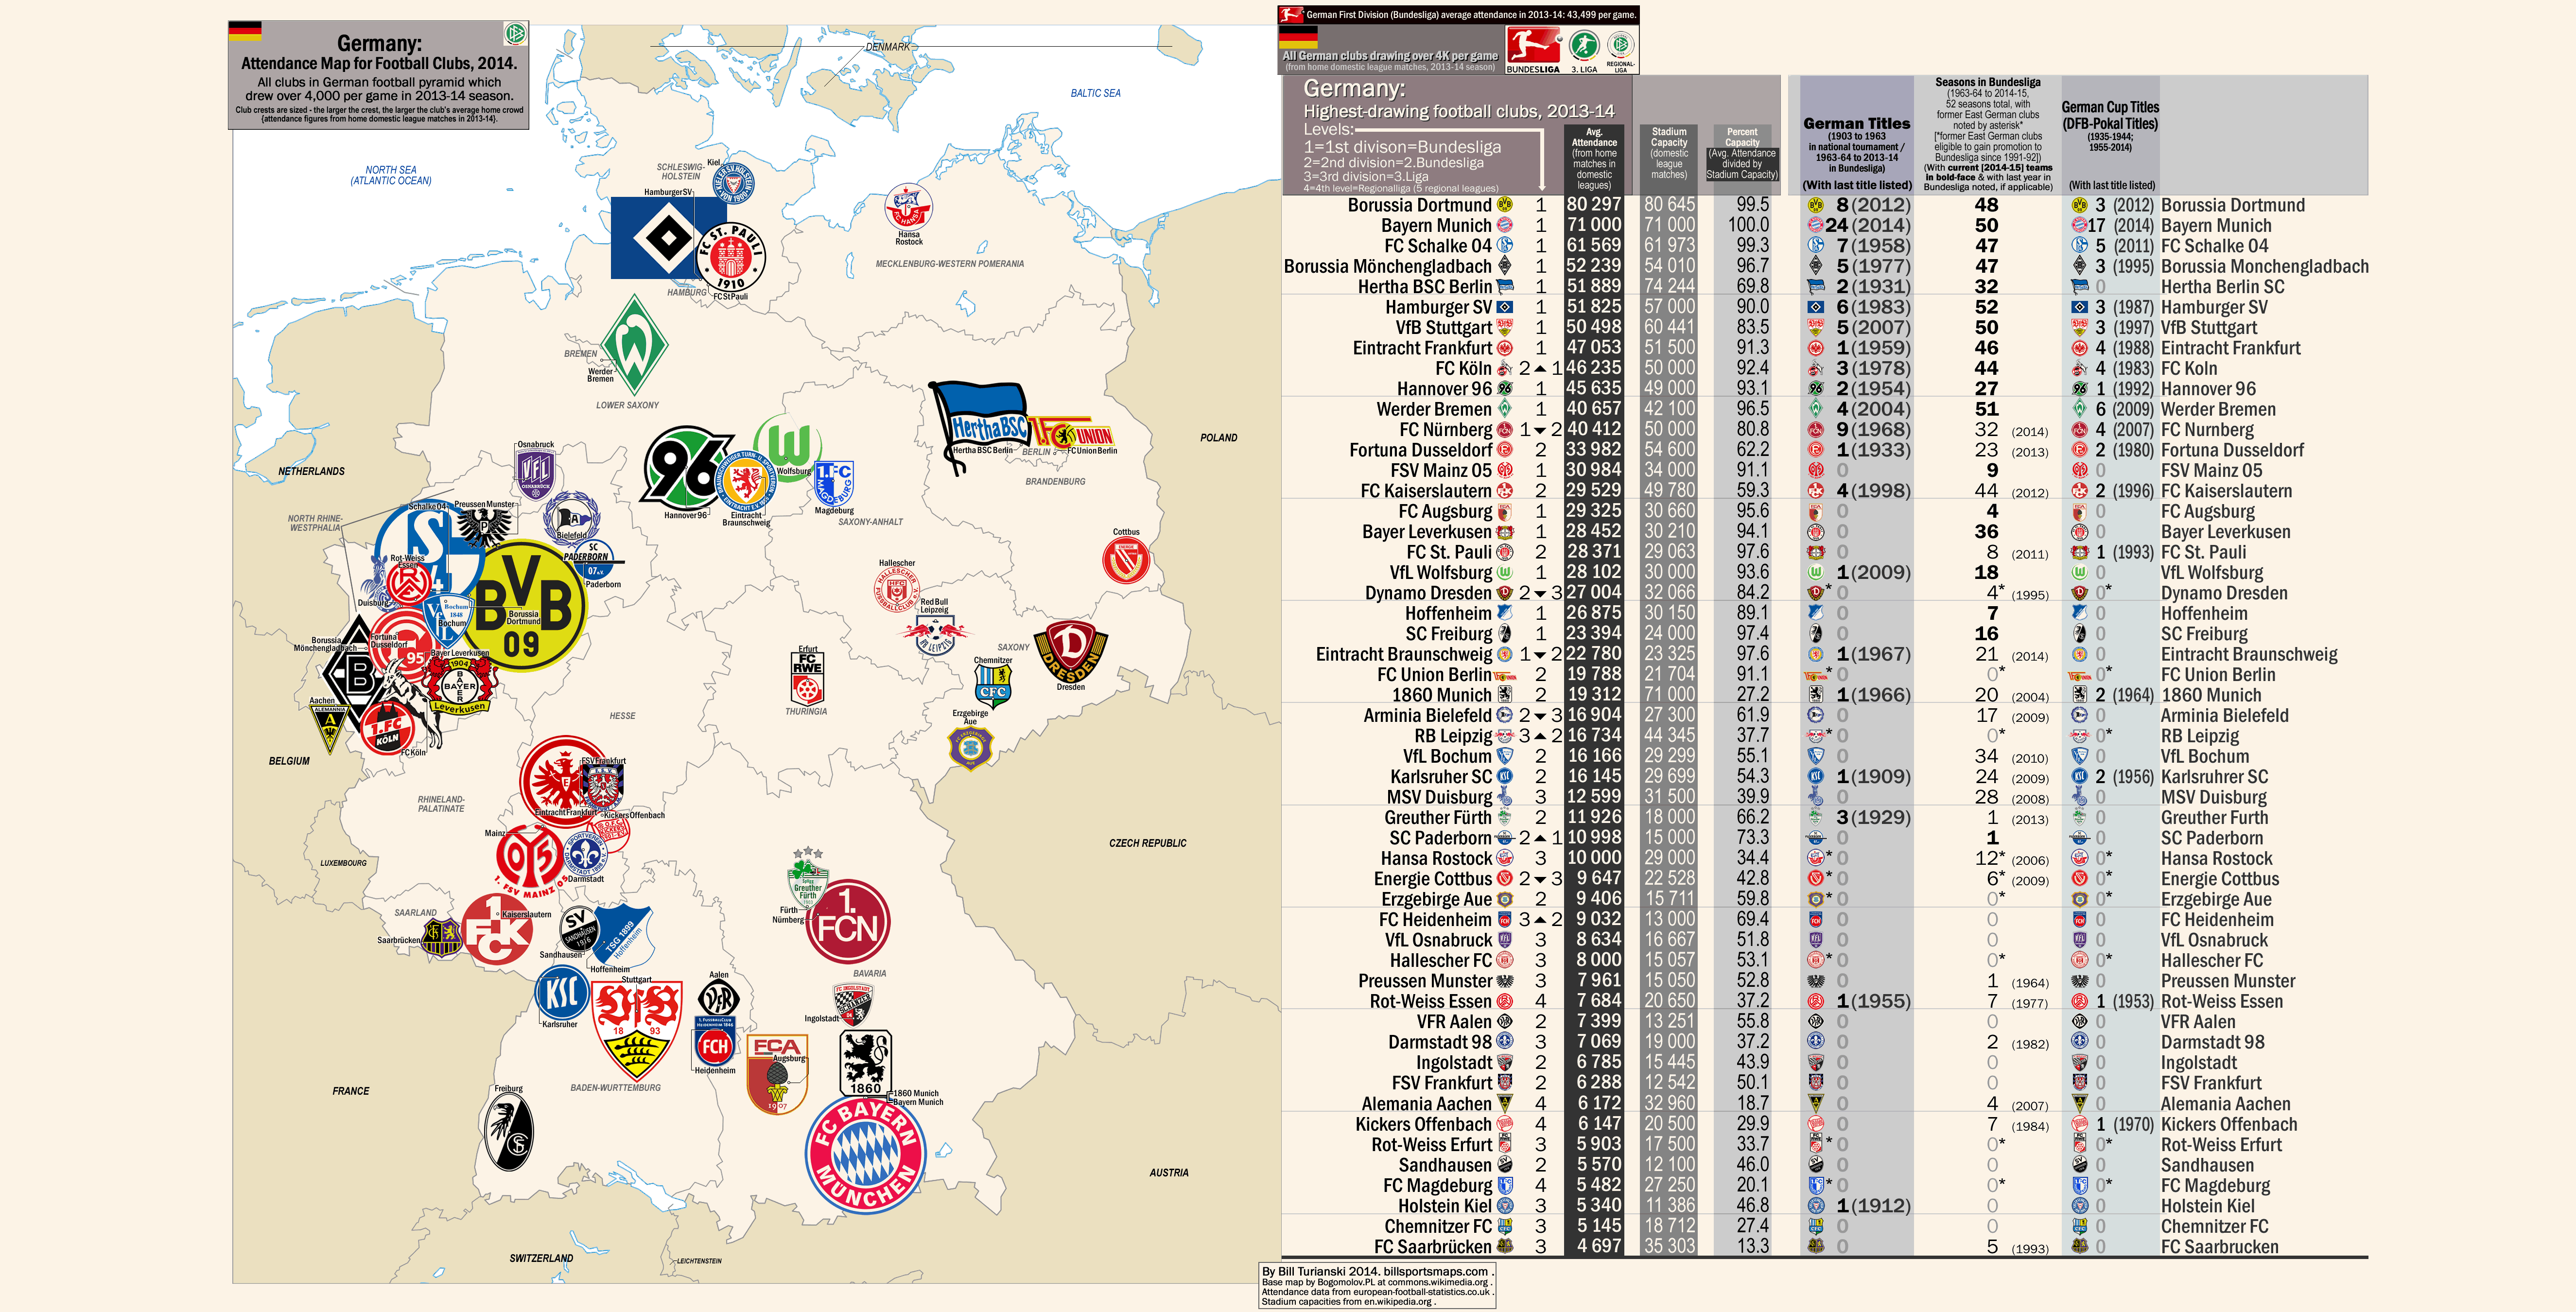
Percent capacity that low is usually not the sign of a successful major league. 18 of 20 clubs in the Premier League in 2013-14 played to above 90 percent capacity (Sunderland [84.9 pct-cap) and Aston Villa [84.1 pct-cap] were lowest there); in the Bundesliga in 2013-14, 16 of the 18 clubs played to above 90 percent capacity (Nürnberg [80.8 pct-cap] and Hertha Berlin [69.8 pct-cap] were lowest there). In the Premier League, if even one or two clubs are playing to less than 75 percent capacity or so, it is news. Like when Wigan were in the top flight – that’s all you ever heard about in reference to Wigan. Here, in Spain, that sort of lack of drawing power among top tier clubs is becoming the norm. Three-quarters (16 clubs) of the Spanish first division played to crowds below 75 percent capacity. Just two clubs filled their stadium in the 80 percent range: Atlético Madrid played to 84.3 percent-capacity, and Real Madrid played to 83.7 percent-capacity. And exactly one club played to above 90 percent capacity – Athletic Club Bilbao…in their new stadium. So that is how bad it is with regards to attendances in Spain – Premier League: 18 of 20 clubs played to above 90 percent-capacity / Bundesliga: 16 of 18 clubs played to above 90 percent capacity / Spain: 1 of 20 clubs played to above 90 percent capacity…thanks to their brand new stadium.

A big reason why Real Madrid or Barcelona win the title 90 percent of the time
What is contributing to the malaise of Spanish football is the structural problem of allowing a certain couple of clubs (Real Madrid and Barcelona) to negotiate their own television deals, thereby insuring that the lions’ share of television revenue produced by Spanish first division football goes to just two clubs. Via their television deals, Real Madrid and Barcelona get over one hundred million Euros more per year than most of the other clubs in La Liga. The following link shows 2 pie-charts which reveal one of the primary causes of the pronounced duopoly in Spanish football. There are several reasons why Real Madrid and FC Barcelona dominate La Liga to such an extent, but in the modern game, uneven distribution of television revenue is at or near the top of the list of causes for this disparity. A disparity which, when combined with the huge crowds and thus the huge ticket revenue that the Big Two pull in (above 70 K per game for both clubs) is leaving the rest of Spanish football behind. Many of the other La Liga mainstays have gone into serious debt in the last decade trying to keep pace with Big Two, thanks to the disparity in television revenue between the Big Two and the rest. A disparity, which, when combined with the absolutely horrible economy in Spain, threatens the viability of first division Spanish football. From Imgur, ‘How TV money is shared in Spain and in England [2012 figures/illustration unattributed]‘ (imgur.com/vTZ9B5f).

Talk about an uneven playing field. And yes, I know that Atlético Madrid won the Spanish title last season. That doesn’t change the fact that Real Madrid and Barcelona have a grossly unfair advantage over all the rest, it just shows what a monumental achievement it was for Atlético Madrid, when the deck is stacked against every Spanish club besides the Big Two. And anyway, go look at that pie chart again and tell me who are the only other clubs besides Real Madrid and Barcelona to have bigger slices of the television revenue pie than the forgotten and hopeless rest-of-the-pack. That’s right…Valencia and current champions Atlético Madrid.

From El Centro Campista blog, from 6 August 2013, by Callum Nolan, La Liga’s haves and have nots (centrocampista.com).

Why are there no attendance figures reported for the 3rd division in Spain?
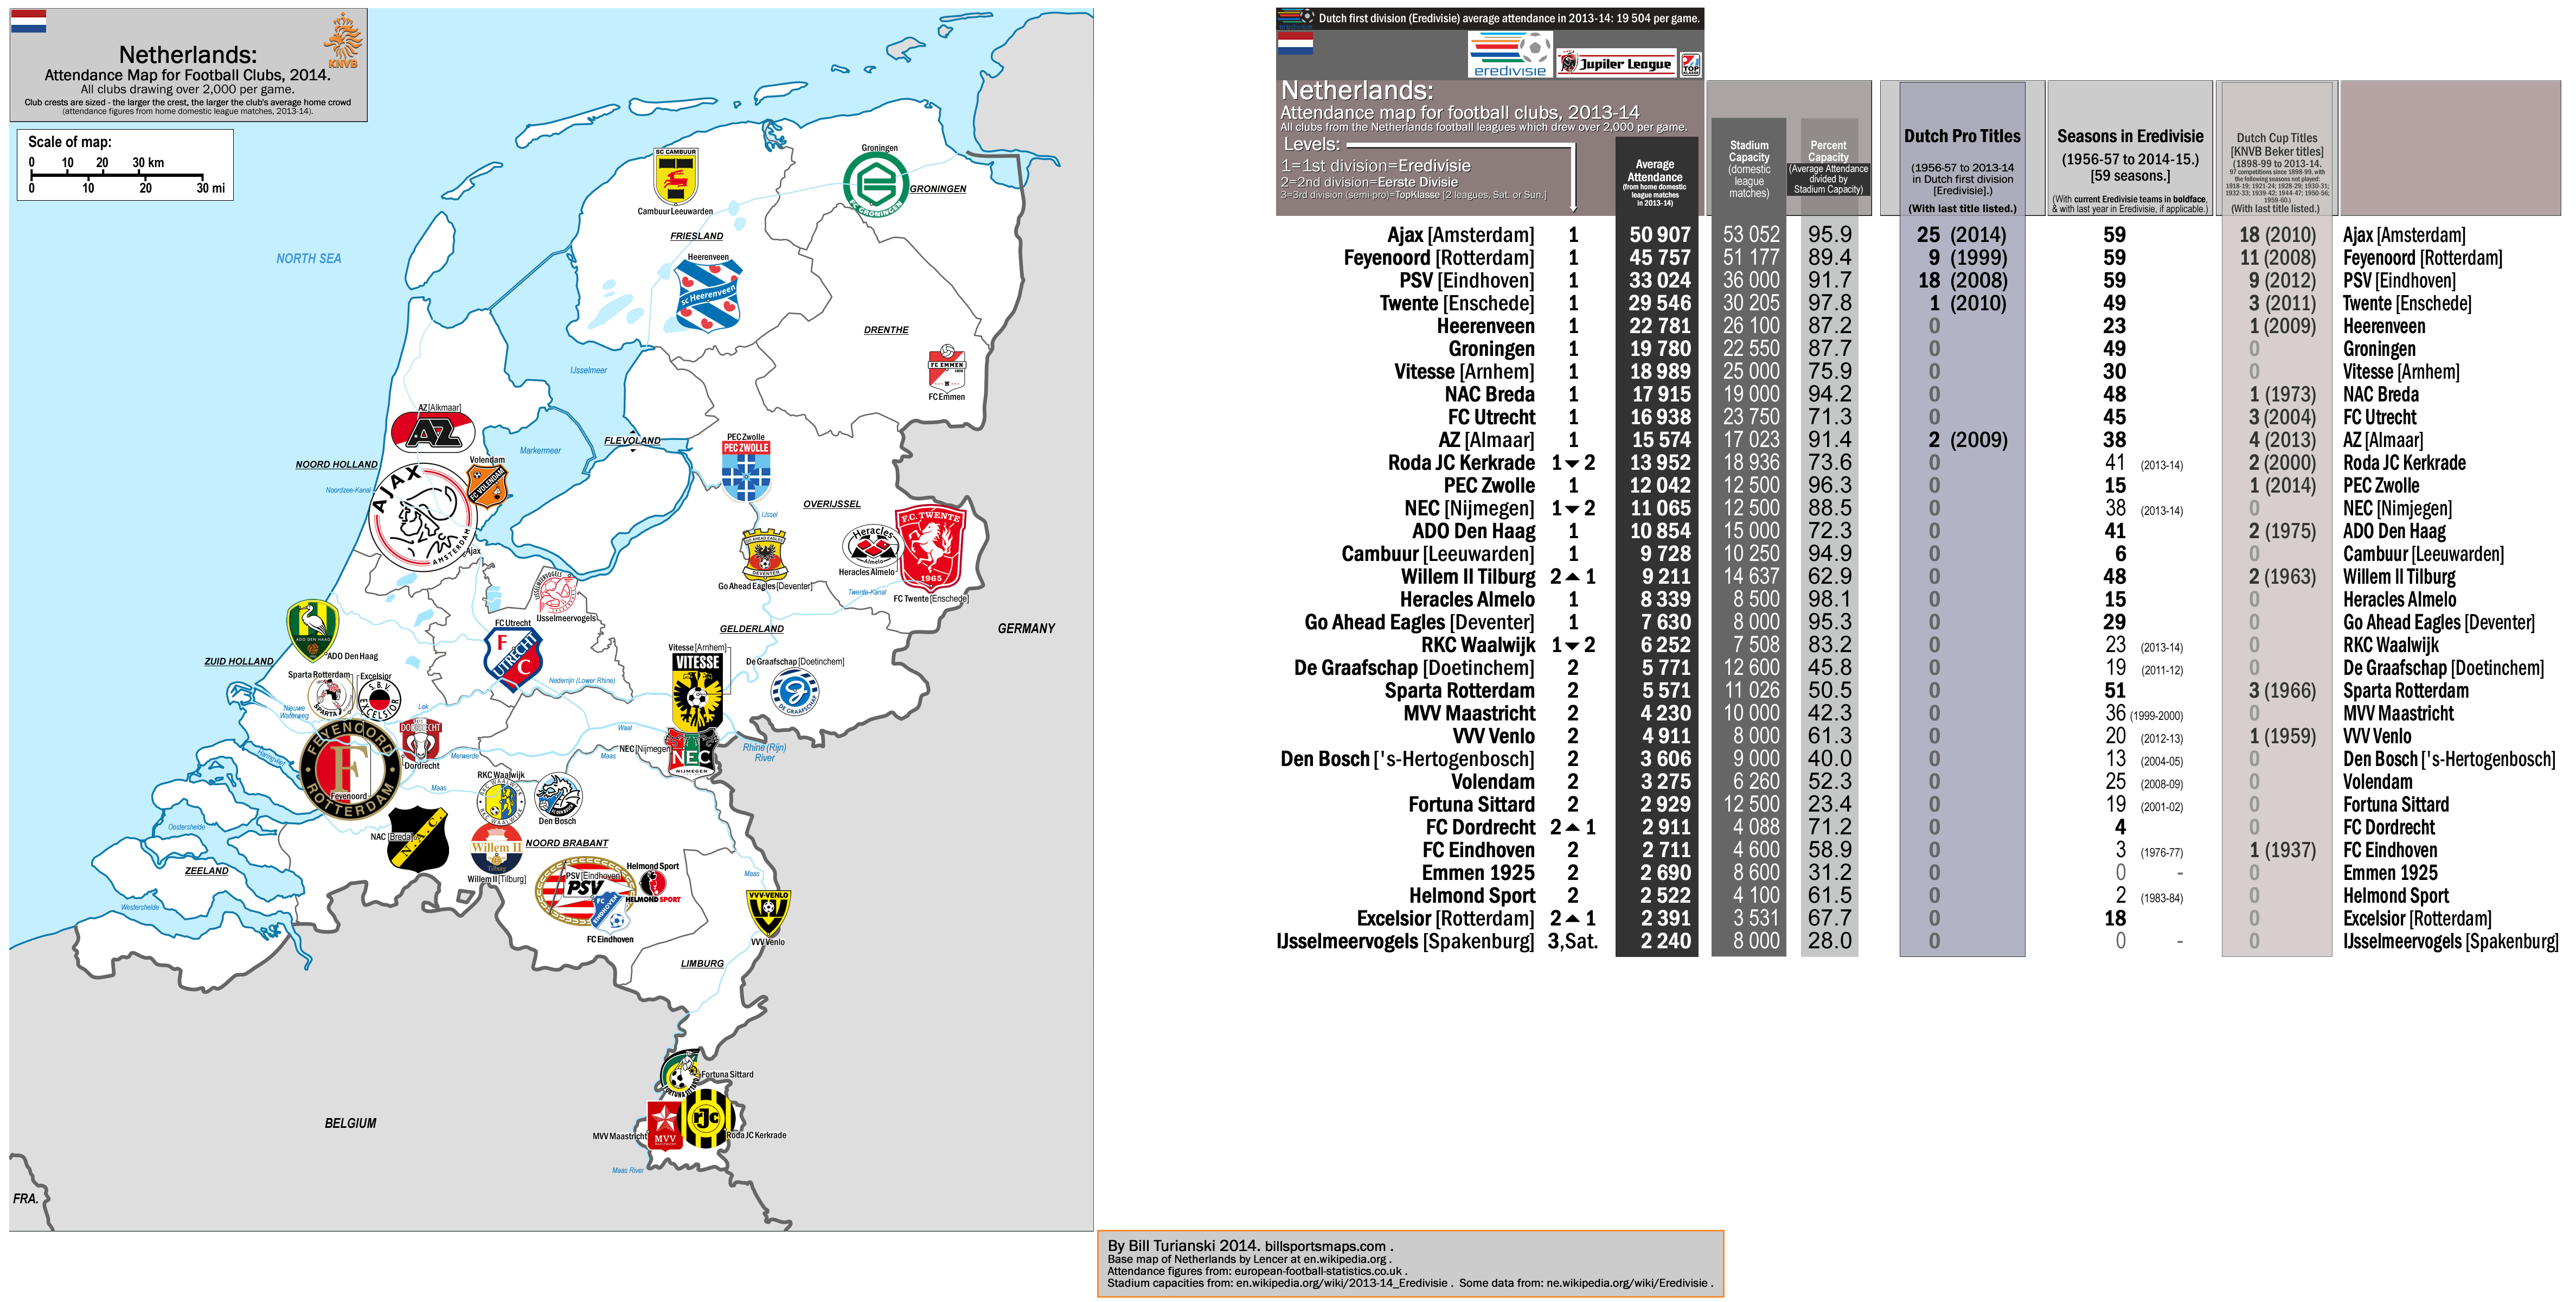
Spain might have a couple of the biggest football clubs in the world, but last season there were only 12 clubs in the whole country which drew above 20 K (meanwhile there were 27 clubs in England [& Wales] who drew above 20 K and there were 23 clubs in Germany who drew above 20 K). And in Spain, lower-league support is very thin. The Spanish football league system goes fully amateur below the third level, but it is not unknown for there to be amateur clubs in the semi-pro 3rd division. But they don’t even bother recording attendance figures in the regional third level in Spain, the 4 league/80 team Segunda División B. Elsewhere in Western Europe and in several places in Central Europe and in Eastern Europe, you can get attendance figures easily for the third divisions. Of course England has the most comprehensive reporting of lower league attendance figures…it is no problem getting attendance figures from the regional 6th level in England {like here}, and the 7th and most of the 8th level leagues in England produce readily available attendance figures {like here}. Germany produces attendance figures for all their lower leagues to at least the 5th level (which includes the semi-professional 4th level and the amateur 5th level there). Italy reports attendance for the top 4 divisions. France has attendance figures for its 3 top levels including their amateur 3rd division. Netherlands reports attendance for the top 2 levels (the pro levels there) there, as well as their amateur 3rd level (the Saturday and the Sunday leagues). And countries in Europe with pro leagues ranked far lower than Spain record attendance figures for their third divisions…Ukraine reports attendance for the top 3 tiers there, as does the Czech Republic, Sweden, Poland and even Denmark (including the 3rd tier in Denmark where over half the clubs are drawing below 350 per game). {Note: German and Italian and French and Dutch and Polish and Ukrainian and Czech and Swedish and Danish lower leagues attendance can be found at E-F-S site, here, among other places}. Here is the Spanish 3rd division official website, try finding attendance figures there (you won’t). I did not find attendance figures anywhere for the Spanish third tier, and a gentleman who helps run a Racing Santander web-forum confirmed to me what I had already figured out – they don’t exist (see thank you credits at the bottom of this post).

And what would be so shameful if attendances in Segunda B were revealed to be, outside of a few down-on-their luck mid-sized clubs, primarily within the 2 K to 3 K range, with several within the 500 to 1,000 range? If the figures were out there, at least you could talk about it. In this day and age, the status quo of absolutely no reporting of third division attendance in Spain looks more like a cover-up. A club of any size should not be ashamed of how low they are drawing at any one point in time (due to say, a relegation or two), to actively avoid announcing of their crowd sizes. A club that is a mainstay of any given league in any given level in any given country should not be ashamed of its attendance figures to actively avoid (and even repress) any reporting of it.

“It’s astounding how tolerant we all are to this corruption,” says Rubén Uría, a Spanish sports journalist with the Cope radio network and Eurosport.
{the quote above is from the article at the link below}
La Liga and by extension the Spanish football authorities act like a corrupt banana republic, with its special rules for its special friends. Special rules for the Big Two as seen in Real Madrid’s and Barcelona’s lucrative and separate-from-the-rest-of-the-league television deals. And special rules for the big boys – like the much more stringent and onerous financial rules for anyone entering into the second division compared to the spendthrift first division, where debts have reached the billions. And politicians, not actual bankers, running the banks that lend this crazy-cash to the profligate-spending clubs. As the article below points out, since 2006, half of the clubs in the top two divisions have entered bankruptcy proceedings, and by 2011-12, debts had reached €3.75 billion. From Newsweek, from 15 May 2014, by Mike Elkin, Spanish Soccer: World Champions (of Fraud) (newsweek.com). And smack dab in the middle of the most successful region of pro football in the world – Western Europe – the Spanish football authorities think it is perfectly acceptable to not even bother to report third division attendance figures. Meanwhile, judging by the alarming state of many first division clubs’ finances in Spain, it looks like more clubs and more clubs bigger than Alavés, Tenerife, Racing Santander, Hércules or Murcia will be finding themselves in (hopefully temporary) exile in the Twilight Zone of third division Spanish football. There in Segunda B, where few attend, and where the Spanish football authorities and the Spanish media never report attendances.

___

Thanks to NordNordWest, for the blank map of Spain, at ‘File:Spain location map.svg‘ (en.wikipedia.org). Thanks to Miguillen, for the blank map of the Canary Islands, at ‘File:Canarias-loc.svg‘ (en.wikipedia.org). Thanks to the contributors to the pages at La Liga and Segunda División (en.wikipedia.org and es.wikipedia.org and de.wikipedia.org).

Thanks to European-Football-Statistics site for attendance figures, http://www.european-football-statistics.co.uk/attn.htm.

Special thanks to Peña at RacinguistasOnline.com , who responded to my question of what he would estimate Racing Santander’s 2013-14 average attendance was, there in the Segunda B. He responded…” …At the beginning of the season, more or less 2.000-3.000 persons per game, more or less from february, with the expulsión of thieves, attendance grew up, more or less to 8.000 persons per game, although is very difficult to calculate, because there was games with almost full attendance (18.000) and other with 5.000… “…{end of excerpt from e-mail}. That sounded like about somewhere between 3.5 and 4.5 K per game to me.

August 11, 2014

England & Wales: the highest-drawing football clubs within the English football leagues system (all clubs [74 clubs] that drew above 4 K per game in the 2013-14 season) / Plus a short illustrated article comparing English and German attendances last season, by division.

(Note – to see my latest map-&-post of the Premier League, click on the following: category: Eng>Premier League.)
.
.
.
.
.
.
.
.
england_2014-attendance-map_74-clubs_all-drawing-above-4k_post_d_.gif
England attendance map 2014 (all English & Welsh clubs drawing above 4,000 per game in 2013-14 [74 teams])


This continues my new category of European football leagues attendance maps. This map is for England, including the Welsh clubs within the English football leagues system – of which there are 6, with 2 clubs from Wales on the map here/ {see this post I made from 2011 on Welsh clubs within the English system} [There are 2 Welsh clubs on this map - Premier League side Swansea City, and just-relegated Championship side Cardiff City]).

The map & chart here shows all football clubs in the English football leagues system which drew over 4,000 per game in the 2013-14 season (from home domestic league matches). The larger the club-crest is on the map, the higher the club’s attendance. The chart at the right-hand side of the map page shows 2013-14 average attendance, stadium capacity, and percent capacity. Also shown at the far right of the chart are: each club’s English titles (with year of last title), seasons spent in the English first division (with last year in the top flight listed if applicable), and FA Cup titles (with year of last title). [Some data found at Premier League/Clubs (en.wikipedia.org).]

In addition to the main map, there are 3 inset maps on the map page…for Greater London and Surrounding Area (12 clubs from Greater London on the map plus Watford in Hertfordshire); for the West Midlands including Birmingham, Coventry and Wolverhampton (5 clubs on the map from the West Midlands [but not Coventry City]); and for a section of Northwest England, including Lancashire, Merseyside and Greater Manchester (4 Lancashire clubs, 3 Merseyside clubs and 5 Greater Manchester-based clubs on the map). I added an extra detail of listing the historic counties of England on the map(s).

    A brief comparison of English and German attendances by division (2013-14 figures)

england_and_germany_football-leagues_attendance_2013-14_by-division_c_.gif

{Note: 2013-14 English leagues football attendance [top 4 levels] can be seen at the following link, by clicking on “England” on the left-hand sidebar at: http://www.european-football-statistics.co.uk/attn.htm}.

There were 74 clubs in the English system which drew over 4,000 [4 K] per game last season – all 20 Premier League clubs; all 24 Football League Championship clubs; 20 of the 24 Football League One clubs; 9 of the 24 Football League Two clubs; and 1 Non-League/Conference club. As far as clubs which draw over 4,000 go – that is the most in Europe (and in the world). Second-most is Germany, which had 52 clubs that drew over 4 K last season.

However, the German first division, the Bundesliga, draws much higher on average than the English Premier League does – over 6.5 K higher in 2013-14 (Bundesliga averaged 43,499 per game in 2013-14, versus 36,670 for the Premier League last season). Of course, the Bundesliga is the highest drawing association football league in the world. But Germany’s preeminence in crowd sizes changes as you go down the pyramid in their league system, especially below the second division. Before I get to that I should point out that while last season [2013-14], the second division in Germany outdrew the second division in England (by about 1.2 K), in the two seasons previous, the second division in England – the Championship – drew slightly higher than the second division in Germany – by about .2 K in 2012-13, and by about .5 K in 2011-12. That drop in League Championship attendance last season (down by about .8 K in 2013-14 compared to 2012-13) can mostly be attributed to the temporary inclusion of a rather small club into the second tier, the now-relegated Yeovil Town, combined with the temporary expulsion of a somewhat large club, the now-promoted-back-to-the-second-tier Wolves (switching Yeovil for Wolves in the second division was the equivalent to a -.63 K drop in Championship attendance, when you subtract 2013-14 Yeovil Town crowds [6.6 K] from 2012-13 Wolves’ crowds [21.2 K] and divide by 24).

The third division in England – League One – outdrew the third division in Germany – 3.Liga – by about 1.4 K in 2013-14, while two seasons ago [2012-13] England’s third tier outdrew the third tier in Germany by about .2 K, and three seasons ago [2011-12] England’s third level outdrew Germany’s third level by 1.7 K. So the average for the past three seasons is about +1.1 K more in England’s third division than in Germany’s. Below the third division, it is impossible to compare the two countries’ leagues on a like-for-like basis because Germany’s system is national for only the top 3 divisions and becomes regionalized from the 4th level on down, while the English system stays national all the way to the 5th division. Nevertheless, you can compare the two sets of lower leagues in this way… Germany’s 4th level (90 clubs within 5 regional leagues) could be compared with England’s 4th-through-6th levels (92 clubs in 3 levels [4th level /League Two/24 clubs + 5th level/Conference/24 clubs + 6th level/Conferences North & South/22 clubs in 2 regional leagues making 44 clubs]).

Generally, below the 3rd level, the German football system starts to be full of clubs drawing in the 1 to 2 K range (only 10 of the 90 clubs in the five German Regionalliga [4th level] drew above 2 K last season, and just 6 drew above 3 K, and a mere 4 of those 90 clubs drew above 4 K last season) {2013-14 German leagues football attendance can be seen at the following link, by clicking on “Germany” on the left-hand sidebar at: http://www.european-football-statistics.co.uk/attn.htm}. Meanwhile, below the third tier, the English system has, usually, a plethora of clubs drawing above 2 K (there were 28 last season, with 21 League Two clubs drawing above 2 K last season, and a somewhat impressive 7 clubs in Non-League drawing above 2 K (all in the Conference/see these figures at soccerway.com}. Also, England’s fourth tier boasted a majority of clubs drawing above 3 K (16 clubs above 3 K in League Two last season). And, as alluded to two paragraphs above, last season those two divisions in England (4th and 5th levels) included 10 clubs drawing above 4 K (9 League Two clubs plus the now-promoted Luton Town).

So, Germany is king of big-league football attendance, but England’s league system has significantly more substantial support in the lower levels of the Football League and the in the top tier of Non-League football.


In case you are wondering, below are the clubs which came closest to being on this map…
(Below are all clubs in the English system that drew in the 3 thousands in 2013-14)…
York City (3.7 K per game in 2013-14 in League 2), Colchester United (3.7 K in League 1), Hartlepool United (3.7 K in League 2), Exeter City (3.7 K in League 2), Grimsby Town (3.5 K in 5th level/Conference), Wycombe Wanderers (3.4 K in League 2), Crawley Town (3.4 K in League 1), Mansfield Town (3.3 K in League 2), Bury (3.1 K in League 2), Cambridge United (3.0 K in 5th level/Conference).
-Attendance data sources – Premier League and Football League, European-Football-Statistics.co.uk; Non-League, http://us.soccerway.com/national/england/conference-national/20132014/regular-season/r21458/.

Finally, here are the winners of each of the top 5 divisions in England last season (with each club’s average crowd size).
1st division, 2013-14 Premier League, 36,670 per game (winner: Manchester City at 47.7 K).
2nd division, 2013-14 League Championship 16,609 per game (winner: Leicester City at 24.9 K).
3rd division, 2013-14 League One, 7,476 per game (winner: Wolves at 15.4 K).
4th division, 2013-14 League Two, 4,351 per game (winner: Chesterfield at 6.2 K).
5th division, 2013-14 Conference National, 1,864 per game (winner: Luton Town at 7.3 K).
___

Thanks to the contributors at ‘Premier League‘, ‘Football League Championship‘, ‘Football League One‘, ‘Football League Two‘, ‘Conference Premier‘ (en.wikipedia.org).

Thanks to European-Football-Statistics.co.uk, for attendance figures.

Thanks to the Footy-Mad sites [http://www.footymad.net/premier-league-news/], for club League Histories, such as http://www.derbycounty-mad.co.uk/league_history/derby_county/index.shtml

August 2, 2014

France (including Monaco): 2014 football attendance map – with the 37 highest-drawing clubs in France [all French clubs drawing over 4 K per game] (from 2013-14 home league matches).

Filed under: European Leagues- -attendance maps,France — admin @ 7:08 pm

france_2014_highest-drawing-clubs_all-french-clubs-drawing-over-4k_37-clubs_post_c_.gif
France: 2014 football attendance map – with the 37 highest-drawing clubs in France [all French clubs drawing over 4 K per game]


Note: to see my latest map-&-post of Ligue Un, click on the following: category: France.

This continues my new category of European football leagues attendance maps. This map for France (including Monaco) shows all football clubs in the French football leagues system which drew over 4,000 per game in the 2013-14 season (from home domestic league matches). The larger the club-crest is on the map, the higher the club’s attendance. The chart at the right-hand side of the map page shows 2013-14 average attendance, stadium capacity, and percent capacity. Also shown at the far right of the chart are: each club’s French titles (with year of last title), seasons spent in the French first division, and French Cup titles (with year of last title).

On the map, I have included the major rivers (fleuves) of France. Adding that detail just seemed like the French thing to do. Here is the page at the French Wikipedia where I got that info, ‘Liste des fleuves de France‘ (fr.wikipedia.org). There is a cool map there of the watersheds/drainage basins within France.

My attendance map for England (including some Welsh clubs) will be up next, in about 12 days.
___
Thanks to Eric Gaba for the blank topographic/political map of France, http://commons.wikimedia.org/wiki/Category:Blank_maps_of_France#mediaviewer/File:France_map_Lambert-93_topographic-blank.svg.

Thanks to European-football-statistics.co.uk, for French attendance figures, http://www.european-football-statistics.co.uk/attn.htm.

Thanks to the contributors at ‘Ligue 1‘, ‘Ligue 2‘, and ‘Championnat National‘ (en.wikipedia.org).

July 19, 2014

Germany: 2014 football attendance map, with the 52 highest-drawing clubs in Germany [all German clubs drawing over 4 K per game] (from 2013-14 home league matches). / Plus, a chart showing the 20 highest-drawing association football leagues in Europe (2013 or 2013-14 season).

Filed under: European Leagues- -attendance maps,Germany — admin @ 8:34 pm

germany_2014-attendance-map_top52-drawing-clubs-from2013-14_bundesliga_2-bundesliga_3rd-div_4th-level_post_h_.gif
Germany: 2014 football attendance map, with the 52 highest-drawing clubs in Germany [all German clubs drawing over 4 K per game]


Please note:
My latest Bundesliga map-&-post can be found here, category: Germany.]

This is a new category, European football leagues attendance maps. I have not done full-nation attendance maps for several years now, and I thought it was time to revisit the theme. I will make maps like this for: Germany, England, Italy, Spain, France, and Netherlands. Those 6 countries are home to the top six highest-drawing association football (aka soccer) leagues in Europe [note: see the chart I put together at the end of this post, which shows the 20 highest drawing leagues in Europe]. 5 maps I do in this theme will show every club in that country which drew over 4,000 per game last season [2013-14]; the Netherlands map will show all Dutch clubs which drew over 2,000 per game in 2013-14.

On the map, club crests are sized – the larger the crest, the larger the club’s average home crowd {attendance figures from home domestic league matches in 2013-14/link to source at the bottom of this post}. Besides attendance, each club’s stadium capacity and 2013-14 percent-capacity are shown (percent capacity equals average attendance divided by stadium capacity). Also in the chart at the far right-hand side of the map page are: national titles (with year of last title noted), total seasons spent in the first division by club, and national cup titles (with year of last title noted).

Clubs from the former East Germany (9 clubs from the former East Germany on the map & chart) are noted in the chart by an asterisk [East German clubs were finally able to be eligible for promotion to the Bundesliga in 1991-92, with the inclusion of Hansa Rostock and Dynamo Dresden into 2.Bundesliga for the 1991-92 season, which was a little less than two years after the Berlin Wall fell in November 1989].

I will have the attendance map & chart for France (and Monaco) up next, in about a fortnight.

Below – Chart: the 20 highest drawing association football leagues in Europe

2013-14_europe_best-drawing_domestic-leagues_ger_eng_spa_ita_fra_etc_top20_.gif

Source of data, http://www.european-football-statistics.co.uk/attn.htm.
___
Thanks to Bogomolov.PL for the blank map of Germany, ‘File:Germany localisation map 2008.svg‘ (commons.wikimedia.org).

Thanks to the contributors at ‘Bundesliga‘, ‘2.Bundesliga‘, ‘3.Liga‘, ‘Fußball-Regionalliga‘ (en.wikipedia.org & de.wikipedia.org).

Thanks to European-Football-Statistics.co.uk, for German attendance figures, european-football-statistics.co.uk.

Powered by WordPress