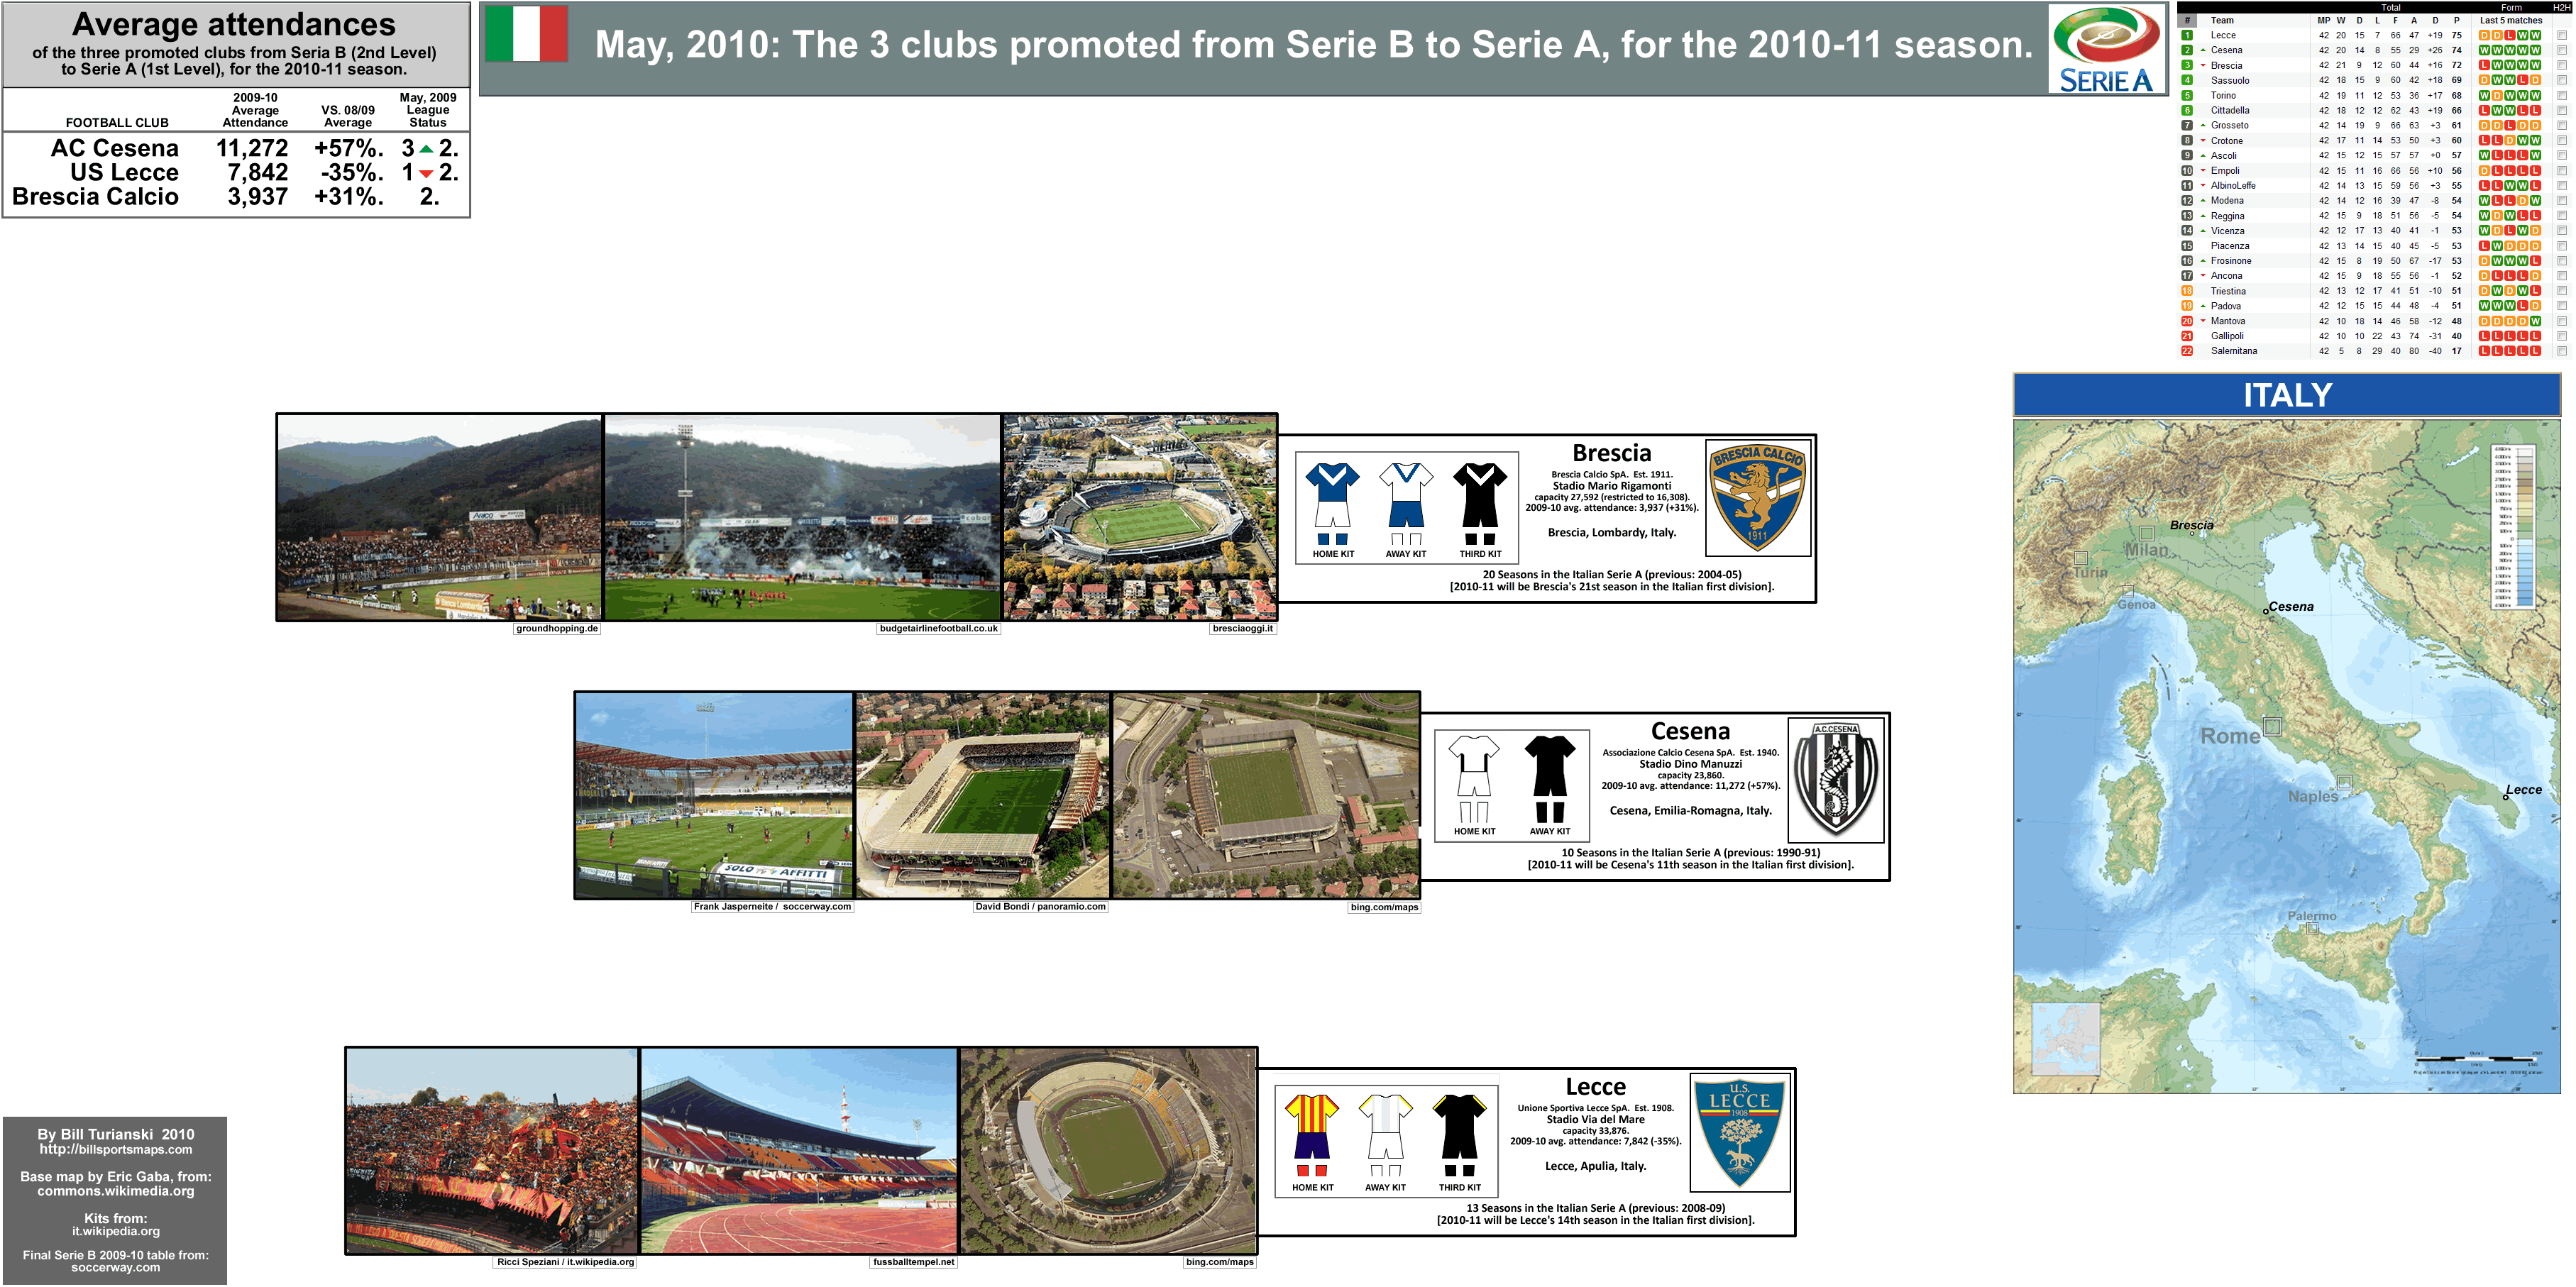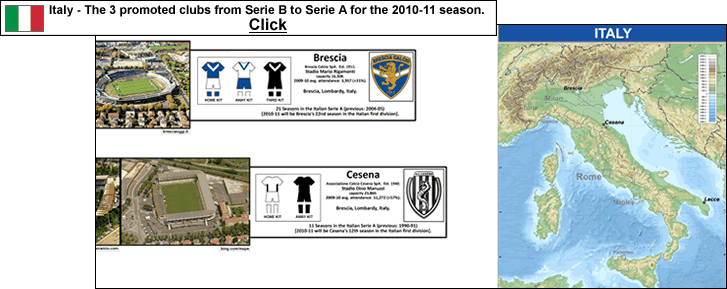
The map page shows the 3 clubs in Italy that won promotion from Serie B to Serie A, in May, 2010. Three photos of each club’s stadium are shown.
…
Yo-yo club Lecce are back, once again, in the Italian top flight, after having won the 2009-10 Serie B title. US Lecce are from Lecce, Apulia (population 94,000 {2009 figure}), which is near the Italian peninsula’s boot-heel tip, on the coast of the Adriatic Sea. Lecce first gained promotion to Serie A in 1985, but were relegated the following season, setting a pattern that stubbornly persists. Lecce got promoted back to the top tier 2 seasons later, in 1988. A 9th place finish, in 1988-89, is to this day Lecce’s highest placement. But after a three-season spell in the first division they were relegated again, in 1991. They won promotion again in 1994, but finished dead last with only 11 points in 1993-94. Back-to-back relegations saw Lecce in Serie C by 1996. Then back-to-back promotions put Lecce back in Serie A in 1997, for their fourh spell in a 13-year period. Lecce were relegated once again the following season (in 1998). Lecce bounced right back to Serie A the next year, and had another 3-year stint in the top level. That takes us to 2002. 2003 saw Lecce back in Serie A (their sixth spell in the top flight). For the third time, Lecce had a 3-season run in Serie A, and were relegated in 2006. A two-year stint in Serie B ensued, with promotion to Serie A in 2008. Relegation in 2009. Promotion in 2010. So in August, 2010, Lecce will thus begin their 8th spell in Serie A in just 25 years.
Lecce’s kit {US Lecce 10/11 kits, here (Football Shirt Culture.com)} features their retina-searing red-and-yellow-vertical-striped jerseys, which are subtly balanced off by dark royal blue pants, and a classy wolf-and-fruit-tree-in-gold-on-a-navy-shield as their crest. Only Italians could pull off red and yellow stripes and not look clownish (Ghana national team away kit notwithstanding).
Lecce dew only 12,171 per game for their last season in Serie A, in 2008-09. But during their previous 3-season spell before that, from 2003-04 to 2005-06, Lecce were drawing in the low 16,000 to high 15,000 range. So it looks like Lecce supporters are tiring of the club’s perpetual comings and goings to and from the top flight. Lecce’s stadium, the Stadio Via del Mare, capacity 33,876, has a running track. Ugh. On the map page, take a look at the middle photo of Lecce’s stadium, and that yawning gap between the stands and the pitch.
…
Second place in the 2009-10 Serie B was Cesena. This makes back-to-back promotions for Cesena. AC Cesena are from the small city of Cesena (population, 95,000 [2009 figure}), which is in the Emilia-Romagna region of northern Italy, 15 km. (9 miles) from the Adriatic Sea coast. Which makes me wonder why they have a seahorse in their crest, seeing as how Cesena is not actually a coastal city. Cesena drew 11,272 per game last season, which was second best in Serie B [Torino drew highest in the Italian second division. 2009-10 Italian attendance figures here (E-F-S site)]. Here is an article on Cesena’s promotion, from SoccerLens.com, ‘Cesena’s Fairytale’, by GT (2nd June, 2010).
Cesena play in the 23,860-capacity Stadio Dino Manuzzi, which is unusual for a municipal stadium in Italy in that it has no unsightly and atmosphere-deadening running track. I find it ironic that this part of Emilia-Romagna (the eastern, Romagna half), which has very little history of top-flight football, has built a municipal stadium that is pretty decent and has no running track. After all, Italy is the land of the running track stadium (rivaled only by Brazil for that dubious distinction). In Italy, it is often the case that the city, not the football club, owns the stadium. Fine. [16 of the 17 stadiums in Serie A this coming season are municipally-owned, with the exception being Rome's Stadio Ilimpico, and that is owned by the Italian National Olympic Committee.] But that is no excuse for all the god-awful running tracks ruining the atmosphere at top-flight Italian football matches. Why on earth are running tracks so necessary ? Where is the mass audience for track and field ? And it’s not like Italy has a great track-and field tradition. I mean how often do you ever see an Italian win a medal in the Summer Olympics in track and field, for crying out loud ? How on earth can the capital, Rome, allow a situation where it’s two first division clubs, AS Roma and SS Lazio, play on stadium with a running track ?
OK, digression here…here are the track and field medals from the 2008 Beijing Summer Olympics {click here (ESPN)}. As you can see, I am totally wrong on this, because Italy won a gold medal in race walking. So you see, it was all worth it to ruin the atmosphere in virtually half the Italian top flight football matches, for about 70 years, by having facilities with running tracks. Because there is nothing more prestigious than winning an Olympic gold medal in race walking. They don’t call race walking the Beautiful Stroll for nothing.
…
Third place in the 2009-10 Serie B went to Brescia. Brescia Calcio are from Brescia, Lombardy, a city of around 190,000, 82 km. (51 miles) east of Milan. Brescia are back in the top tier for the first time since 2005, which was one year after legendary Italian international Roberto Baggio retired. He had turned his back on the limelight and pressures of Milan club football (with stints at AC Milan and at Inter), to happily play out the tail end of his career for Brescia, a small and up to that point unfashionable club in the foothills of the Alps.
Here is a nice Youtube video, by iiFAZZA10 – ’10 piu bei gol di (10 beautiful goals of) Roberto BAGGIO’ [note: numbers 10, 8, 5, 3 and 2 are from Baggio's Brescia days] {click here}].
Circa 2000 to 2004, Baggio basically kept Brescia up in Serie A (Baggio scored 45 goals in 95 games for Brescia), to the point where they became popularly known as “Baggio’s Brescia”, and when he exited, the modestly supported club went straight back to Serie B the following season. Brescia were averaging in the 7,000s, in Serie B, a decade ago, and were drawing in the 15-17,000 per game range when Baggio was there, from 2000 to 2004. The club has an even smaller fan base now, averaging only 3,937 per game last season (and drew only 2,996 in 2008-09), but, like Bari and Parma last year, Brescia will probably see a large increase in attendance for their return to Serie A.
Bescia’s stadium. Stadio Mario Rigamonti has an actual capacity of 27,592, but it’s current capacity has been restricted to 16,308 (that will probably change to a higher capacity now that Brescia are back in Serie A). The stadium originally had a running track, but it was removed and grass was planted there. However, seats still remain very far away from the pitch.
…
For the 2010-11 Serie A season, there are 8 stadiums with running tracks, and 9 clubs playing on pitches poisoned by running tracks… Roma, Lazio, Catania, Lecce, Bari, Napoli, Bologna, Chievo Verona, and Udinese. And although the putrid orange track itself is gone at Brescia’s stadium, the huge gap between seats and pitch remains, so you would have to lump Brescia in with the other 9 running-track-afflicted clubs. By way of comparison, for the 2010-11 La Liga season in Spain, there are 3 clubs who must play on pitches ringed by running tracks, UD Alméria, RCD Mallorca, and Real Sociedad. In England, not a single Premier League stadium has a running track, and this has been the case for years. In fact, you would have to go all the way down to the Conference National, which is the 5th Level in the English football league system, to find a club playing on a pitch with a running track (the Welsh club Newport County) [note: Rotherham United and Brighton & Hove Albion play at stadiums with running tracks, but in both cases these clubs (from League Two and League One, respectively) are playing there because of stadium problems, and next season Brighton will move into a new, running track-free stadium].
Hats off to the people running things in Palermo, Cagliari and Florence (Fiorentina), because these three clubs play in stadia where the local authorities had the good sense to remove the the running tracks and build stands closer to the pitch. Heck, the folks in Palermo figured this out way back in the late 1940s, because the Stadio Renzo Barbera there had it’s running track removed and stands built closer to the pitch in 1948. Why the people who run the other Italian municipalities which have top flight representation have never seen fit to do the same for their stadiums is beyond me. Italian calcio fans deserve better than this.
-
Thanks to the contributors to the pages at en.wikipedia.org and it.wikipedia.org, 2010-11 Serie A. Thanks to Eric Gaba. aka Sting, for the brilliant blank topographic map of Italy, ‘Sting’- location maps at Wikimedia.
Thanks to European-Football-Statistics.co.uk, for the attendance figures, E-F-S site. Thanks to Soccerway.com, for the final table.