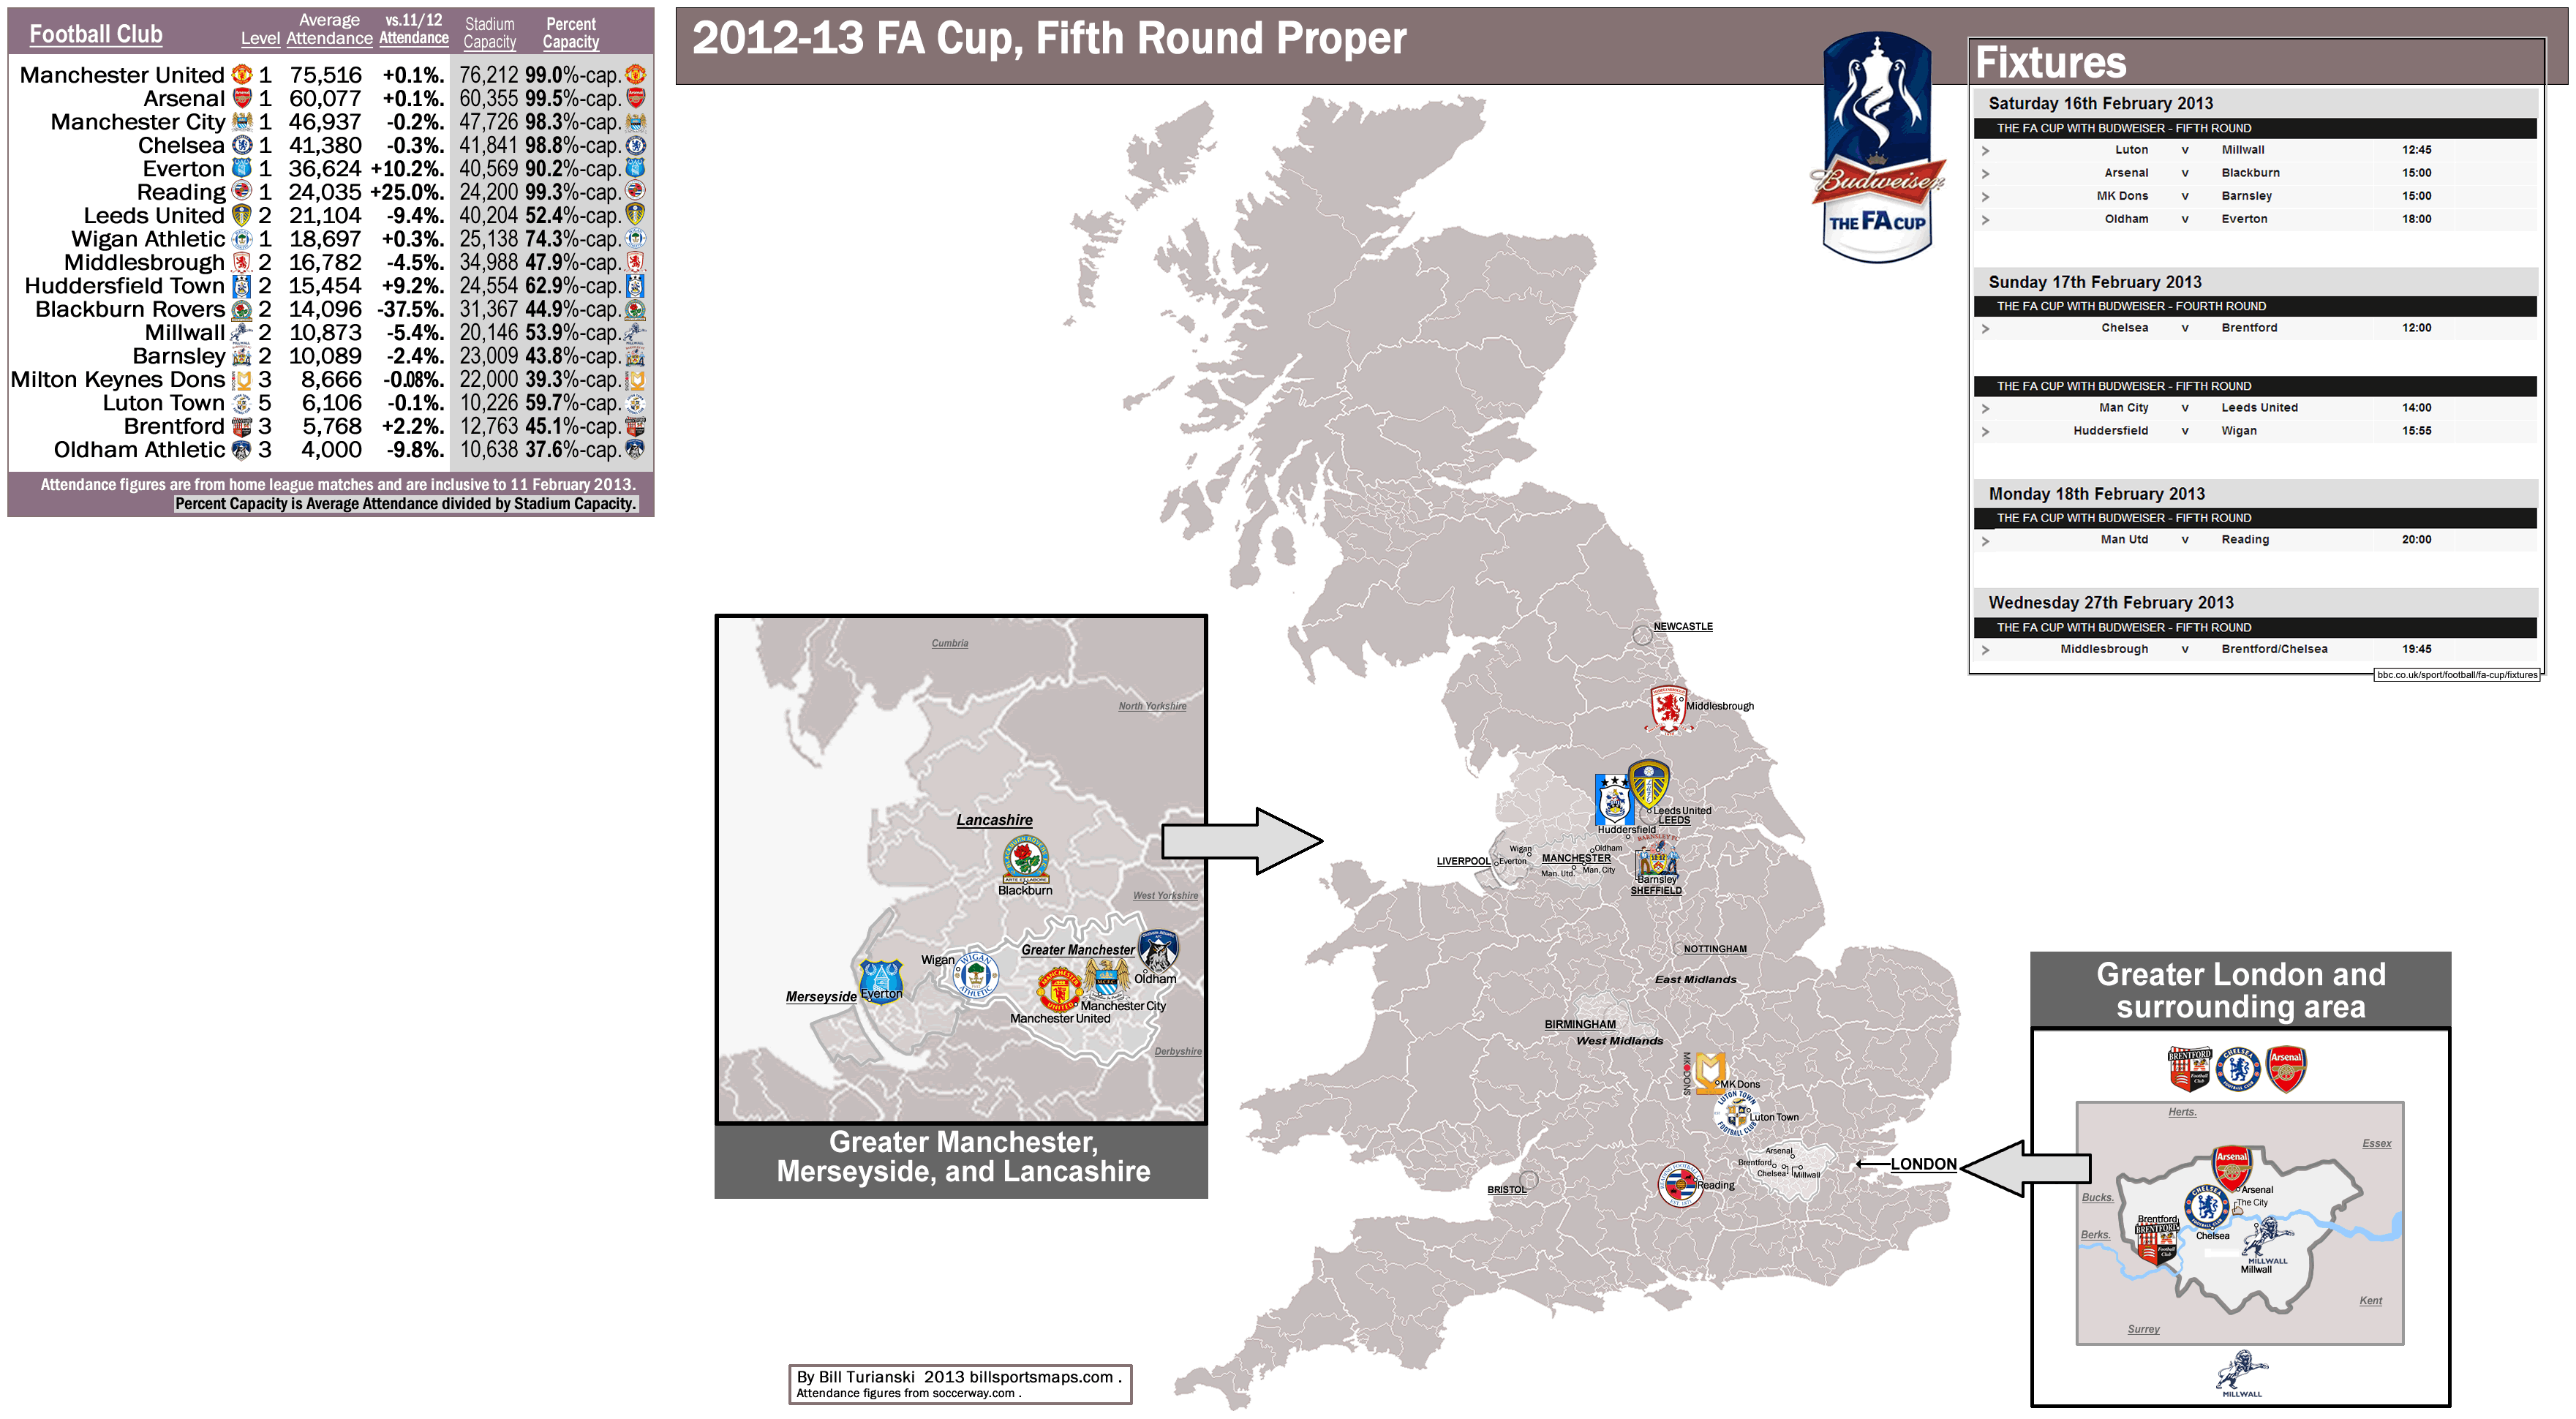
2012 Major League Baseball average attendance map
…
…
Please note: to see the most recent MLB paid-attendance map-and-post, click on the following: category: Baseball >paid-attendance.
…
On the map, which you can see in full by clicking on the image above, a photo of each ball club’s 2012 home ball cap is sized to reflect 2012 gate figures…the higher the team’s average attendance, the larger the team’s ball cap is on the map. At the right on the map page are the 30 MLB teams (with their 2013 home cap crest), listed by 2012 attendance rank. Three extra stats for each team are included at the far right-hand side of the map page – Percent-Change from 2011 attendance, Stadium Seating Capacity, and Percent-Capacity [percent-capacity is arrived at this way...average attendance divided by stadium capacity equals Percent-Capacity]. As was the case in 2011, again last season (2012), two teams played to a cumulative percent-capacity of above 100% – the Philadelphia Phillies and the Boston Red Sox. That did not necessarily mean they sold out every game though, as MLB stadiums are allowed to issue Standing Room Only (SRO) tickets and that is the norm at Fenway Park in Boston and at Citizens Bank Ballpark in Philladelphia (the San Francisco Giants are also issuing a good deal of SRO tickets these days). So in practical terms, when you know that a league allows for overflow/SRO tickets and you see a percent-capacity figure of, say, 100.4%-capacity, what that number is most likely telling you is that a certain amount of the games were totally sold out plus had a couple hundred or so standing-room-only ticket-buyers; and a certain amount of the games came very close to being sold out at around 98 or 99%-capacity. That is what is happening most recent seasons with both the Phillies (for the last 4 seasons {since 2009}) and with the Red Sox (for the past 10 seasons now {since 2003}). It is just that one of those two teams is pretending they actually sell out every game (see below).
…
-
The MLB teams that fill their ballpark the best
(The top 5 percent-capacity figures for 2012) -
#1., at 100.8 percent-capacity – the Philadelphia Phillies. Citizens Bank Ballpark, Philadelphia, Pennsylvania.
In 2012 the Phillies averaged 44,021 per game, and they led the Major Leagues in average attendance for the second straight season.
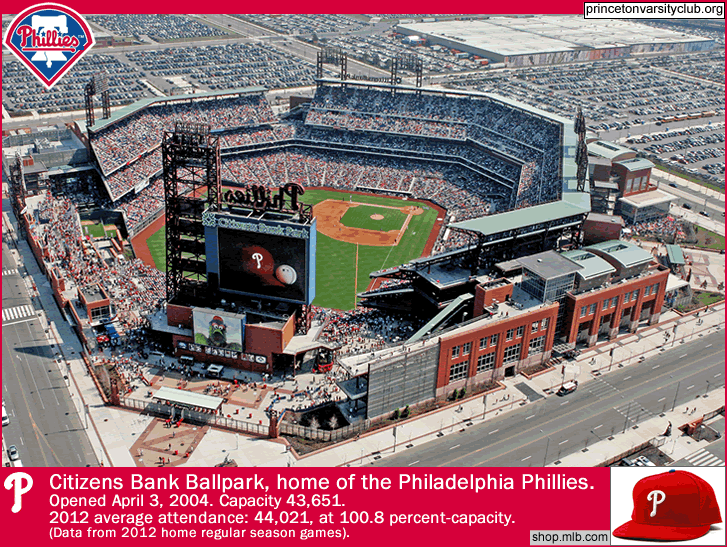
Photo credits above –
princetonvarsityclub.org.
shop.mlb.com.
…
#2., at 100.4 percent-capacity – the Boston Red Sox. Fenway Park, Boston, Massachusetts.
The Red Sox averaged 37,567, which was 8th highest in Major League Baseball in 2012.
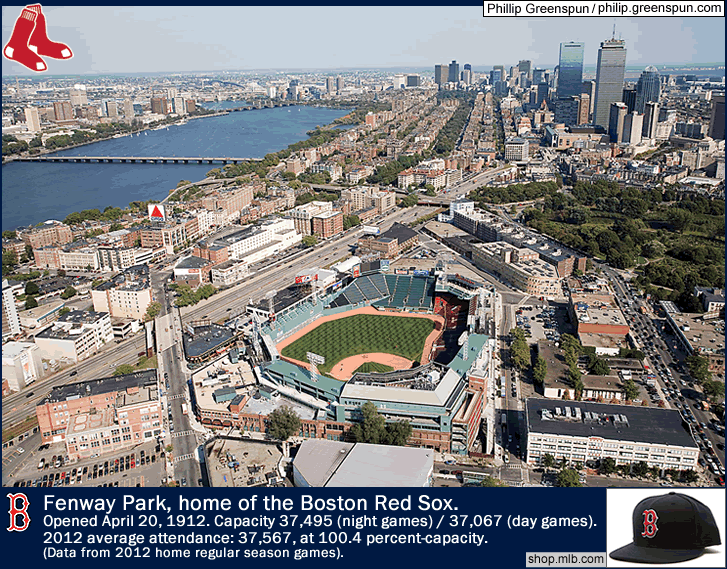
Photo credits above –
Phillip Greenspun / philip.greenspun.com.
shop.mlb.com.
The Red Sox have officially had a current sold-out streak of over 780 straight games but that claim is bogus because the Red Sox ticket office has been manipulating the concept of “sold-out” for a while now. True, the Red Sox do cumulatively draw above 100 percent, with standing-room-only the norm at most of their games at Fenway, and Boston has been drawing above 100% of seated capacity since 2003. But in recent seasons, some games, especially in the early-season (ie, cold weather games) are not completely sold out even if the Red Sox ticket office is giving away some tickets at the last minute. The following article from May 2012 flatly refutes the idea that the Red Sox’ home game sold-out streak is still alive… from boston.com, from May 4, 2012, by Bob Holher and Seth Lasko, ‘Red Sox sellout streak a real numbers game‘. In an early May 2012 game at Fenway, the reporter is at the Red Sox ticket booth when the box office is closing…{excerpt from the article linked to above}…’The correspondent saw the window clerk give away four more tickets moments after he received his. He then checked with the clerk just before the booth closed at 9:35 p.m. and was told that tickets remained unsold.’… {end of excerpt}.
Below, a photo of some of the crowd art a supposedly “sold out game” at Fenway Park in Boston in early May 2012…
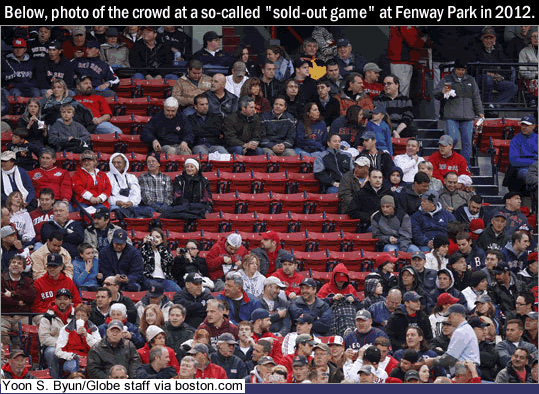
Photo credit above – Yoon S. Byun/Globe staff via boston.com.
…
#3., at 99.4 percent-capacity – the San Francisco Giants. AT&T Park, San Francisco, CA.
The 2012 World Series Champions San Francisco Giants averaged 41,695, which was 4th highest in Major League Baseball in 2012.
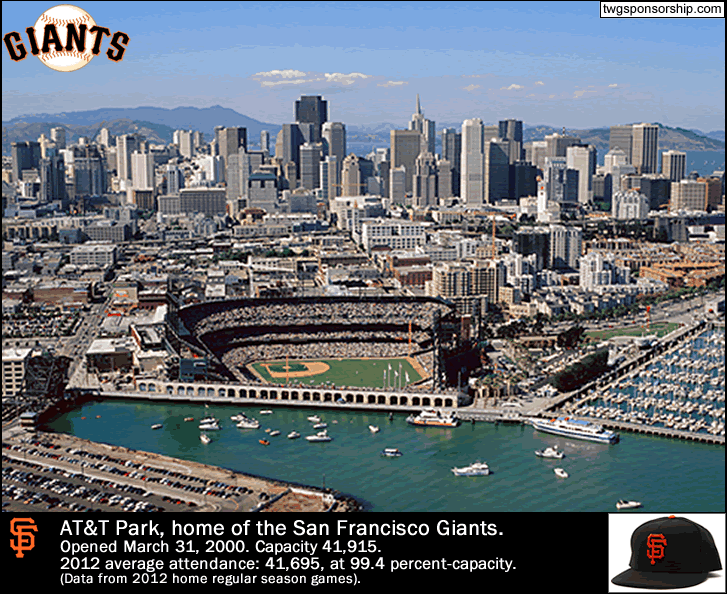
Photo credits above –
twgsponsorship.com/att-park.
shop.mlb.com.
…
#4., at 91.5 percent-capacity – the St. Louis Cardinals. Busch Stadium (III), St. Louis, Missouri.
The Cardinals averaged 40,272, which was 6th highest in Major League Baseball in 2012.
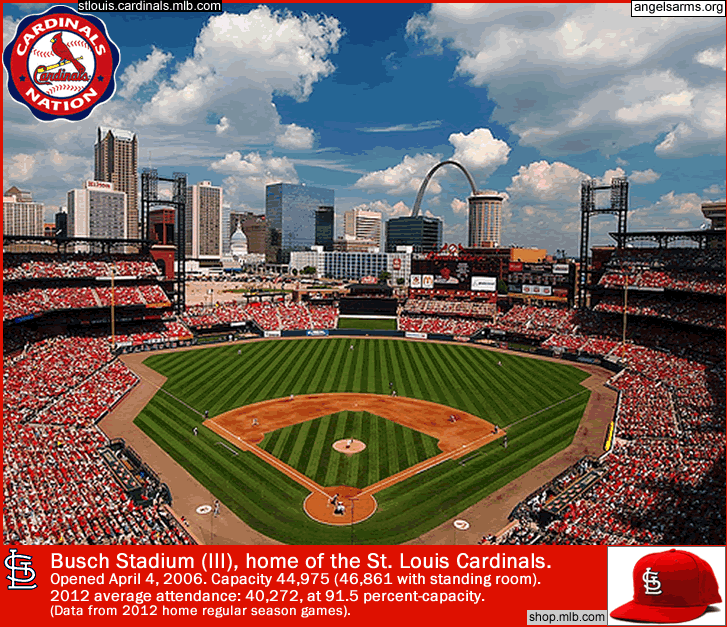
Photo and Image credits above -
angelsarms.org.
Cardinals Nation logo from stlouis.cardinals.mlb.com.
shop.mlb.com.
…
#5., at 90.6 percent-capacity – the Detroit Tigers. Comerica Park, Detroit, Michigan.
The Tigers averaged 37,383, which was 9th highest in Major League Baseball in 2012.
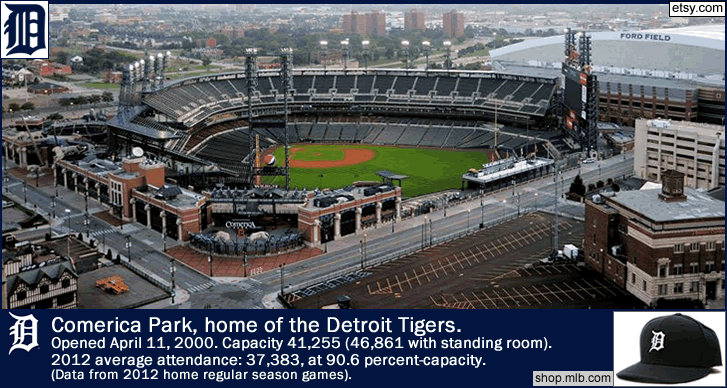
Photo credits above –
etsy.com.
shop.mlb.com.
___
Thanks to the contributors to the pages at en.wikipedia.org, ‘Major League Baseball‘; and at the Ballparks of Baseball.com site, for ballpark capacity numbers.
Thanks to ESPN site for 2012 and 2011 attendance figures.
Thanks to mlb.com/shop for 29 of the MLB teams’ home cap photos.
Thanks to sportsstation1.com for the photo of the Baltimore Orioles’ home cap.