billsportsmaps.com

April 16, 2017

Australia, National Rugby League: NRL attendance chart for 2016 regular season (with 2016 finishes listed)/+ the Cronulla-Sutherland Sharks (1st title) – the 2016 NRL Premiers (champions).

Filed under: Australia,Rugby,Rugby>Australia — admin @ 7:51 pm

Links…
-Official site… nrl.com.
-2017 season (teams, etc)… 2017 NRL season (en.wikipedia.org).
-Australia’s leading sports opinion site’s rugby league page… theroar.com.au/rugby-league.
-The bums on seats truth about the NRL draw (by Jason Hoskins on Oct. 27 2016 at theroar.com).

-My map-&-post of NRL (May 2015), featuring location-maps of NRL teams, plus an article: History of First Division Rugby League in Australia (1908 to 2014) [including the Super League war of the late 1990s],
Australia (and New Zealand): National Rugby League (NRL) – 2015 location-map(s) with attendance-&-titles-chart.

By Bill Turianski on 16 April 2017; twitter.com/billsportsmaps.

australia_nrl_rugby-league_2016-attendances-and-finishes_chart_c_.gif
Chart by billsportsmaps.com/attendance figures from afltables.com/[2016 NRL attendance].


    Cronulla-Sutherland Sharks: 2016 NRL Premiers (champions)…

The Cronulla-Sutherland Sharks were established as an NRL expansion-team in 1967. In the Sharks’ 50th season, in 2016, they won their first NRL premiership (title). Cronulla-Sutherland’s 50-season title-drought was the longest ever, in Australian rugby league history (since 1908/ List of Premierships, here). Below is Cronulla, in Sutherland Shire, which is a local government area in the southern part of Greater Sydney, New South Wales, Australia. Further below is action from the 2016 NRL Grand Final (Cronulla-Sutherland Sharks 14, Melbourne Storm 12)…
cronulla-sutherland-sharks_endeavour-field_shark-park_southern-cross-group-stadium_woolooware_greater-sydney_australia_2016-nrl-champions_i_.gif

cronulla-sutherland-sharks_grand-final_champions_october-2-2016_stadium-australia_sydney_h_.gif

Photo and Image credits above -
Aerial shot of Cronulla by 1908cronulla.com.au. Endeavour Field, photo unattributed at forum.insidesport.com.au. Endeavor Field at night, photo unattributed at austadiums.com. Sydney neighborhoods, map from mapaplan.com via mapsontheweb.zoom-maps.com/areas-of-sydney.

Cronulla & Melbourne kit illustrations, from en.wikipedia.org/wiki/2016_NRL_Grand_Final. Screenshot of Cronulla fans at Grand Final, image from video uploaded by Rugby League/Union at youtube.com. Ben Barba, photo from smh.com.au/photogallery/sport/action-from-2016-grand-final-melbourne-storm-versus-cronullasutherland-sharks. Screenshot of Jesse Bromwich scoring a try, image from video uploaded by Rugby League/Union at youtube.com. Will Chambers scoring try to give Melbourne the lead, photo unattributed at skysports.com. Andrew Fifita, breaking tackles, photo by Photosport via radionz.co.nz/news/sport/cronulla-sharks-win-nrl-grand-final. Andrew Fifita about to score the match-winning try, photo unattributed at dailytelegraph.au/sport. Andrew Fifita scoring the match-winning try, photo by John Veage via theleader.com.au. Cronulla’s trophy-celebration at Endeavour Field the following day, with captain Paul Gallen and Man-of-the-Match-winner Luke Lewis holding the trophy aloft, while Sharks fans cheer behind them, photo by Greg Porteus at couriermail.com.au/sport.

___
Thanks to the contributors at National Rugby League (en.wikipedia.org).
A Big Thanks to afltables.com/[2016 NRL attendance], for the pretty-hard-to-find NRL attendance figures.

March 25, 2016

Australia, National Rugby League: NRL attendance chart for 2015 regular season (with 2015 finishes listed)/+ the North Queensland Cowboys – 2015 NRL champs (their first title) & 2016 World Club Championship winners.

Filed under: Australia,Rugby,Rugby>Australia — admin @ 11:27 am

Links…
-Official site… nrl.com.
-2016 season (teams, etc)… 2016 NRL season (en.wikipedia.org).
-Australia’s leading sports opinion site’s rugby league page… theroar.com.au/rugby-league.

-My map-&-post of NRL from May 2015,
Australia (and New Zealand): National Rugby League (NRL) – 2015 location-map with a chart which shows…2014 attendances by club, club colours & crests, and titles (Premiers) won by club./ Plus an article on the history of pro Rugby League in Australia./ Plus illustrations for 2 clubs; the highest-drawing rugby club in the world (the Brisbane Broncos) & the reigning RL champions of Australia and the World (the South Sydney Rabbitohs).

By Bill Turianski on 25 March 2016; twitter.com/billsportsmaps.

    Australia, National Rugby League: NRL attendance chart for 2015 regular season (with 2015 finishes listed)

australia_nrl_2015_chart_attendances_2015-ladder_finals_e_.gif
Source for 2015 NRL attendance figures: afltables.com/rl/crowds/2015 (AFL Tables site/NRL).


    4 October 2015:
    2015 NRL Grand Final, at ANZ Stadium in Sydney, New South Wales. Attendance: 82,758.
    The first all-Queensland rugby league Grand Final. North Queensland Cowboys 17, Brisbane Broncos 16 (Golden Point).

Here is a 4:38 video of highlights of the matchNRL Grand Final 2015 Cowboys vs. Broncos Match Highlights (uploaded by Premier Sports at youtube.com).
Below: Townsville, Queensland, Australia, metro-area population: 178,000 {2014 estimate}. Townsville is home of the NRL’s North Queensland Cowboys, and is the smallest city in Australia with a major-league team. So I guess that makes the North Queensland Cowboys like the Green Bay Packers of Australia :-)
townsville-queensland-australia_north-queensland-cowboys_13000smiles-stadium_b_.gif

2015-nrl-grand-final_north-queensland-cowboys-17_16-brisbane-broncos_-jonathan-thurston_d_.gif
Photo credits above -
Aerial view of Townsville, QLD, photo by Tourism and Events Queensland at queensland.com/destination Townsville. Shot of waterfront from hotel balcony in Townsville, photo by Nicole at bittenbythetravelbug.com/what-to-do-in-townsville-australia. View of Townsville at night, photo by Geoff Beck at redbubble.com/townsville-queensland-australia-at-night-capital-of-far-north-queensland-poster. Aerial view of North Queensland cowboys home venue – Willow Sports Centre (aka 13000Smiles Stadium), photo by liney_2000 at panoramio.com.

Cowboys & Broncos fans mugging for the camera outside ANZ Stadium prior to the 2015 Grand Final – showing that Queensland pride trumps their teams’ rivalry, photo by AAP Images via dailymail.co.uk. North Queensland fans at Grand Final with Jonathan Thurston banner, photo by AAP Images via dailymail.co.uk. Screenshot of 2015 NRL Grand Final opening kick-off, images from video uploaded by Premier Sports at youtube.com, NRL Grand Final 2015 Cowboys vs. Broncos Match Highlights. Two seconds before the final whistle, North Queensland FE Michael Morgan flicks a short outside pass to RW Kyle Feldt, who scores as time expires to even the score at 16-16, screenshot of image uploaded by Premier Sports at youtube.com, NRL Grand Final 2015 Cowboys vs. Broncos Match Highlights. Morgans crucial offload, photo unattributed at the [Brisbane] Courier Mail, couriermail.com.au/michael-morgans-calmness-key-to-setting-up-kyle-feldt-try-in-nrl-grand-final. North Queensland RW Kyle Feldt scores a try as time expires (80′), but the extra point is missed, sending in the game into extra time, photo by Cameron Spencer/Getty Images AsiaPac via zimbio.com.
Jonathan Thurston (top scorer for 2015 Cowboys/2015 Grand Final MVP), about to kick the winning field goal in extra time, photo by Getty Images via dailymail.co.uk. The following day (Monday, 5 October 2015), at the Cowboys’ stadium in Townsville, 15-thousand-strongNorth Queensland fans celebrate their team’s triumph; Co-captains Matthew Scott and Man of the Match-winner Jonathan Thurston (in shades with medal) hold the trophy, photo by Ian Hithcock/Getty Images via stuff.co.nz/Triumphant-NRL-champions-North-Queensland-Cowboys-return-to-Townsville. Illustration of North Queensland Cowboys 2015 season, illustration by leagueunlimited.com at 2015 in review – North Queensland Cowboys.
___
Thanks to the contributors at National Rugby League (en.wikipedia.org).
A Big Thanks to afltables.com, for the pretty-hard-to-find 2015 NRL attendance figures.

June 8, 2015

England, second division rugby league, 2015 RFL Championship (aka Kingstone Press Championship): location-map with all-time English RL titles list; plus a preview of the new Super 8s promotion/relegation play-off mini-league.

Filed under: Rugby,Rugby>England — admin @ 5:12 am

2015_rugby-league_england_2nd-division_kingstone-press-championship_map_w-rl-titles-list_post_f_.gif
English RL 2nd div map 2015


Links…
-New competition structure explained, rugbyleaguechampionships.co.uk/['2015 - A New Era'] [from the Official site].
-Teams, etc…2015 RFL Championship (en.wikipedia.org).
-Fixtures, results, table(s), etc…rugbyleaguechampionships.co.uk/match_day/fixtures [Official site].
-BBC.com’s rugby league page/results (which includes 2nd div RL attendance figures for most matches), bbc.com/sport/rugby-league/championship/results.
-A good RL site is Total RL.com, and here is their page on 2nd division English RL…totalrl.com/category/kingstone-press-championship.
-Another good RL site is Love Rugby League, and here is their page on 2nd division English RL…loverugbyleague.com/championship.
-My most-recent map & post on 1st division English RL (from Feb. 2015),
Rugby League: 2015 Super League XX location-map, with all-time English RL titles list & attendance figures from 2014./ Plus a season-preview article on 2015 Super League XX, written by James Nalton./ Plus illustrations of the 4 semifinalists from last season, including 2014 champions St Helens RLFC (billsportsmaps.com).

    England, second division rugby league, 2015 RFL Championship (aka Kingstone Press Championship): location-map with all-time English RL titles list; plus a preview of the new Super 8s promotion/relegation play-off mini-league

By Bill Turianski on 8 June 2015; twitter.com/billsportsmaps.com.
The 12-team second division in rugby league in the United Kingdom, called the Kingstone Press Championship for sponsorship reasons, is pro/semi-pro; attendances range in the ~500-to-2.5-K-per-game range, with an average crowd size of around 1.2 K or so. (Last years’ average crowd figure is unavailable, however 2 years ago in 2013 the average crowd size was 1,199 {see this}.)

The 1st division in English RL draws similar crowd-sizes to the 3rd division in English football;
while the 2nd division in English RL draws similar crowd-sizes to the 5th division in English football…

A convenient way of getting a picture of what crowd-sizes tend to be in the top two tiers of English rugby league is to compare it to English football attendances within the English football pyramid. So, from current and recent figures (from 2013, 2014, 2014-15)…the 1st division in English rugby league (Super League) is akin to Football League One [the 3rd division] in terms of crowd-size (~7-to-9-K per game range of league averages); while the 2nd division in English rugby league is akin to the Non-League football Conference National [the 5th division] in terms of crowd-size (~1.1-K-to-1.9 K per game range of league averages). (Figures {& sources}: 2014 Super League avg total attendance: 8,153 {source} versus 2014-15 Football League One avg total attendance: 7,043 {source} ; 2013 RFL Championship avg total attendance: 1,199 {source} versus 2014-15 5th div Non-League football avg total attendance: 1,855 per game {source}.)

There are some recent exceptions, such as the 7.4 K that Leigh Centurions drew on the 2015 season opener (versus newly-relegated Bradford Bulls). [Bradford Bulls probably had well over 1 K traveling fans cross the Pennines to attend; the distance between Leigh in western Greater Manchester and Bradford in West Yorkshire is 73 km (or 45 mi) by road.] It just so happens that there is an excellent write-up (with gallery of photos) from that match (which Leigh won 36-24), at the awesome site known as The Onion Bag – Travels around Non League Football & Rugby League Grounds…
Leigh Centurions – Sunday 15th February 2015. Kingstone Press Championship. Leigh Centurions 36 Bradford Bulls 24. Atten 7499 (onion-bag.blogspot.co.uk).

Attendances will almost certainly increase in the English RL 2nd division this year, because of the re-introduction of promotion/relegation into the format…
[Note: very first link at the top of this post has the official site's page on the new format, again, here.}
Basically, the new format, which has re-introduced promotion/relegation, will see some 2nd division matches with attendance increases, especially come August and September 2015, after the 23rd game, once the season morphs into the Super 8s, when the top four 2nd division clubs get re-grouped with the bottom 4 Super League clubs. Those 8 teams then fight it out in what is essentially a 7-match round-robin mini-league...with the 4 best from that set-up earning the right to play in the 1st division in 2016 (Super League XXI), and with the 4 worst from that set-up being placed in the 2nd division for 2016.

{For a more detailed description, see this excerpt from Wikipedia, ..."Following the split into the Super 8's, the top four teams in the Championship 2015 will join the bottom four teams of the Super League 2015 in "The Qualifiers". This group will see each team play each other once each, totaling seven extra games, with points reset to zero for the qualifiers. After 7 extra rounds the top 3 teams will earn a place in the Super League competition for 2016, thus either retaining or earning a place in the top competition. The teams finishing 4th and 5th in the qualifiers will play off in an extra fixture, at the home of 4th, for the final place in the 2016 Super League competition. The loser of this fixture, along with teams finishing 6th, 7th, and 8th in the qualifiers will either remain or be relegated and will play in the Championship in the 2016 season."...{end of excerpt from 2015 RFL Championship at en.wikipedia.org}.

In other words, with the new RL set-up in England, as many as 4 but as few as zero 2nd division clubs can gain promotion to the top flight.

Below: Leigh Centurions, who sit first in the second tier as of 6 June 2015...
leigh-centurions-r-l-c_leigh-sports-village_2015_a_.gif
Photo credits above -
Aerial photo of Leigh Sports Village by Leigh Centurions RLFC, at leighcenturions.com/club/contact.
Action photo from 15 Feb. 2015 (Leigh 36, Bradford 24), photo by Onion-Bag.blogspot.com at onion-bag.blogspot.co.uk/2015/02/leigh-centurions.html; and at onion-bag.blogspot.co.uk/2015/02/leigh-centurions.html.

So, come mid-August, who will be in the 2015 Super 8s promotion/relegation mini-league?
...Note: below is a brief look at the tables from 8 June 2015 (or after about three-quarters of the regular seasons have been played [~15 to 17 games-played per team])…
2nd div teams…
-{Here is the RL 2nd div/Championship table (bbc.com)}.
Two-time national RL champions Leigh Centurions and 6-time-champions the Bradford Bulls sit even on 28 points (14-1/ with Leigh having a better points-difference of 365 [v 360 p-d for Bradford]). Leigh were undefeated prior to their surprise loss on 7 June away to London Broncos. Some observers feel Leigh look like the best of the second tier by a considerable margin, but meanwhile, Bradford’s’ objective of bouncing straight back to Super League remains on-course. Leigh and Bradford are now virtual locks to make it to the Super 8s round. As to the other two teams who will qualify for the promotion/relegation/ mini-league, it is starting to look like the 3rd spot will go to the Sheffield Eagles, with the fourth spot being a toss-up between the Dewsbury Rams, Halifax RLFC, and Featherstone Rovers, with London Broncos now looking to also have a chance of squeaking in. The London Broncos (aka the formerly-worst-drawing 1st div English RL club) are now poised to move up the table, because they play hapless and winless Doncaster RLFC next Sunday the 14th of June.

1st div teams…
-{Here is the RL 1st div/Super League table}
(Leeds Rhinos lead the table at 12-1-4 with St Helens and Wigan 1 and 2 points behind respectively.}

As far as which 4 basement dwellers from the 2015 top tier will join the top 4 of the second tier, well, if you look at the current Super League table, you will see that the now-lowest-drawing 1st div English RL club, the Wakefield Wildcats (who drew ~4.3 K per game in 2014) look to have all but guaranteed that they will be fighting for their top-tier existence in the Super 8s come August and September. Wakefield have just 2 wins after 16 games, and are 14 points from safety. The other 3 that will be joining Wakefield in the promotion/relegation Super 8s is still very uncertain, but if the season were to end today, it would be: Salford, Hull KR, and Widnes. However, 5 more clubs are not by any means safe yet (Catalans, Hull FC, Castleford, Warrington, Huddersfield).

The 2nd Division in English RL is currently comprised of the following…
Currently [2015 regular season/Feb-to-July], of the 12 teams in the RL 2nd division in the UK, 11 are from the north of the England, with the exception being the London Broncos (whom were relegated in 2014, along with Bradford Bulls). So, just like in the first division in RL in the UK (Super League), the second tier is currently is comprised almost completely of rugby league clubs from the historical ceremonial counties of Yorkshire and Lancashire, but also in the second tier currently there are two clubs from Cumbria in the far northwest of England (Workington Town and Whitehaven), and as recently as 2014 there was representation from the north of Wales (the North Wales Crusaders, who were relegated to the 3rd division last year [2014]).

In 1895, a split in Rugby football created the two codes…
History of rugby league/The schism in England (en.wikipedia.org).
In 1895, a split in Rugby football created the two codes (pro Rugby League to the North / amateur Rugby Union to the South). This resulted in the formation of the Northern Rugby Football Union, which was of course the precursor to Super League rugby (est. 1996), in particular, and was also the precursor of all Rugby League leagues in general.

The list below shows which of the 22 founding Rugby League clubs who formed the NRFU (for the 1895-96 season) are currently in the 2nd Division as of 2015 (5 clubs)…
Batley RLFC (est.1880).
Bradford FC * (est. 1863/ re-est. 1907 as Bradford Northern RLFC/see note below).
Halifax RLFC (est. 1873).
Hunslet RLFC (est. 1883).
Leigh RFC (est. 1878).
*Note:
*Bradford FC played rugby (and later on by 1879 also played cricket) in the 1863 to 1906 time period. In 1907 the club was split in 2 branches:
1). An association football club, Bradford Park Avenue AFC.
2). A rugby league club, Bradford Northern, which joined the 1907-08 Northern Rugby Football Union (their name was later changed to Bradford Bulls RLFC, in 1996.)

Title-winning clubs currently in the RL second division...
[Source for the list below, Rugby Football League Championship/League Leaders and Champions; Super League/Super League Champions (en.wikipedia.org).]

7 of the 12 clubs currently in the RL second division have won national English RL titles:
Bradford Northern/Bulls (with 6 titles, last in 2005),
Halifax RLFC (with 4 titles, last in 1985-86),
Leigh Centurions (with 2 titles, last in 1981-82),
Hunslet Hawks (with 2 titles, last in 1937-38),
Featherstone Rovers (with 1 title in 1976-77),
Workington Town RLFC (with 1 title in 1950-51),
Batley Bulldogs (with 1 title in 1923-24).
___
Thanks to the contributors at 2015 RFL Championship (en.wikipedia.org).
Thanks to D-maps.com, for blank map of the UK, http://d-maps.com/pays.php?num_pay=218&lang=en.

May 11, 2015

Australia (and New Zealand): National Rugby League (NRL) – 2015 location-map with a chart which shows…2014 attendances by club, club colours & crests, and titles (Premiers) won by club./ Plus an article on the history of pro Rugby League in Australia./ Plus illustrations for 2 clubs; the highest-drawing rugby club in the world (the Brisbane Broncos) & the reigning RL champions of Australia and the World (the South Sydney Rabbitohs).

Filed under: Australia,Rugby,Rugby>Australia — admin @ 6:32 pm

australia_nrl_rugby-league_2015-location-map_w-titles_2014-attendances_post_h.gif
Australia (and New Zealand): National Rugby League, 2015 location-map with 2014 attendances and titles listed


Links…
-Teams…National Rugby League/ Current clubs (en.wikipedia.org).
-Live scores, schedule, table…livescores.ninemsn.com.au/nrl.
-NRL at LoveRugbyLeague.com…loverugbyleague.com/nrl.
-Official site of NRL…nrl.com.

    Australia (and New Zealand): National Rugby League (NRL) -
    2015 location-map with a chart which shows…2014 attendances by club, club colours & crests, and titles (Premiers)

By Bill Turianski on 11 May 2015; twitter.com/billsportsmaps.

Updates…
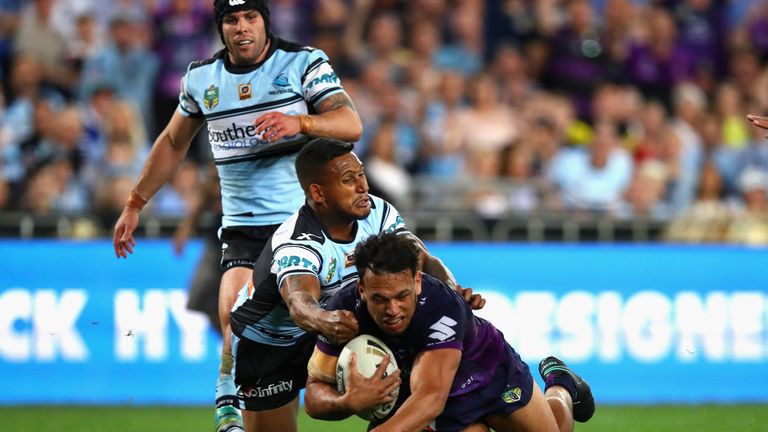
-Crowds-&-finishes chart for 2016 season of the NRL, with 2016 Premiers (champions), the Cronulla-Sutherland Sharks.
-Crowds-&-finishes chart for 2015 season of the NRL, with 2015 Premiers (champions), the North Queensland Cowboys.

Size and population of Australia…
I will start of with a brief description of the size, relative size, and population of Australia. If you click on the following link you can see, at a glance, how massive the island/Continent of Australia is when it is compared to the Continental USA, {here (aboutaustralia.com)}. (Note: that graphic can also be seen at the far-lower-left-hand corner of the map page.) As you can see in that graphic, Australia is about the same size as the Continental USA, but when you factor in Alaska (and Hawaii), Australia ends up being about 23% “smaller” than the 50 United States. Australia is the 6th-largest country on Earth, at around 7.6 million km-squared (or around 2.9 million miles-squared), which makes it about 10% “smaller” than the 5th-largest country – Brazil, and more than twice the size of the 7th-largest country – India. To put it another way, Australia is massive. It is also not very populous for its size, because Australia is only the 52nd-most-populous nation, with a population of around 23.7 million {2015 figure}. To give you an idea of how sparsely populated Australia is, it has slightly less inhabitants than the pretty-small-sized nations of Nepal, Ghana, or North Korea. {Sources of data: sizes: List of countries and dependencies by area; populations: List of countries and dependencies by population (both from en.wikipedia.org).}

The Big 5 Cities in Australia…
There are 5 major cities in Australia, 3 of which have NRL teams (Sydney [9 teams], Melbourne [1 team], Brisbane [1 team]). On the map page, in the globe-map at the far left there, I have placed those 5 cities along with their populations. Sydney is the largest city in the country, with around 4.7 million inhabitants (in the metro area/urban population/all listed here are 2013 or 2014 estimates). Melbourne is the second-city of Australia – but only just…it has a population of only about 300 K less than Sydney, at around 4.4 million. Brisbane is third-largest, at about 2.3 million; Perth is fourth at around 2.0 million; and Adelaide is fifth at around 1.2 million. The capital of Australia, Canberra (which is situated in the small Australian Capital Territory, located midway between Sydney and Melbourne) is a rather small city [but it nevertheless does have an NRL team], and is the eighth-largest Australian city, with about 411,000 inhabitants. {Sources, each city’s Wikipedia page for the most-recent population estimates, however the following link is relatively recently updated (2012 figures), List of cities in Australia by population (en.wikipedia.org).}

There are 4 football codes in Australia which have professional major leagues (the most of any country)…
There are 4 football codes in Australia (listed below with first-division 2014 league-average-attendances):
Australian rules football (1st division: AFL, which averaged 32,327 per game in 2014).
Rugby union football (1st division: Super Rugby, which averaged 16,913 per game in 2014).
Rugby league football (1st division: NRL, which averaged 15,787 per game in 2014).
Association football [aka soccer]: only pro division: A-League, which averaged 14,759 per game in 2014).
[source: http://en.wikipedia.org/wiki/2014_Australian_football_code_crowds#Attendances_by_league.]

An extremely simplified guide to the 4 football codes’ popularity in Australia…
Aussie rules football…
To simplify it in the extreme, Australian Rules Football, which originated in the 1860s in and around Melbourne in the state of Victoria, turned semi-pro when the AFL was formed in 1897. Although first division teams were not based in any of the other states and territories of the country for almost 90 years (until the 1980s and 1990s), Aussie rules football has always been hugely popular throughout all the 8 states and the 2 territories of Australia, with the exception of New South Wales (NSW) and Queensland. In and around Sydney (which is the capital of New South Wales) and in all of Queensland (including Brisbane), Australian rules football has been historically overshadowed by rugby league football. The split described in the last two sentences can be see in the map at Barassi Line (en.wikipedia.org) {that map is also at the top-left-hand-side of the map page}.

Soccer (aka association football), in Australia…
Soccer was widely shunned by many if not most Australian fans and players for decades (ie, only “Sheilas, Wogs & Poofters” played soccer, as the bigotry of the day held [circa 1950s through '80s]). Only in the last decade-and-a-half or so has soccer become a viable pro sport in Australia. And now, going into the 2010s, soccer has made significant gains in popularity, to the point that the Australian first division in soccer (the A-League) is currently drawing only marginally less than both rugby codes in the country (see list with league-attendance 2 paragraphs above above).

The 2 Rugby codes in Australia…
Rugby Union, a little over a century ago, became the major sport of the city of Melbourne and of the state of Victoria. The highest level of competition in Australia is the National Rugby Championship, although there is a higher tier that involves teams from South Africa, New Zealand, and Australia, Super Rugby.

Rugby League, a little over a century ago, became the major sport of the city of Sydney and of the state of New South Wales (as well as the major sport of Brisbane in Queensland). The highest level of competition in Australia is the National Rugby League (NRL), which has 16 teams (9 teams from New South Wales).

On the map page…
The map page is a bit complicated, owing to the Sydney-centric nature of first-division rugby league in Australia – 9 of the 16 NRL teams are from Greater Sydney (all are listed in the next paragraph), plus there are 2 more teams nearby…one team in northeast New South Wales (Newcastle Knights) and one team in the Australian Capital Territory (Canberra Raiders). So there are three maps that comprise the location-map aspect of the map page. First off, is the map at the upper center of the map page, which includes all of Australia and New Zealand, and shows the other 5 clubs in the NRL…3 teams based in Queensland (North Queensland Cowboys, Brisbane Broncos, Gold Coast Titans)), one team based in Victoria (Melbourne), and one team based in New Zealand (New Zealand Warriors).

The next map, at the lower center of the map page, shows all of New South Wales state and it features the locations of all the 9 Greater Sydney teams, plus the Newcastle team and the Canberra team. The 9 Greater Sydney-based teams are then shown in the third map at the lower right-hand part of the map page – that is an enlarged inset-map of Greater Sydney…there you can see the more precise locations of the 8 NRL teams that play all their games in greater Sydney (Manly-Warringah Eagles, Penrith Panthers, Parramatta Eels, Canterbury-Bankstown Bulldogs, South Sydney Rabbitohs, Sydney Roosters, Cronulla-Sutherland Sharks, Wests Tigers). Also shown in the Greater Sydney inset map is the team that has two locations (St George Illawarra Dragons), who play half their home games in the St George neighborhood of south Sydney and the other half of their home games in Woolongong, NSW, which is about 80 km or 50 mi south of Sydney.

The other two features of the map page are…a globe-map of Australia at the far left-hand side (featuring the 5 biggest cities in the country plus the capital); and
a chart at the upper-right-hand side which lists 4 things:
1). 2014 home regular season average attendance;
2). the year the club gained admission to the NRL or its predecessors;
3). club crests and colours;
4). Australian RL titles (aka Premiers) won by each club, with last title-year listed.

    History of First Division Rugby League in Australia (1908 to 2014)…

The path to the NRL – the first 88 years of Rugby League in Australia…
From the Wikipedia page National Rugby League/Origins and beginnings…{2 excerpts}…
…”The New South Wales Rugby League (NSWRL) ran the major rugby league competition of New South Wales from its inception in 1908 until 1994, by which time its powers had expanded to run the code nationally. Following the introduction of a new format for interstate rugby league, the State of Origin series in 1980, the decade of the 1980s brought about expansion of the NSWRL premiership, with the…addition of non-Sydney-based teams, Canberra and Illawarra in 1982.” /…”Further expansion of the league followed in 1988, with another three teams based outside Sydney introduced to the competition; the Newcastle Knights and the first two Queensland teams, the Brisbane Broncos and Gold Coast-Tweed Giants.”…{end of excerpts}.

1995…
With a major threat looming on the horizon (see below), the NWSRL became known as the Australian Rugby League (ARL) in 1995; that same year, there were four more expansion teams…Auckland Warriors, North Queensland Cowboys, South Queensland Crushers and Western Reds [of Perth, Western Australia]. The former two of those four – the Warriors of NZ and the Cowboys of North Queensland – still exist. But the latter of those four – the South Queensland team and the Perth team – became a couple of the many casualties of the Super League War.

In 1996, Rupert Murdoch tries to gain the television rights to Australian rugby league, and the Super League War is initiated…
Then in 1996 and 1997, Rupert Murdoch wanted the television rights in order to establish a (very lucrative) pay-television scheme, so he formed a short-lived rival major league by luring prominent ARL club executives, coaches, and players with bags of cash. But it must be pointed out that many of the 8 clubs which jumped ship to Murdoch’s phony league were threatened by Murdoch had they stayed put. Sick of the salary cap in the ARL thwarting their ambitions, Brisbane, Canterbury, and Auckland went over to Murdoch’s league willingly. But as to the others, Murdoch coerced some of those 1st division rugby league clubs into joining his new league, or face the threat of having to compete for the fan-dollar against theoretical new rival-teams that Murdoch would have put in those clubs’ neighborhoods. By April 1996, Murdoch’s News Limited began to sign up target clubs, some of whom had already lost key personnel to Super League. “Club representatives were told that if they did not join Super League, they would face rival clubs established in their area.” {quote from Super League war/The war at its peak (en.wikipedia.org)}. That threat by Murdoch & Company was in fact carried out in one place – the Hunter region of northeast New South Wales (where the city of Newcastle, NSW is located, and where the then-ARL team/now NRL-team the Newcastle Knights are located). So, because the Newcastle Knights stayed put in the AFL, they were suddenly forced to compete in their region in 1997 with the hastily-formed and poorly-supported Hunter Mariners (who were established in 1997, played the ’97 season in Murdoch’s league, then were wound up in late 1997). Poetic justice can be found in the fact that the Newcastle Knights held steadfast, refused to buckle to Murdoch & Company, stayed put in the ARL, and then went on to win the ARL premiership in that twisted year of 1997.

Here are the 8 RL clubs [7 which still exist today, as NRL teams], that jumped ship for that cash-fueled league that Murdoch foisted upon RL fans in 1997…
Auckland Warriors [now named New Zealand Warriors]
Brisbane Broncos
Canberra Raiders
Canterbury Bulldogs [now named Canterbury-Bankstown Bulldogs]
Cronulla Sharks [now named Cronulla-Sutherland Sharks]
North Queensland Cowboys
Penrith Panthers
Western Reds [defunct]

-See this [if you want a headache], Super League war (en.wikipedia.org)/
-See this [if you want it explained short and sweet], from the National Museum of Australia site, Super League (nma.gov.au).}

-Here is a “TL;DR” version of the events around the Super League War, from Reddit.com/RL commenter Socc13er37 [link to the original thread is further below]…
…{excerpt}…
…”[1] Two media moguls, Kerry Packer and Rupert Murdoch, fight over TV rights for the ARL. Packer purchased them in 1993 and Murdoch tried to take the currently dead Pay TV rights, which he did. Packer gets pissed and says he has all the ARL TV rights, and the brawl brews over from there.

[2] Meanwhile, Brisbane CEO John Ribot is unhappy with the current state of the league for his Queensland side, and wants to make his own league, with a global audience and Murdoch-owned teams, called the Super League. ARL and the clubs say “Fuck that” and unanimously decline.

[3] Ribot and Murdoch “go into their evil lair” to plan out how they make the Super League dream a reality. They offer massive salaries and signing bonuses to clubs like Canterbury, Auckland and Brisbane, who all sign on. The ARL find out and plan to expel said clubs from the competition. Murdoch states he won’t let that happen and will compensate the clubs if legal action occurs.

[4] The ARL can’t stop the News Ltd SL train. 8 clubs sign on to join the Murdoch-run league and they look to be riding high, but the court brings them down. The ARL runs the show here, and the Federal Court says there will be no SL until 2000, which was then reduced until this year. Then, the court overturns the decision, and says that the Super League will run in 1997. The ARL appeals, but loses in less than 40 minutes of court proceedings, and results in the CEO’s resignation.

[5] During the two leagues running simultaneously, a lot of clubs lost money and sponsorship was spread thinly. Eventually, the Super League with its extravagant amount of spending couldn’t hold it together, and there was a merger back together, to make the NRL.”…{excerpt from comment made by Socc1er37 at the Reddit.com/r/NRL thread entitled Can someone outline what happened during the ‘super league war’ period of time? (reddit.com/r/nrl/comments).

Murdoch’s cash-fueled league (1997/merged with ARL to form NRL in 1998)
The 1997 season saw 22 clubs in two rival RL leagues. One of which – Murdoch’s league – was filled with 8 former AEL clubs and a few now-defunct expansion clubs [Adelaide and Hunter]). Fans stayed away in droves. Then in late 1997, the courts stepped in and resolved the unsustainable twin-major-leagues mess in Australian rugby league. Murdoch got some of what he wanted (some broadcast rights and co-ownership of the new league structure, as well as ownership of some clubs [he currently owns two-thirds of Brisbane Broncos, and he used to own Melbourne Storm/see 2 paragraphs below]). But more importantly, Murdoch stopped meddling with rugby league in Australia. The fallout remained for years, though/ (see below).

With the resolution of the Super League war in late 1997, the National Rugby League (NRL) is established in 1998…
In late 1997, with the resolution of the Super League war, the National Rugby League (NRL) was established, to begin its first season in 1998. The first order of business was to consolidate. Some clubs (such as St George and Illawarra) merged, in the form of joint-partnerships. Then, after the 1999 season, pushed by Murdoch’s News Limited, the NRL top brass went too far, and tried to destroy South Sydney Rabbitohs. But after a two-year exile, South Sydney and their supporters were able to fight their way back into the league.

In 2000, South Sydney Rabbitohs are excluded by NRL, but then the courts re-instate the Souths into the league (for 2002)
-…{excerpt from wsws.org}…”[2001]…An acrimonious court case late last year in Australia’s Federal Court over the exclusion of a team from the National Rugby League (NRL) spotlights how Rupert Murdoch’s News Corporation uses sport to expand its pay TV subscriber base and secure multi-million dollar profits. The Federal Court upheld a decision by NRL administrators to exclude South Sydney, one of the clubs that founded rugby league in Sydney in 1908, from the premier national competition. The decision was followed by an angry demonstration of 80,000 rugby league football fans, which denounced the court ruling and what they saw as the takeover of their sport by the Murdoch-dominated Foxtel pay TV network, without any concern for those who participate in or support the game”… excerpt from, Australian court endorses Murdoch takeover of rugby league, by Robert Hoffman and John Roberts at wsws.org on 10 January 2001 .}
-… {excerpt from en.wikipedia.org}…”The outbreak of the Super League war involved a vision to cut Sydney sides with Souths in the firing line. Souths remained in the ARL during the 1997 season, and were then played in the National Rugby League, the merger of the Super League and ARL, from its first season in 1998. The NRL set determined to cut its competition to 14 teams and duly cut South Sydney from the premiership for the 2000 season.”…/…”Souths fought their way back through the court rooms and public rallies generating a swell of support throughout Sydney and Australia as they took on the NRL and News Limited. Souths won re-admission on appeal during the 2001 season and were brought back into the NRL competition for the 2002 season.”…{end of excerpts at en.wikipedia.org/wiki/History of the South Sydney Rabbitohs/ Fightback and Re-admission (en.wikipedia.org).

PS, Murdoch’s News Limited company’s then-ownership of Melbourne Storm saw not one but TWO titles revoked [2007 & 2009 NRL titles surrendered by Melbourne Storm] for exceeding the salary cap.

PPS, In 2012, NRL was finally free of Murdoch when …”[the] joint partnership between the sport’s already-existing national governing body, the Australian Rugby League (ARL) and media giant News Corporation…was dissolved in February 2012, with control of the NRL going to the independently formed Australian Rugby League Commission.”…{excerpt from http://en.wikipedia.org/wiki/National_Rugby_League}.

    Into the 2000s, the NRL gets more established and begins to draw more fans…

Televised matches of the NRL began to draw much larger audiences, to the point where the NRL Grand Final of 2007, between Manly and Melbourne, was the most-watched television show in Australia that year. In 2010, the NRL set a record for league average attendance at 17,367 per game [total season aggregate attendance: 3,490,778].

2014 and 2015, and on
The league still shows robust signs of health. The Brisbane Broncos, the highest-drawing rugby club in the world, draw 33 K per game. All-time & reigning-NRL-champs, the South Sydney Rabbitohs pull in 19.8 K per game. The Parramatta Eels draw 18.7 K per game. The Newcastle Knights draw 17.6 K per game. The New Zealand Warriors draw 17.1 K per game. And the NRL as a whole pulls in 15.7 K per game (which is 7.5 K more-per-game than the English first-division rugby league draws) {see this post on England’s Super League [RL]}.

And Australia’s reigning NRL champions – the club that Murdoch could not kill, the resilient South Sydney Rabbitohs – just OWNED England’s best rugby league team, by the score of 39-to-zero, in the 2015 World Club Series. {See this, South Sydney Rabbitohs steamroller St Helens to win World Club Challenge (from Guardian.com/sport/rugby by Aaron Bower on 23 Feb.2015);

    Illustrations for: the best-drawing Rugby team in the world, the Brisbane Broncos;
    and: the second-best draw in Australian RL + 2014 World RL and 2014 NRL champions, the South Sydney Rabbitohs…

Brisbane Broncos (established 1987), are not only the highest-drawing NRL team, but they also are in fact the highest-drawing rugby team in the world (at 33,354 per game in 2014). The Broncos have won 6 NRL titles, their last title having been won in 2006. This gives the Brisbane Broncos the best titles-per-seasons-played ratio in the NRL, at 21.4% (second best is South Sydney Rabbitohs at 18.3%)…
brisbane-broncos_lang-park_aka-suncorp-stadium_c_.gif
Photo and Image credits above -
2015 Brisbane Broncos home jersey, photo from nrlshop.com/brisbane-broncos.
Night-time aerial shot of Lang Park (aka Suncorp Stadium), photo from pinterest.com/source/skypac.com.au. Interior shot, photo by Getty Images via smh.com.au/rugby-league/league-news/a-journey-into-the-belly-of-maroon-beast. Shot of fans at Suncorp Stadium, photo News Limited via foxsports.com.au.

South Sydney Rabbitohs, second-best-drawing rugby league club in Australia, and the 2014 NRL champions…
-The following link has a nice article on the history of South Sydney Rabbitohs, and how the club’s demise and re-birth is inextricably intertwined with the aftermath of the Super League war of the late 1990s. From the ConvictCreations site, South Sydney Rabbitohs – An Australian Story.
-Here is an article which points out that the 2014 NRL Grand Final drew a larger TV audience than the 2014 Aussie rules (AFL) Grand Final, see this, Rabbitohs’ 2014 NRL grand final win the most-watched game in rugby league history (from Daily Telegraph/sport on 6 Oct. 2014, by Cory Adno).

South Sydney Rabbitohs RLC, est. 1908
[Note: the text below is largely the same as the text within the illustration further below.]
South Sydney Rabbitohs RLC were founded in 1908, in the working-class neighborhood of Redfern, which is south of the Sydney business district, and which to this day has a sizeable Aboriginal community. The team’s nickname is believed to come from the club’s early days, when, pre-game, some players on the squad would hawk freshly caught-and-butchered rabbits, and then go on to play the match still in their bloodstained gear. The team is also known simply as the Souths. No one really knows the official reason why the team wears cardinal red and turtle green, but…if you caught and butchered a rabbit, you would probably have grass-stains and blood-stains on your gear.

South Sydney have won the most Australian RL premierships – 21 titles, but before the 2014 season, the club had not appeared in a Grand Final since 1971.
By the 1970s, South Sydney had such financial problems that they became perennial basement-dwellers. Following the resolution of the Super League war, three seasons later [in 2000], the club was excluded from the NRL, for failure to meet “financial criteria”. There then ensued mass protests of over 80,000 in support of South Sydney, and after extensive litigation, the club was re-instated into the NRL, in 2002. The club remained cash-strapped, though, and in 2006 it was voted that the club would seek private ownership. That came in the form of the heir of media conglomerate Consolidated Press Holdings, James Packer; and the film star and Sydney-native Russell Crowe. The two hold a 50-50 share of a 75% stake in the club (with the other 25% ownership of the club still retained by club members).

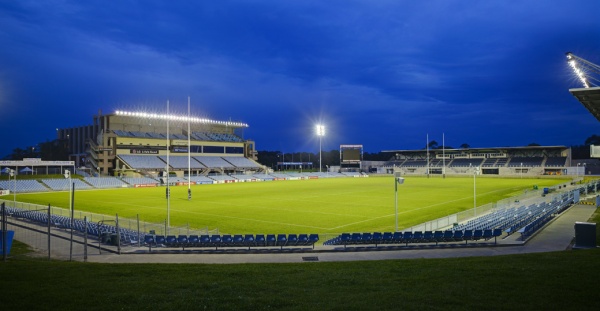
The Souths play at the 84,000-capacity ANZ Stadium in Sydney (aka Stadium Australia), which was the chief venue for the 2000 Sydney Summer Olympics. The Rabbitohs also play a couple of home games each season out in Perth, Western Australia {see this, List of Australian rugby league stadiums/ Occasional Stadiums}.

In 2014, South Sydney averaged 19,888 per game, making them the second-best drawing team in the NRL. In the 2014 NRL Grand Final, in front of 83,833 at the ANZ Stadium in Sydney, the South Sydney Rabbitohs beat the Canterbury-Bankstown Bulldogs 30-6, to win their first NRL Premiership in 43 years.
south-sydney-rabbitohs_2014-grand-final_2014-nrl-champions_h_.gif
Photo and Image credits above -
2015 Rabbitohs jersey, photo from rabbitohsmegastore.shopdesq.com/rabbitohs-2015-mens-home-jersey. ANZ Stadium (aka Stadium Australia), photo .
2014 NRL Grand Final,
Sam Burgess, photo by Mark Metcalfe/Getty Images AsiaPac via zimbio.com. Alex Johnston diving to score a try, photo by Mark Nolan/Getty Images AsiaPac via zimbio.com. View from the stands at ANZ Stadium during the 2014 NRL Grand Final, photo by Sam Ruttyn at dailytelegraph.com.au/the-2014-nrl-grand-final-souths-fans-pride-will-live-forever. George Burgess breaking a tackle and scoring a try, photo by Mark Nolan/Getty Images AsiaPac via zimbio.com. Rabbitohs players carrying MVP Sam Burgess off the field, photo by dailytelegraph.com.au/rabbitohs-2014-nrl-grand-final-win-the-mostwatched-game-in-rugby-league-history.

___
Sources for map page:
-Attendances (2014 season), 2014 Australian football code crowds/Attendances by team.
-Attendance for the New Zealand team (NZ Warriors), http://en.wikipedia.org/wiki/2014_New_Zealand_Warriors_season#Regular_season.
-Titles: List of NRL Premiers (en.wikipedia.org).

Thanks to Ssolbergj for globe-map of Australia, File:Australia (orthographic projection).svg (commons.wikimedia.org).
Thanks to Mdmanser for blank map of Australia and New Zealand (for use as a template), File:Map of Australia and New Zealand coloured.png (commons.wikimedia.org).
Thanks to NordNordWest for blank map of Australia, File:Australia location map.svg (en.wikipedia.org).
Thanks to Antigoni for blank map of New Zealand, File:Map of New Zealand (blank).svg (commons.wikimedia.org).
Thanks to NordNordWest for blank map of New South Wales, File:Australia New South Wales location map.svg (commons.wikimedia.org).
Thanks to Roke for blank map of Greater Sydney, File:Sydney Areas Map.svg
(commons.wikimedia.org).
Thanks to Rulesfan for map of the Barassi line, commons.wikimedia.org/wiki/File:Barassi_line_2.png.
Thanks to aboutaustralia.com.

Thanks to NRL/shop, for colours in recent NRL home jerseys, http://www.nrlshop.com.
Thanks to the contributors at en.wikipedia.org, National Rugby League/Current clubs.

February 5, 2015

Rugby League: 2015 Super League XX location-map, with all-time English RL titles list & attendance figures from 2014./ Plus a season-preview article on 2015 Super League XX, written by James Nalton./ Plus illustrations of the 4 semifinalists from last season, including 2014 champions St Helens RLFC.

Filed under: Rugby,Rugby>England — admin @ 8:16 am

2015_rugby-league_england_france_super-league_xx_map_w-rl-titles_2014-attendance_post_m_.gif
Rugby League: Super League XX location-map, with all-time RL titles list & attendance figures from 2014


Super League official site (superleague.co.uk).
Fixtures.

From the Love Rugby League site, Super League XX predictions (by James Gordon & Zach Wilson at loverugbyleague.com/blog).

New format explained at the following link…superleague.co.uk/#RL New Era.

    2015 Super League XX Preview

By James Nalton
Defending champions St Helens head into Super League XX under a new head coach – club legend Keiron Cunningham – and retain their status as the good outside bet they were in last season’s Grand Final. Their opponents that day, Wigan Warriors, are favourites to take the crown this time around, in a year which is being dubbed a new era for the sport of rugby league.

With the new era comes a new format, which looks confusing on first glance, but aims to provide a sustainable system of promotion and relegation in which a team dropping to a lower division won’t be crippled either on the pitch, or on the balance sheet. It also means that most teams will have something to play for from the first game till the last.

It’s the first time since the end of 2007 that promotion and relegation has been used, although Bradford Bulls and London Broncos were relegated at the end of 2014 to facilitate the move to a 12 team Super League.

The clubs discussed the idea at length before implementing the changes, with the Chairman of Super League Europe, Brian Barwick, commenting that:

“The clubs were unanimous in their view that Super League should become a 12-team competition from 2015 and that there should be meaningful movement between Super League and the Championships.”

The season culminates in the end of season play-offs, and the “Super 8s”, in which the 24 teams from the Super League and Championship are split into three groups of 8, based on their league position, to decide who wins what and who stays in which division.

The first eight will play for the Super League crown, with the top four after seven games going on to the Super League play-offs to decide the winner.

The second eight will fight for a Super League place next season, with the top three from this group claiming a spot in 2016, and the teams finishing 4th and 5th playing off in “The Million Pound Game” to decide the fourth team who’ll make the top league.

The favourites Wigan boast a squad of impressive local players, with many coming through the club’s own academy production line. Their faith in this system has seen them assign the number six jersey to 20-year-old George Williams, rather than look to replace departing Australian stand-off, Blake Green, with another overseas player.

Local academy players Joe Burgess and Dom Crosby were also rewarded with numbers in the first XIII, taking the number 5 and 8 shirts respectively. They join a whole host of players in the Wigan squad who originate from Lancashire’s rugby heartlands, with many joining the club from local amateur side Wigan St Patricks.

Indeed, the entire top division has gone back to its roots in the working class towns of Lancashire and Yorkshire, with the only exception being Catalans Dragons, who are based in the south of France – another traditional league stronghold.

James Nalton is a writer based in Liverpool, England, whose sportswriting focuses on football tactics, emerging talents in world football, and rugby league. He owns several websites covering football around the globe, and has also written for the likes of Squawka, Sambafoot, and EPL Index. James also writes music reviews for local publications, and has a degree in Music Production from The University of Huddersfield. You can follow him on Twitter @JDNalton.

Below are club-profile illustrations for each of the 4 semifinalists in 2014 Super League XIX (champions St Helens, runner-up Wigan Warriors, and quarterfinals winners Catalans Dragons and Warrington Wolves). Included in each illustration is: club info, stadium photos and info, major titles listed, average attendance from the last 4 seasons (2011-14), club history with stadiums and derbies noted, recent home jerseys shown, and photos & stats of top players in 2014…

    2014 Super League XIX champions: St Helens RLFC…

St Helens’ 2014 average attendance: 12,120 per game (3rd best in Super League).
st-helens-rlfc_langtree-park_knowsley-road_t-makinson_j-roby_2014super-league_xix_champions_m_.gif
Photo and Image credits above -
Aerial view of Langtree Park, photo unattributed (uploaded by RMB2001) at skyscrapercity.com/thread [ST HELENS | Langtree Park Stadium | 18,000 | Completed ]. Street-level photo of Langtree Park by barr-construction.co.uk/barr-construction-news. Action photo (of 1st game at Langtree Park Jan 2012), photo by Action Images via telegraph.co.uk/sport/rugbyleague/Sell-out-crowd-watch-St-Helens-play-first-match-at-Langtree-Park.
Aerial photo of Knowsley Road (from 2008) by Webbaviation.co.uk (UK aerial photography), at webbaviation.co.uk/sports/gallery2/v/football-stadia/sthelens. 2015 St Helens home jersey, photo unattributed at newrugbykits.com. Photo of St Helens fans in the stands at Langtree Park (from 2013), photo by sthelensstar.co.uk. Thomas Makinson (2014 top try scorer for St Helens), action photo by liverpoolecho.co.uk. James Roby (2014 top tackler for St Helens), photo by swipix.com via bbc.com/rugby-league. Trophy celebration with St Helens captain Paul Wellens lifting the trophy, photo by Getty Images via dailymail.co.uk/sport/rugbyleague/st-helens-14-6-wigan.

    2014 Super League XIX runner-up: Wigan Warriors RLFC…

Wigan Warriors’ 2014 average attendance: 14,102 per game (2nd best in Super League).
wigan-warriors_central-park1902-99_dw-stadium_josh-charnley_joe-burgess_n_.gif
Photo and Image credits above -
Wigan Warriors 2015 home (retro) jersey, photo from store.wiganwarriors.com/home-shirt-2015-cherry-and-white. Central Park (Wigan), photo [circa late 1990s] by Brian Bradshaw at wiganworld.co.uk/photo-gallery. DW Stadium, exterior aerial telephoto shot with surrounding area in Wigan [aerial view to the South], photo by Dave Green/ OyPhotos.co.uk via skyscrapercity.com/forums via wiganworld.co.uk. Supporters in the rain with umbrellas at Wigan Town square for trophy celebration [photo circa 2011], photo from wiganwarriors.com. Josh Charnley, photo by Chris Brunskill/Getty Images Europe at bettingpro.com via zimbio.com. Joe Burgess, photo by Getty Images via dailymail.co.uk/sport/rugbyleague/article-2789495/sam-tomkins-backs-joe-burgess.

    2014 Super League semifinalist: Catalans Dragons (aka Ville de Perpignan Dragons RLFC)…

Catalans Dragons’ 2014 average attendance: 7,667 per game (7th best in Super League).
catalans-dragons_stade-gilbert-brutus_morgan-escare_t_.gif
Photo credits above –
Catalans Dragons 2014 jersey, photo from rlshop.co.uk/catalans-dragons-home-shirt-2014. Aerial view, unattributed at info-stades.fr/forum/rugby-top14/perpignan-stade-gilbert-brutus-dragons-catalans-t1269.html. Photo at front gate, Michael at flickr.com/photos/gumptard/2322189456/. Photo of Dragons supporters, at catalansdragons.com/en/articles-6/6-17-fans-associations/. Morgan Escaré, photo by swipix.com via bbc.com/sport/rugby-league.

    2014 Super League semifinalist: Warrington Wolves RLFC…

Warrington Wolves’ 2014 average attendance: 9,870 per game (5th best in Super League).
warrington-wolves_halliwell-jones-stadium_joel-monaghan-top-try-scorer2014_n_.gif
Photo and Image credits – Warrington 2014 home jersey, photo from rlshop.co.uk/superleague/warringtonwolves. Halliwell Jones Stadium, photo unattributed at examiner.co.uk/sport/rugby-league. WWRLFC crest (sign on stadium), photo by Gareth Copley/Getty Images Europe via zimbio.com. Warrington fans, photo from warrington-worldwide.co.uk. Joel Monaghan (top scorer with 28 tries in 2014 SL XIX), both photos by: (on left), Gareth Copley/Getty Images Europe via zimbio.com; (on right) Gareth Copley/Getty Images Europe via zimbio.som.


Notes on the map page…
The map page features, on the far left, a map of England and a map of France (which shows the location and crest of Super League club Catalans Dragons). At the top centre is an enlarged inset map of Northern England (which shows the locations and crests of 11 of the 12 Super League clubs). At the top right is the all-time English rugby league national titles list (1895-96; 1902-03 to 1914-15; 1919-20 to 1938-39; 1941-42 to 2014/[Super League established in 1996/SL playoffs began in 1998]). At the lower centre is 2014 attendance data for Super League XX clubs. Included in the attendance data are league averages for crowd size in the last 3 seasons (in SL XVII, XVIII, XIX/2012, 2013, 2014).
Here are the Super League league average attendance numbers for the last 3 seasons…
2012: 9,048.
2013: 8,570.
2014: 8,153.
The re-introduction of promotion/relegation in Super League was probably needed, because, while Super League attendances overall have not plummeted, they certainly are on a downward trend. In 2014, average crowds in Super League were down 4.1% (from 2013), and were down 9.9% from two seasons ago. That has been a drop-off of 895 per game. With the relegation of abysmally-drawing London Broncos, plus some hopefully tight relegation dogfights this season, Super League XX will most likely see an uptick in the league average crowd size.


Sources for map:
Thanks to the following…
-Titles, Rugby Football League Championship/League Leaders and Champions; Super League/Super League Champions (en.wikipedia.org).
-Attendance, 2014 and 2013 figures from this article at Total RL.com, totalrl.com/opinion-super-league-attendance-drop-cause-concern;
also, bbc.co.uk/rugby league reports via 2014 Super League season results (en.wikipedia.org), for Hull KR Percent Capacity figure (had to do it manually because of stadium-expansion midaway through the in April 2014).
___

Thanks to League express at Total RL.com for the attendance figures for 2013 & 2014 {here}.
Thanks to very much to Hanigan for 2012 attendance figures {2012 SL league average and club average attendances from Hanigan at totalrl.com/forums/index.php/topic/244182-averages-attendances-for-super-league-and-other-divisions/.}.
Thanks to James Gordon at LoveRugbyLeague.com, for compiling the 2011 attendance figures, loverugbyleague.com/news_10175-wigan-top-average-attendance-table.html.
Thanks to bbc.co.uk/rugby-league for reporting attendance figures in Super League (the BBC is one of the few media outlets that report rugby league attendances, done on a game-by-game basis; unfortunately they do not report total averages).
Thanks to LoveRugbyLeague.com stadium profile pages,
loverugbyleague.com/club/st-helens/ground-guide.
loverugbyleague.com/club/wigan-warriors/ground-guide.
loverugbyleague.com/club/catalan-dragons/ground-guide.
loverugbyleague.com/club/warrington-wolves/ground-guide.

Thanks to DistanceFromTo.net, for distances between towns.

Thanks to the Cherry & White – Independent Wigan RLFC fansite, for this very detailed and illustrated article on the old Central Park (Wigan), wigan.rlfans.com/Central Park.

Thanks to D-maps.com, for blank map of the UK, http://d-maps.com/pays.php?num_pay=218&lang=en.

Bill Turianski thanks James Nalton for collaborating on this post. James’ blog, The Botofogo Star, is on the blogroll at billsportsmaps.

April 12, 2013

Rugby league football (England and France): Super League – Super League XVIII (2013 season) location-map, with 2012 attendance data, and all-time Rugby Football League titles list / Plus illustrations of the grounds of the 3 best-drawing English rugby league clubs in 2012 (Wigan Warriors RL, Leeds Rhinos RLFC, and St Helens RLFC).

Filed under: Rugby,Rugby>England — admin @ 8:56 pm

rugby-league_super-league2013_2012-attendances_post_i_.gif
Super League, location-map with 2012 attendance data of the 14 teams, and all-time Rugby Football League titles list


Note: my most-recent Super League map & post can be found here,
Rugby League: 2015 Super League XX location-map, with all-time English RL titles list & attendance figures from 2014./ Plus a season-preview article on 2015 Super League XX, written by James Nalton./ Plus illustrations of the 4 semifinalists from last season, including 2014 champions St Helens RLFC.

Official site of Super League, superleague.co.uk.

From loverugbyleague.com, from 10 Sept.2012, by James Gordon, ‘Wigan top average attendance table – Six Super League teams averaged crowds of more than 10,000 during the 2012 regular season.’

    Below, the top 3 drawing rugby league clubs in England in 2012: Wigan Warriors, Leeds Rhinos, and St Helens…

Best-drawing English rugby league football club in 2012, Wigan Warriors, 16,043 per game and a 66 percent-capacity.
wigan-warriors_dw-stadium_13d.gif
Photo credits above –
Photo of Wigan Warriors’ jersey crest from superleaguefans.com/shop.
Aerial photo of DW Stadium unattributed at forum.ea.com.
Interior photo of DW Stadium from wiganwarriors.com.
Photo of Wigan Warriors fans by mikemcsharry via popeandswift.co.uk.

Second-best-drawing English rugby league football club in 2012, Leeds Rhinos (2012 Super League champions), at 14,948 per game and a 72 percent-capacity.
leeds-rhinos_headingley-carnegie-stadium_14i_gif
Photo and Image credits above –
Aerial photo of Headingley Carnegie Stadium from therhinos.co.uk.
Alam at dailymail.co.uk/sport/rugbyleague/article-2203414/Leeds-spend-1million-new-pitch-Headingley.html.
Leeds Rhinos’ jersey badge and 2013 jersey front [wallpaper] uploaded by azsportza at http://forums.leagueunlimited.com/showthread.php?t=381199&page=25.
[azsportza at photobucket.com, http://s820.photobucket.com/user/azthomasza/library/?sort=3&page=2 (Australian RL, English RL, Premier League, La Liga kit wallpapers).]
Varley Picture Agency at therhinos.co.uk.
Unattributed at bbc.co.uk.

Third-best-drawing rugby league football club in 2012, St Helens, at 14,088 per game and a 78 percent-capacity – in their brand-new 18,000-capacity Langtree Park, which opened in November, 2011, and is owned by St Helens RLFC (and is also the new home of Liverpool FC reserves).
st-helens-rlfc_langtree-park_b.gif
Photo credits above –
Photo of St Helens’ jersey crest from superleaguefans.com/shop.
Aerial photo of Langtree Park by Simon Kirwan at lightboxuk.photoshelter.com.
Action Images at telegraph.co.uk/sport/rugbyleague/Sell-out-crowd-watch-St-Helens-play-first-match-at-Langtree-Park-and-retain-Karalius-Cup.
Chris Stoddart at commons.wikimedia.org.


___

Thanks to James Gordon a LoveRugbyLeague.com, for compiling the attendance figures, loverugbyleague.com/news_10175-wigan-top-average-attendance-table.html.

Thanks to the contributors to the pages at en.wikipedia.org, ‘Super League‘ en.wikipedia.org).

Thanks to Daniel Dalet at D-maps.com for the blank maps of England and France, d-maps.com/carte.php?lib=france_map&num_car=2820&lang=en.

December 19, 2009

Rugby Union: 2009-10 Heineken Cup, Pool Stage (24 teams).

Filed under: Rugby — admin @ 3:28 pm

rugby_heineken-cup2009-10pool-stage_post.gif


Official site of the Heineken Cup {click here).  Pools table {click here].

Round 4 of 6 is being played this weekend for the 15th edition of the Heineken Cup,  which is the top European competition for Rugby Union.  Holders are Leinster Rugby {site, here},  the Magners League club who hail from Dubiln, Ireland.

The 6 pool group winners,  plus the two highest-placed 2nd place teams advance to the next round of the 2009-10 Heineken Cup.  The final is scheduled for 22 May, 2010,  at Stade de France in Paris.

Pool group leaders currently comprise a Welsh club,  Swansea’s Ospreys;  an Irish club,  Munster Rugby;  a Reading, England-based club,  London Irish;  and three French sides…Stade Francais (of Paris),  the French Basque Country-based Biarritz Olympique,  and all-time Heineken Cup title leaders Stade Toulousain (aka Toulouse).

There is just one side still with a 100% record in the competition,  that is Biarritz Olympique… ’Dmitri Yachvili’s 23-point haul for Biarritz slays Dragons’,  by Matt Lloyd from The Guardian.co.uk, 19th December {click here}.”

Thanks to the contributors to the pages at en.wikipedia.org {click here (2009-10 Heineken Cup page)}.  Thanks to http://www.therugbyblog.co.uk/ .   Thanks to http://geology.com ,  for the base map of Europe.   Thanks to Map of UK.com, for the base map of Great Britain and Ireland {click here}.

September 3, 2009

Super League XIV; Guinness Premiership 2009-10 and the Magners League 2009-10, with maps of each league, and attendance map of all 36 teams in top flight UK/Irish rugby.

Filed under: Ireland,Rugby,Rugby>England,Scotland,Wales — admin @ 6:25 am

rugby_post_b.gif


The first map shows all 36 teams in the three top rugby leagues of Great Britain and Ireland.  The maps for Super League XIV,  Guinness Premiership 2009-10,  and Magners League 2009-10 are further down in the post.  

Two of the three leagues shown on the map use the older Rugby Union code.  Super League uses the newer Rugby League rules

The Rugby Union code dates back to 1870 {see this}. The Rugby League code has its roots in the Great Schism, and the formation of the Northern Rugby Football Union in 1895 {see this: ‘The Great Schism’ (from RugbyFootballHistory.com)};  {see this: ‘History of rugby league’, from en.wikipedia.org}.}.   

In the late nineteenth century, the working class status of the majority of rugby players in the north of England necessitated an establishment of payment for the players (as well as compensation for injuries). The origins of many of the rugby players in the south of England were middle class and upper class, and many learned the game at the Public Schools (which were then and still are essentially private schools for the privileged). So there was less a need for player payment. The Rugby League / Rugby Union split can traced to this Victorian era class divide…in the north, poor working-class men playing the game, in the south, Public School graduates with little pressing need for salary augmentation, playing the game under the principles of amateurism. 

In 1892, charges of professionalism were made against rugby clubs in Yorkshire, specifically in Leeds and Bradford. By 1893, widespread suspensions of northern clubs and players began. In late August, 1895, in a meeting in Manchester, nine Lancashire clubs declared their support for their Yorkshire colleagues. Two days later, 29th August, 1895, representatives of 22 clubs met in Huddersfield, Yorkshire to form the Northern Rugby Football League. Included in these 22 clubs were 7 clubs that are currently in Super League XIV…Huddersfield, Hull FC, Leeds, St Helens, Wakefield Trinity, Warrington, and Wigan.

-

Rugby Union is more plodding, and utilizes scrums to restart the run of play {see this, ‘Playing rugby union’}.  Rugby League is faster and more wide-open {see this: ‘Rugby League’}. But Rugby League is the dominant game in just two areas of the world…in a swath of north-central England, and in Australia. 

Rugby League Code: Super League…

rugby-league_region-of-north-central-england.gif

Click on the following title for Super League XIV map:  rugby_super-league-xiv___.gif

The parts of northern England where Rugby League is the dominant code are in a band which stretches from Merseyside, through Cheshire, Greater Manchester, and east across the Pennine Chain to West Yorkshire, and the East Riding of Yorkshire, centered on Hull. 11 of the 14 current teams in Super League are from this Rugby League-intensive swath of England. In this swath there is 1 team from Merseyside, just east of Liverpool (St Helens); [Editors note ca. 2014: now 2 teams currently from Cheshire incl. the re-instated Widnes Vikings] 1 team from Cheshire (Warrington Wolves); 2 teams from Greater Manchester (Wigan Warriors and Salford City); 5 teams from West Yorkshire (Huddersfield Giants, Bradford Bulls, Leeds Rhinos, Wakefield Trinity Wildcats, and Castleford Tigers); and 2 teams from Kingston upon Hull (Hull FC, and Hull Kingston Rovers).

There is one other team in Super League from England: Harlequins RL, who are based in west London. Although it had separate origins, since 2005 Harlequins RL has been a branch of the Rugby Union/ Guinness Premiership team Harlequins FC. Harlequins field a team in both rugby codes (as do Super League team Leeds Rhinos, with their Rugby Union team being Leeds Carnegie). 

The other two teams in Super League XIV are the Celtic Crusaders of Bridgend, south Wales, who joined Super League in 2008; and Catalans Dragons, of Perpignon, France (in the Catalonian area of southern France), who joined in 2006. [Note: Celtic Crusaders are now defunct, having been wound up in Sept. 2011.]. Super League was formed with the intention of being Europe’s top league in the Rugby League code, but having one team outside of Great Britain is as far as the league has got in that direction. The French team was originally Paris Saint-Germain RL , but thar poorly supported club went under in 1997.

In 2005, Super League replaced promotion/relegation with Licensing {see this}. There is a brief description of Super League Licenses on the map, in the sidebar.  Super League features a February to September playing season, unlike the traditional late summer/ fall/ winter/ early spring rugby season. 

The highest drawing teams in Super League are Leeds Rhinos, who averaged 15,113 per game in 2008;  Hull FC (14,390 per game);  Wigan Warriors (14,149 per game); and St Helens (12,796 per game). As a whole, Super League XIII averaged 9,082 per game. Here is the list of attendances that I used {click here (FootballGroundGuide.com Message Board thread, posted by frequent contributor Stadiumitis?)}

Super League has a large play-off format, with 8 teams qualifying each season . This system has been in place since 1998 {see this}, and culminates each season in the Grand Final.

Only four teams have won Grand Final Titles…St Helens 4 times; Leeds Rhinos and Bradford Bulls 3 times; and Wigan Warriors once, in the first final in 1998.   Leeds Rhinos were 2008 champions.

For the full list of Rugby League Champions (1895-’96 to 2008), {click here}.

http://www.superleague.co.uk/

For the 2009 Super League table {click here}.

For new expanded Super League play-off structure {click here (Sky Sports broadcast report from March, 2009}.

-

Rugby Union Code: Guinness Premiership…

Click on the following title for Guinness Premierhip 2009-10 map: rugby_guinness-premiership2009-10_1.gif

 The Guinness Premiership is strictly an English affair.  Its roots are in the English Rugby Football Union’s decision in the early 1970′s to finally sanction a knock-out cup (which is now known as the Anglo-Welsh Cup {see this}. The pro game in England had been held back by the organizers fear that ‘dirty play’ would ensue if leagues were organized within English Rugby Union. By the mid-1980′s , national merit tables came into being (this being the first time Rugby Union teams’ success was quantifiably measured). In 1987, the Courage Leagues were formed. This was a pyramid system involving 108 leagues and over 1,000 teams. In 1994, Sky Sports started broadcasting games. In 1996, professional status began with the debut of the Rugby Union Premiership. In 2002-03, the champion was now determined by the Playoffs winner, instead of first place in the final league table. That season the title went to London Wasps, while Bath was winner of the now-secondary league table. Those two teams, London Wasps and Bath Rugby, both have won 6 Premiership Titles, they are second only to Leicester Tigers  who boast of 8 Premiership titles. Leicester also draws very well,  averaging around 17,000 per game. The only other teams with titles are Newcastle Falcons and Sale Sharks, both with 1 championship season. Incidentally, Sale Sharks are the lone Rugby Union team in the Rugby League region of north-central England. Gloucester has won the league table 3 times. Reigning champions are Leicester Tigers.

The Guinness Premiership has relegation and promotion, with last place being sent down to the Guinness Championship (formerly National Division One). It is the only one of these 3 leagues that has promotion/relegation in the strict sense. Leeds Carnegie have been promoted for the 2009-10 Guinness Premiership,  upplanting the relegated Bristol Rugby. 

The Guinness Premiership draws the highest crowds of the 3 leagues, averaging 10,876 per game in the 2008-’09 season. Highest drawing teams in 2008-09 were Leicester Tigers (17,210 per game); Gloucester (14,215 per game); Northampton Saints (13,250 per game); Harlequins RFC (11,774 per game); and London Irish, of Reading (11,384 per game). Five teams drew between 9,100 and 10,600 per game…Bath Rugby; Worcester Warriors;  Saracens,of Watford; London Wasps, of Wycombe;  and Sale Sharks, of Stockport, Greater Manchester. 

Guinness Premiership 2009-2010 season starts 4th September,  fixtures {click here (Official site)}

-

Rugby Union Code: Magners League…

Click on the following title for Magners League map: rugby_magners-league09-10.gif

The Magners League is the top flight rugby league of Wales, Scotland, Ireland, and Northern Ireland. Its roots are in the old Welsh Premier Division. In 1999, Scottish teams joined, and in 2001, Irish and Northern Irish teams joined,  inaugurating the Celtic League. After a shake-up in early 2003, involving the demise of some of the Welsh teams, it was decided that the Celtic League would become the sole professional league in Wales, Scotland, Ireland, Northern Ireland. [The Welsh Premier Division is now a developmental league, see this.]. In 2006, for sponsorship reasons, the Celtic League became known officially as the Magners League. 

Munster and Leinster have won the title twice; Ospreys, Llanelli, and Ulster have one title each. Munster Rugby are reigning champions. Munster also drew highest of all teams, not just in the Magners League, but versus teams from the other two leagues as well. Munster plays in two locations: in Cork, and in Limerick. They averaged 17,401 per game in 08/09. Leinster also drew well, second highest in the Magners League and fifth best overall, at 14,728. The next highest drawing Magners League team last season was Ulster, of Belfast, Northern Ireland, who drew 9,085 per game. Next in order came the four Welsh teams… Cardiff Blues (8,673 per game); Ospreys, of Swansea (8,405 per game); Scarlets, of Llanelli (7,293); and Newport Gwent Dragons (6,089). The 2 Scottish teams only drew in the 4,000-range; and the lowest drawing club of all was Connacht, of Galway, Ireland,  ho drew only 1,989 per game, lower than 10 teams in lower-division leagues. There is a Magners League sidebar at the lower left of the map.

Magners League 2009-2010 season starts 4th September,  fixtures {click here}.

-

Lower Leagues

The highest drawing non-top-flight team in 08/9 was Exeter Chiefs, of National Division 1 (that league will be called the Guinness Championship in September 2009). Exeter drew 4,599 per game in 08/09, higher than 2 Super League and 2 Magners League teams. Next highest, at 4,006 per game, was Widnes Vikings, of Cheshire, a team in the second tier of Rugby League, which is called the Co-Operative Championship {see this map of the teams in the Co-operative Championship…again,  ote the concentration of teams in the Rugby League-oriented north of England} [note: Widnes Vikings joined Super League in 2012.].

-

Thanks to Football Grounds Guide Message Board, and contributor ‘Stadiumitis?’  {click here}.   Football Grounds Guide home {click here}.  

Thanks to James at The Rugby Blog {click here}, for input and information.

Thanks to Steven Bond at Plover.net {‘Rugby League vs. Rugby Union’, click here}.  

Thanks to Suite101 site, and this thread {click here: ‘Rugby Union versus Rugby League’,  by Stuart Duncan}.  
Thanks to the contributors to the pages at Wikimedia  {click here for Super League XIV page;  click here for Guinness Premiership pageclick here for Magners League page}.

Powered by WordPress