
By Bill Turianski on the 6th of July 2024; twitter.com/billsportsmaps.
Links…
-1971 MLB season (en.wikipedia.org).
-1971 MLB (baseball-reference.com).
-Year in Review: 1971 American League (baseball-almanac.com).
-Year in Review: 1971 National League (baseball-almanac.com).
-1971 MLB logos (sportslogos.net).
…
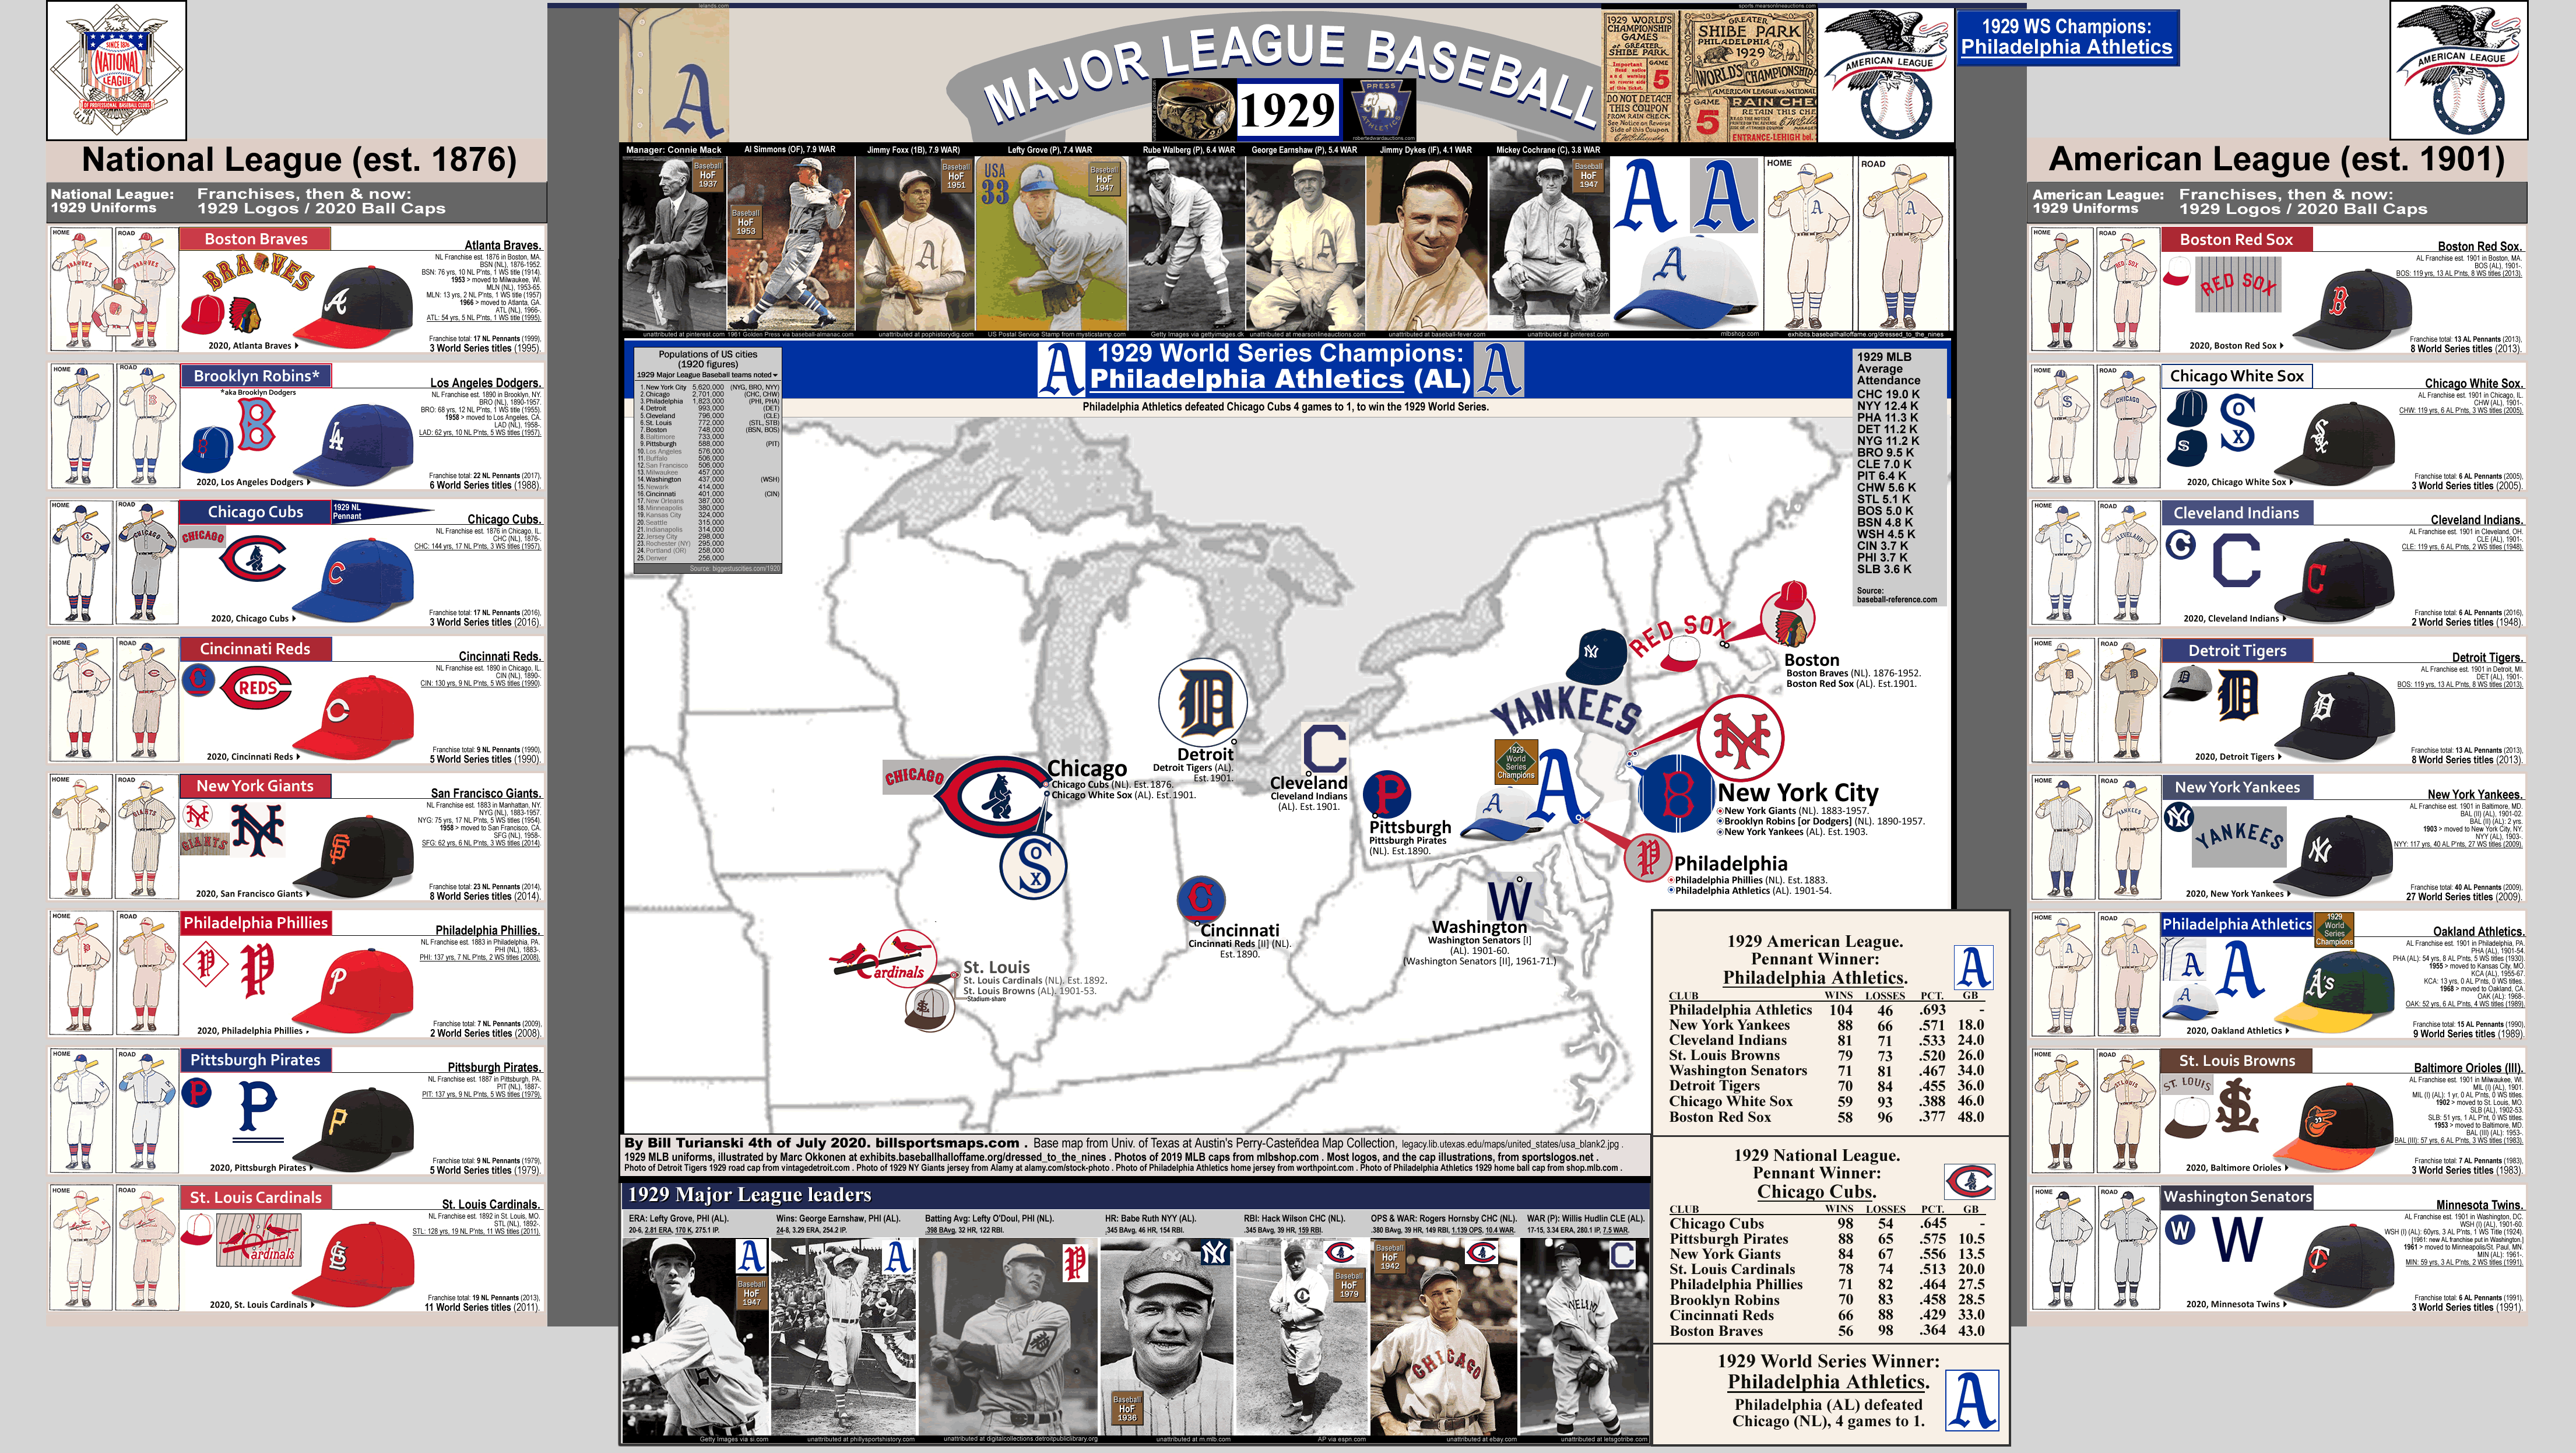
1971 MLB Location-map with jersey-logos with 1971 attendances, featuring the 1971 World Series champions: the Pittsburgh Pirates.
This is my fifth in a series. Here are links to the first four posts in this series:
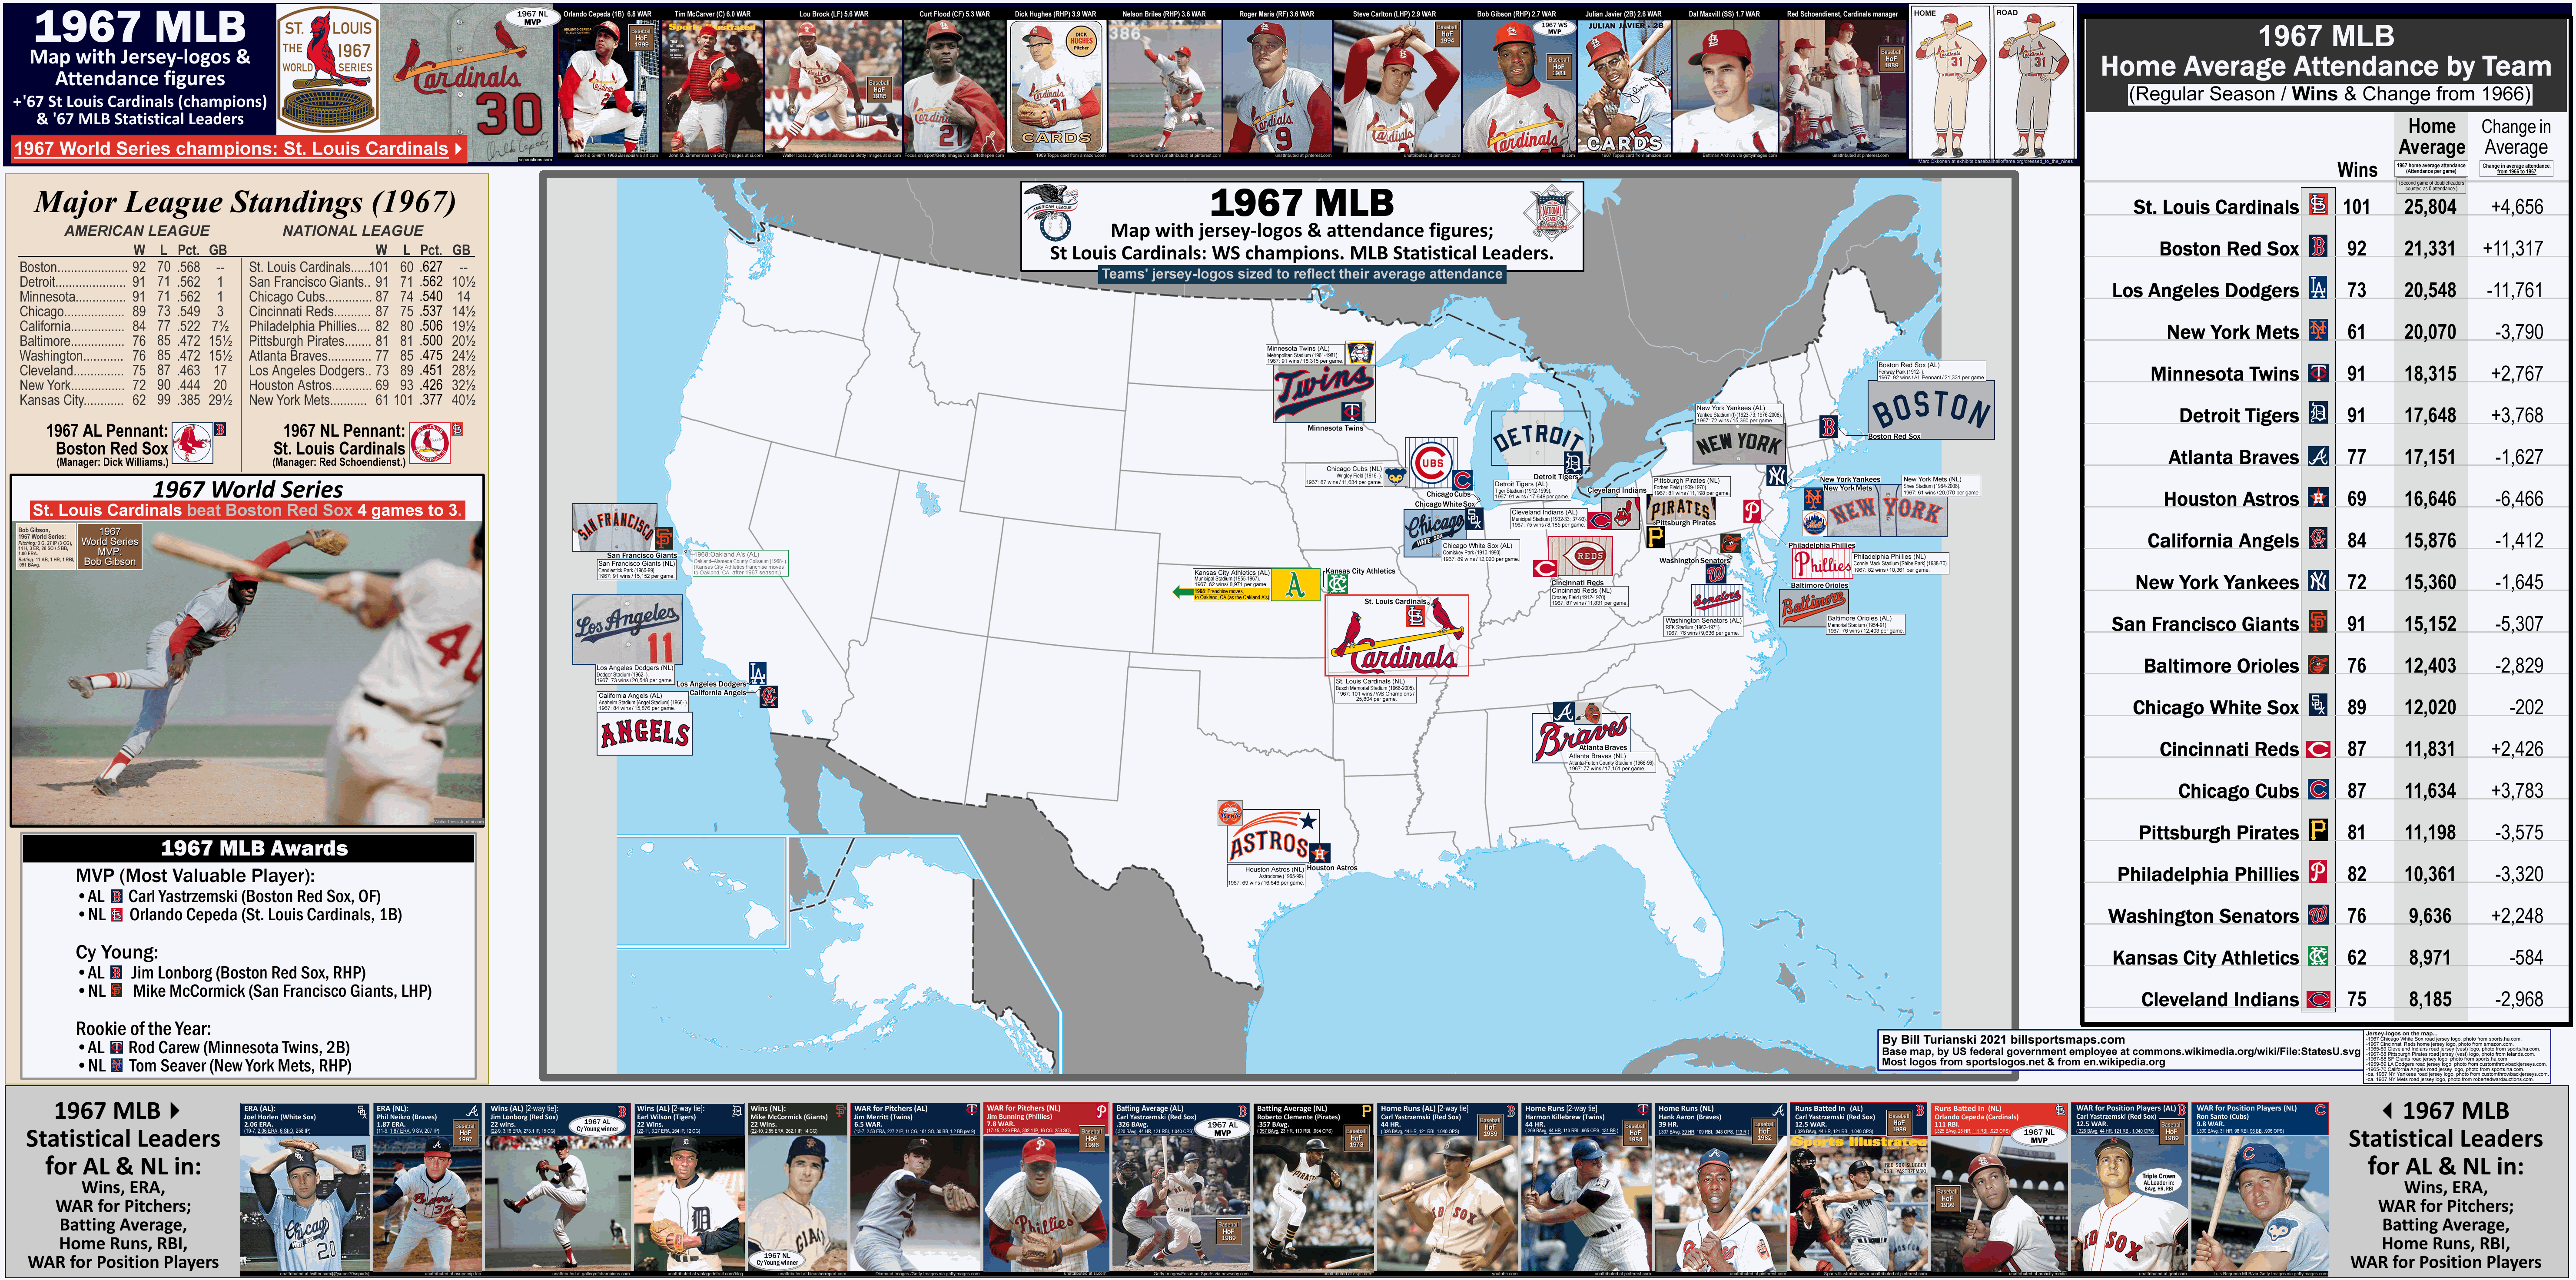
•1967 MLB Location-map with Jersey-logos & Attendances, featuring the ’67 World Series champions: the St. Louis Cardinals;
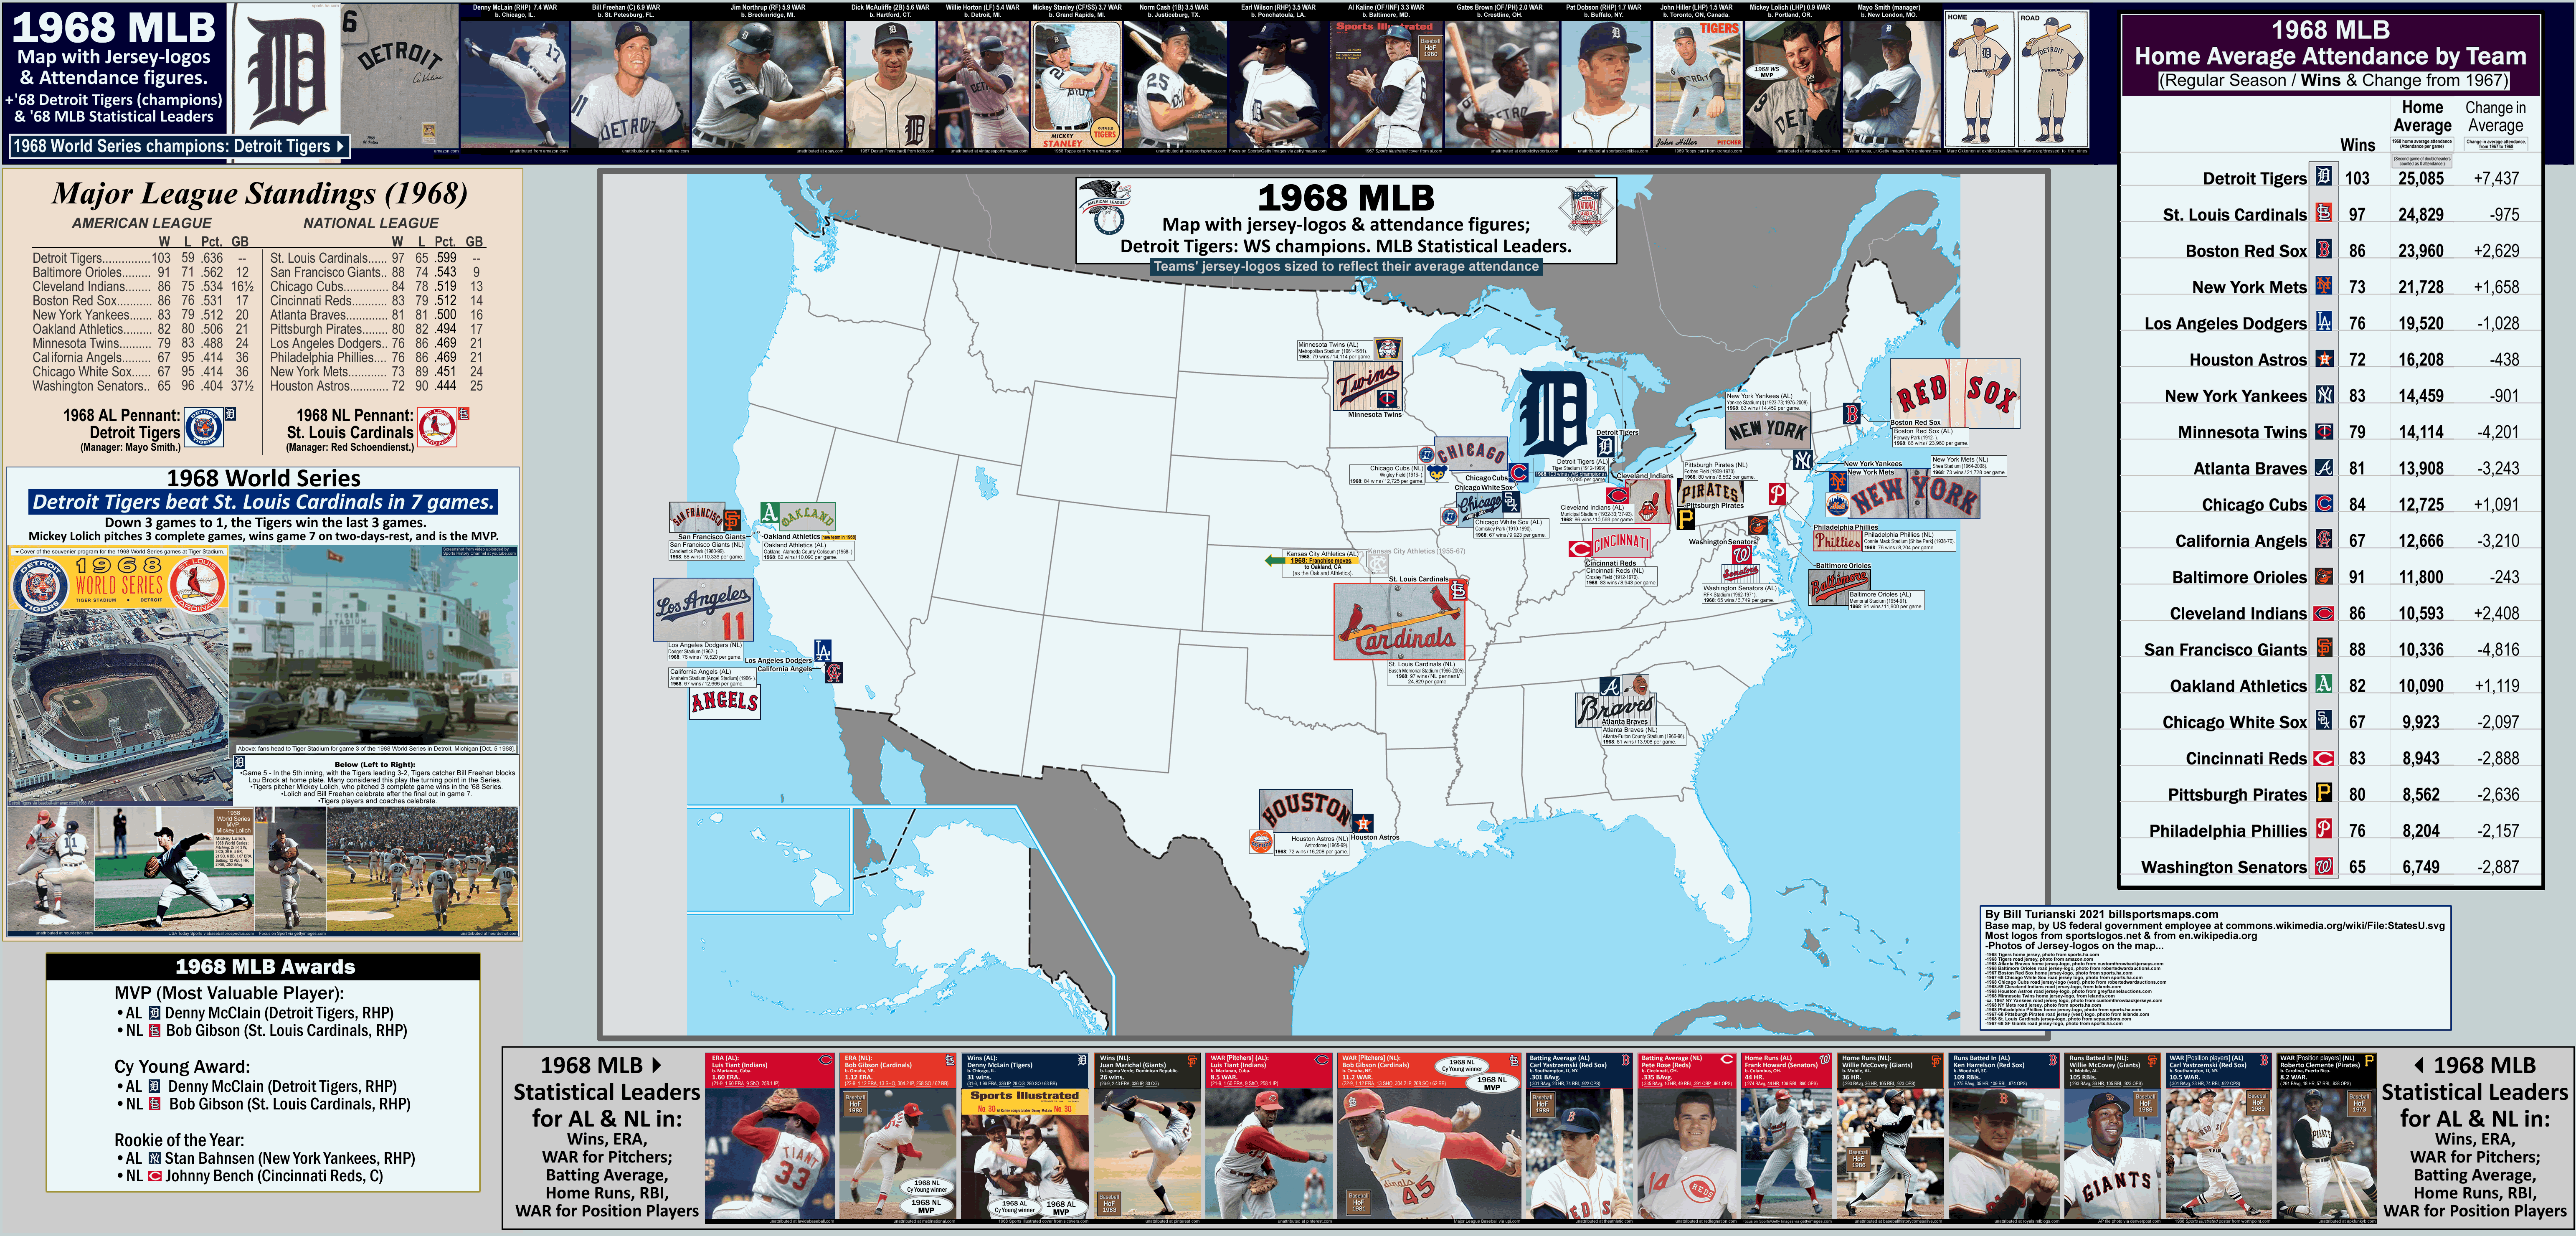
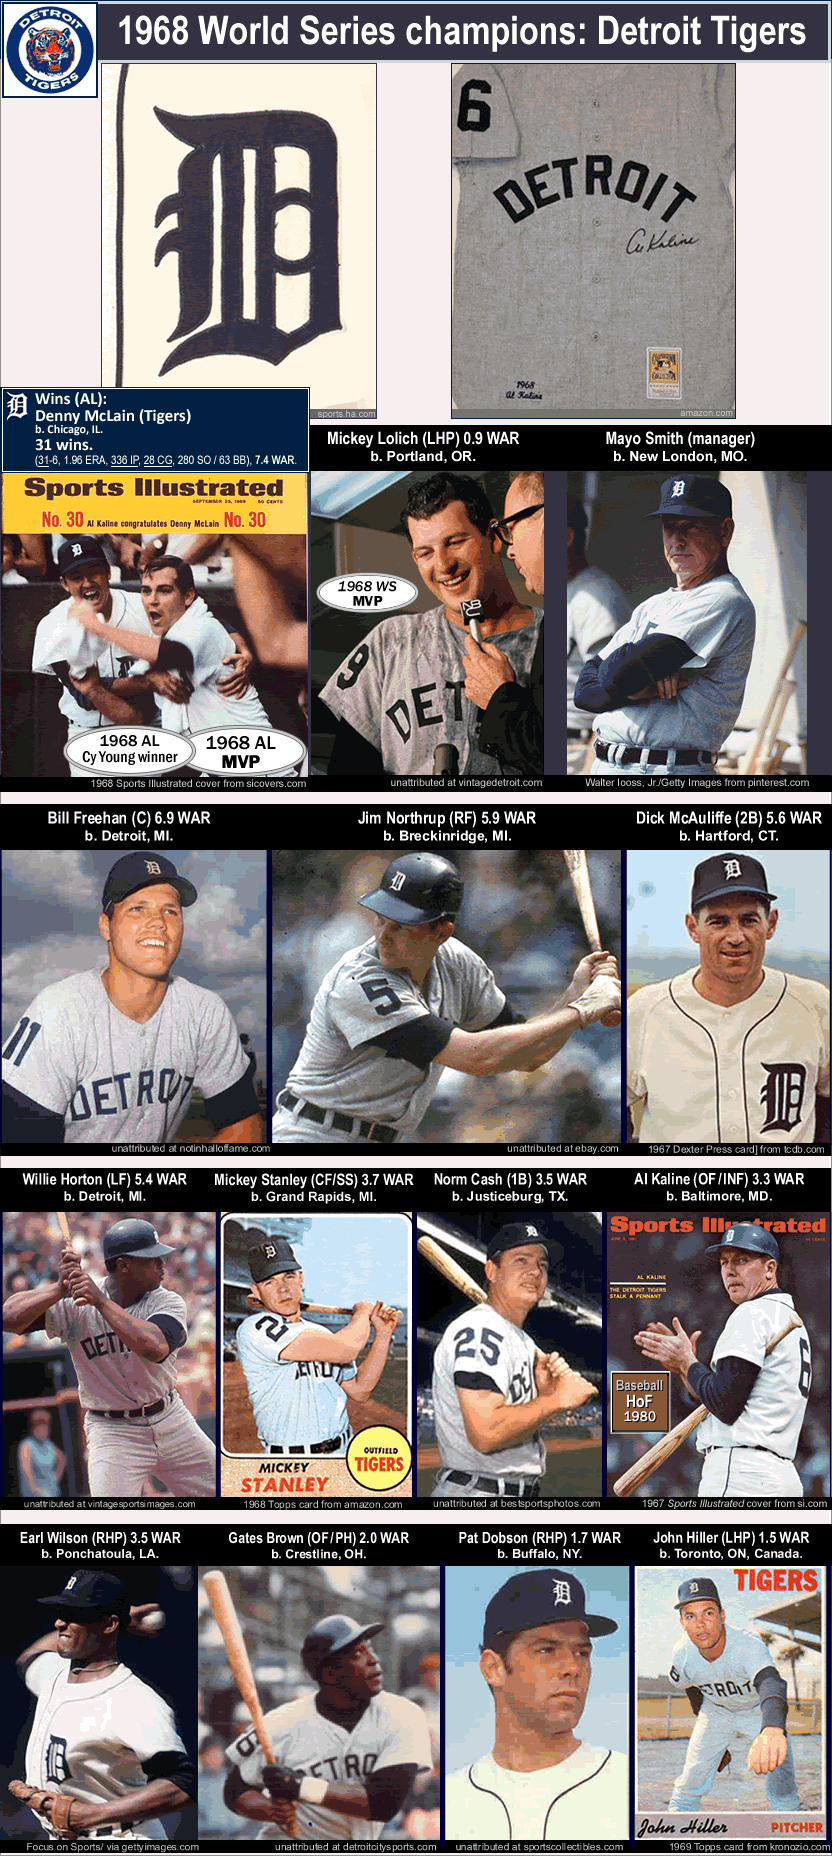
•1968 MLB Location-map with Jersey-logos & Attendances, featuring the ’68 World Series champions: the Detroit Tigers.
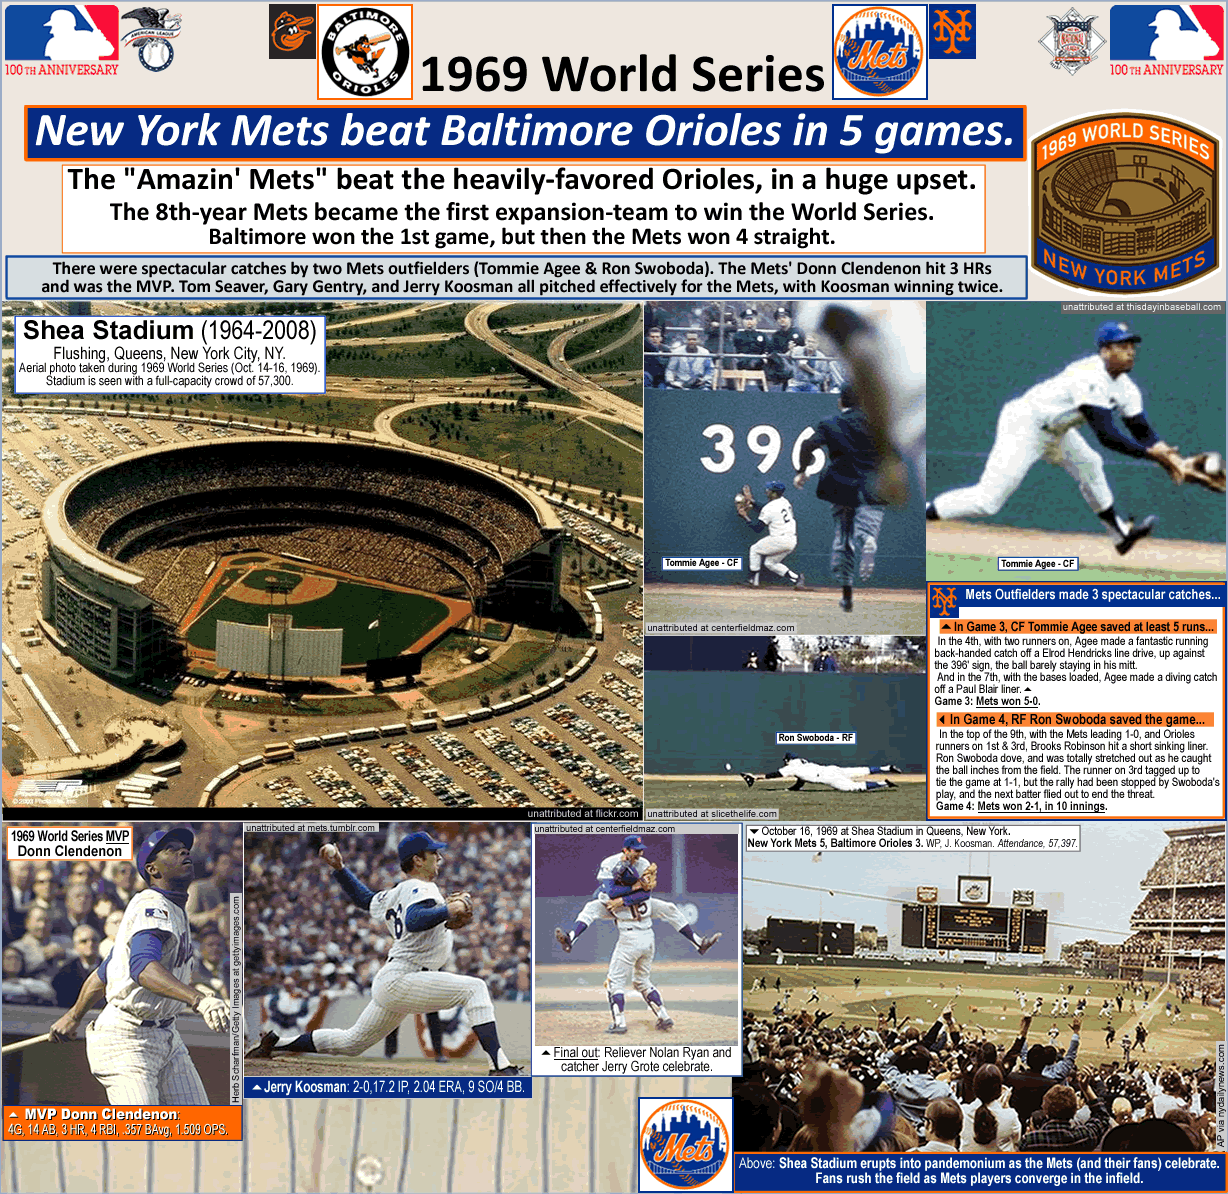
•1969 MLB Location-map with Jersey-logos and Attendances, featuring the ’69 World Series champions: the New York Mets.
•1970 MLB Location-map with Jersey-logos & Attendances, featuring the 1970 World Series champions: the Baltimore Orioles.
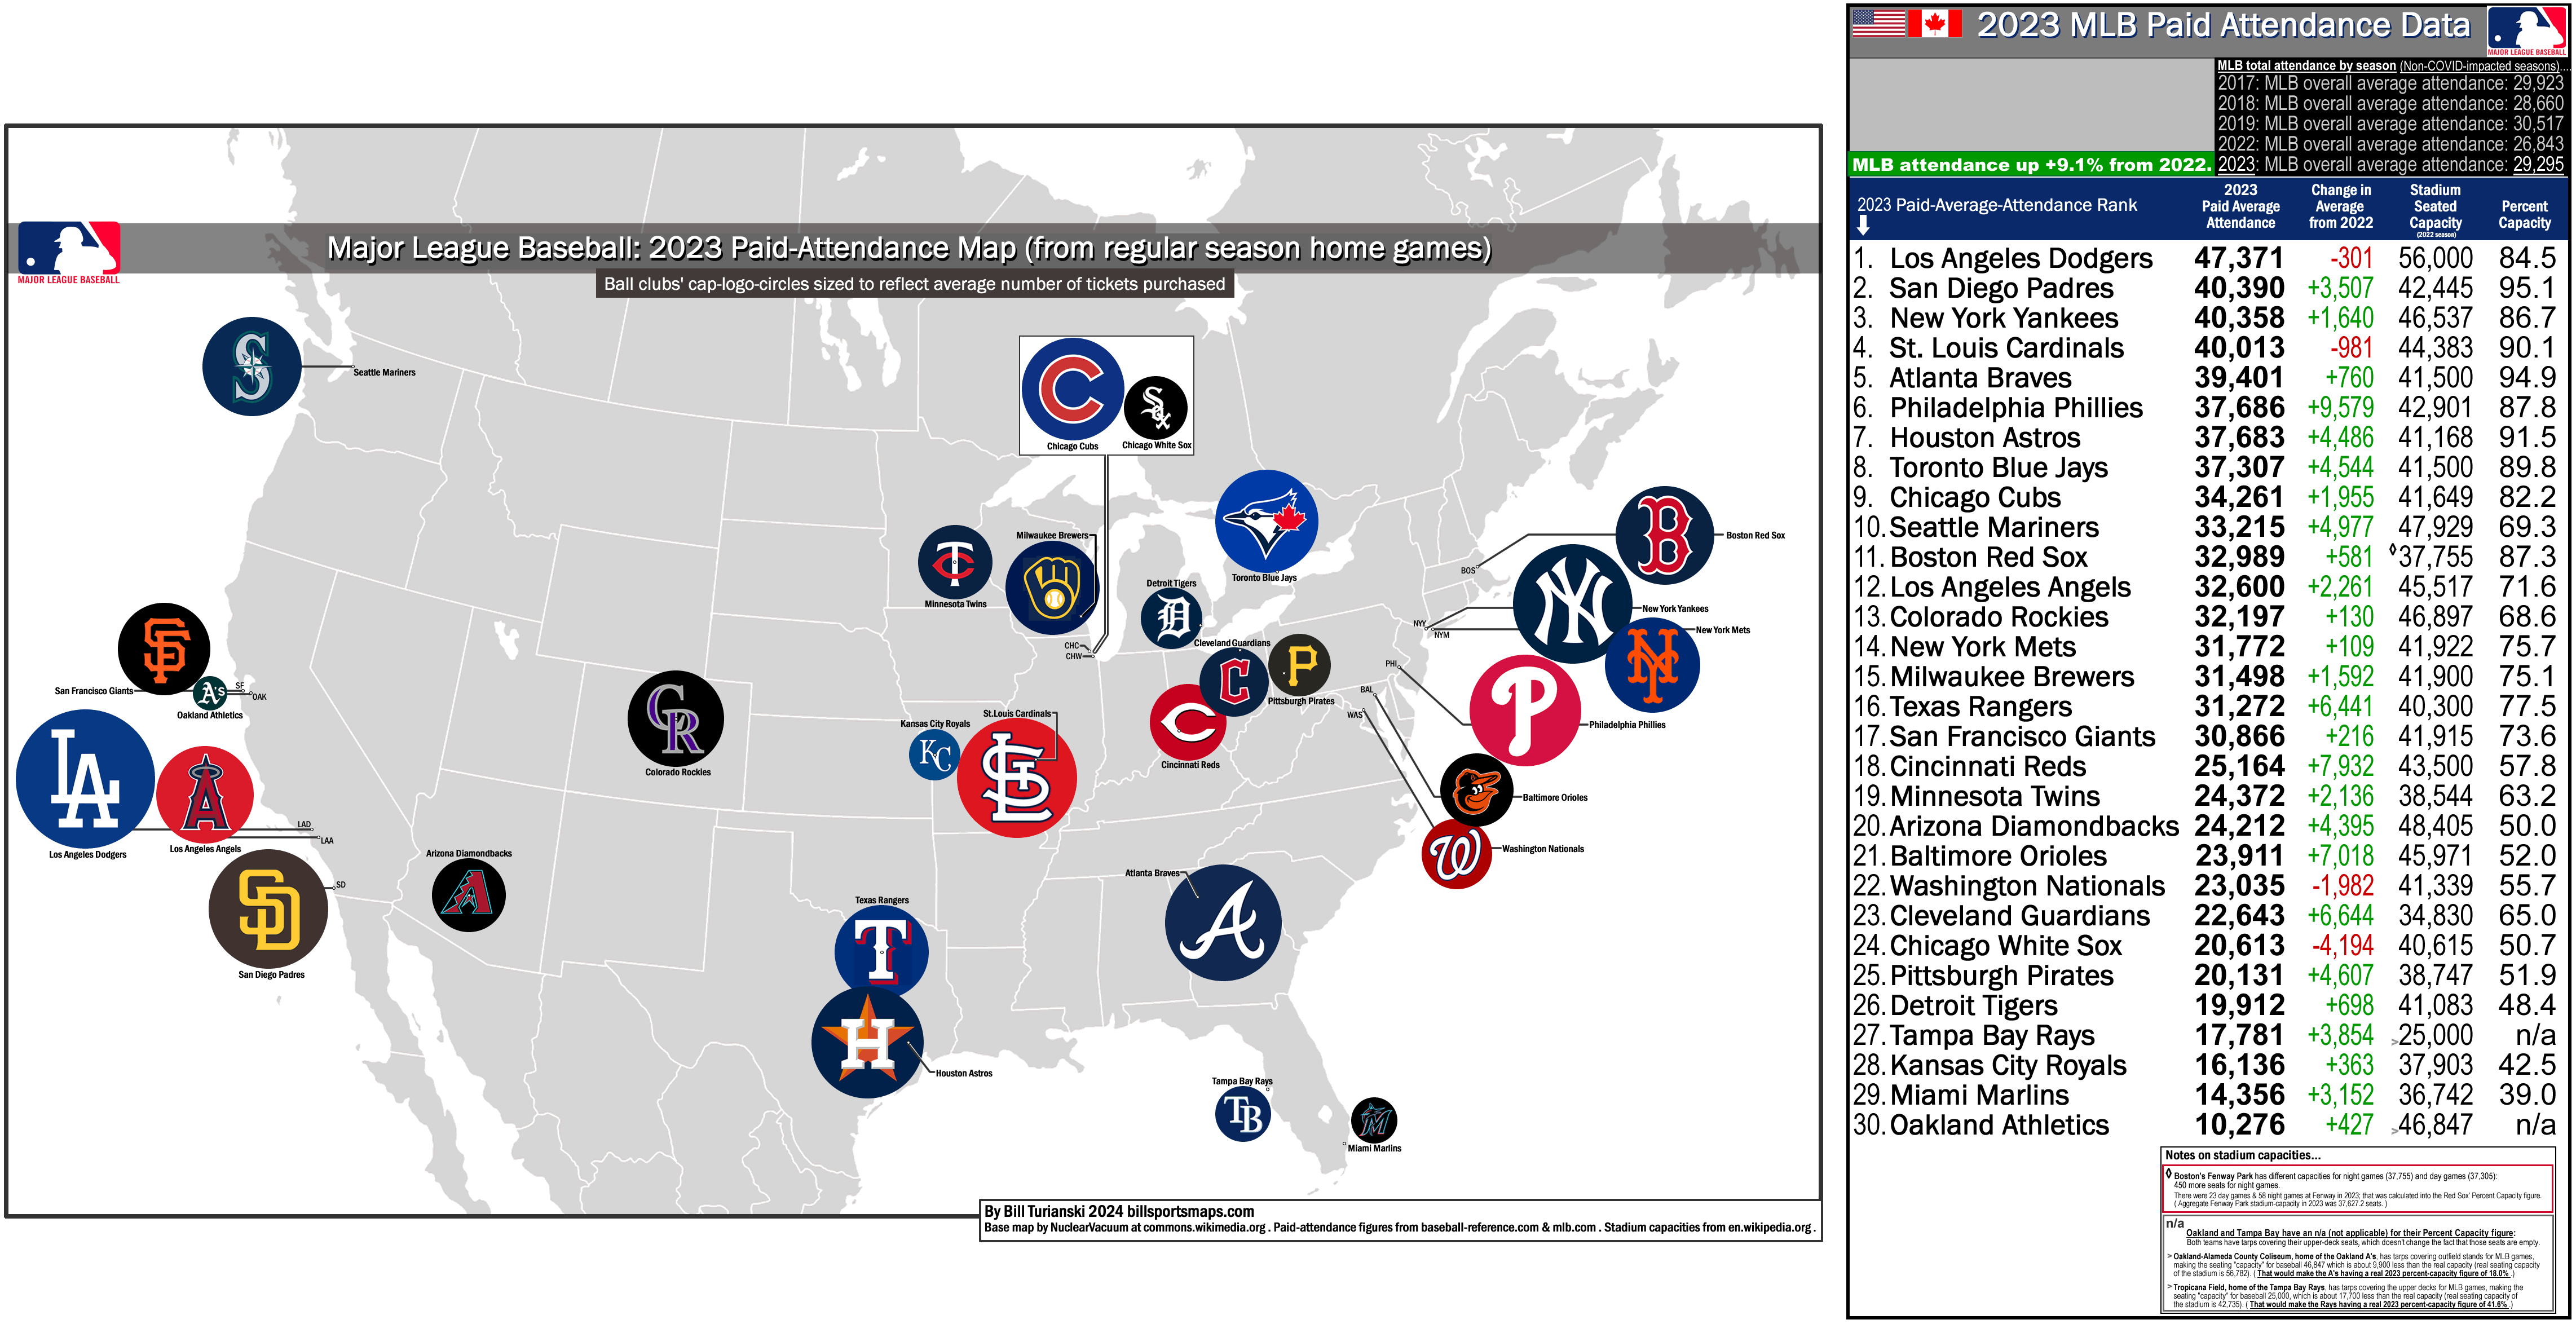
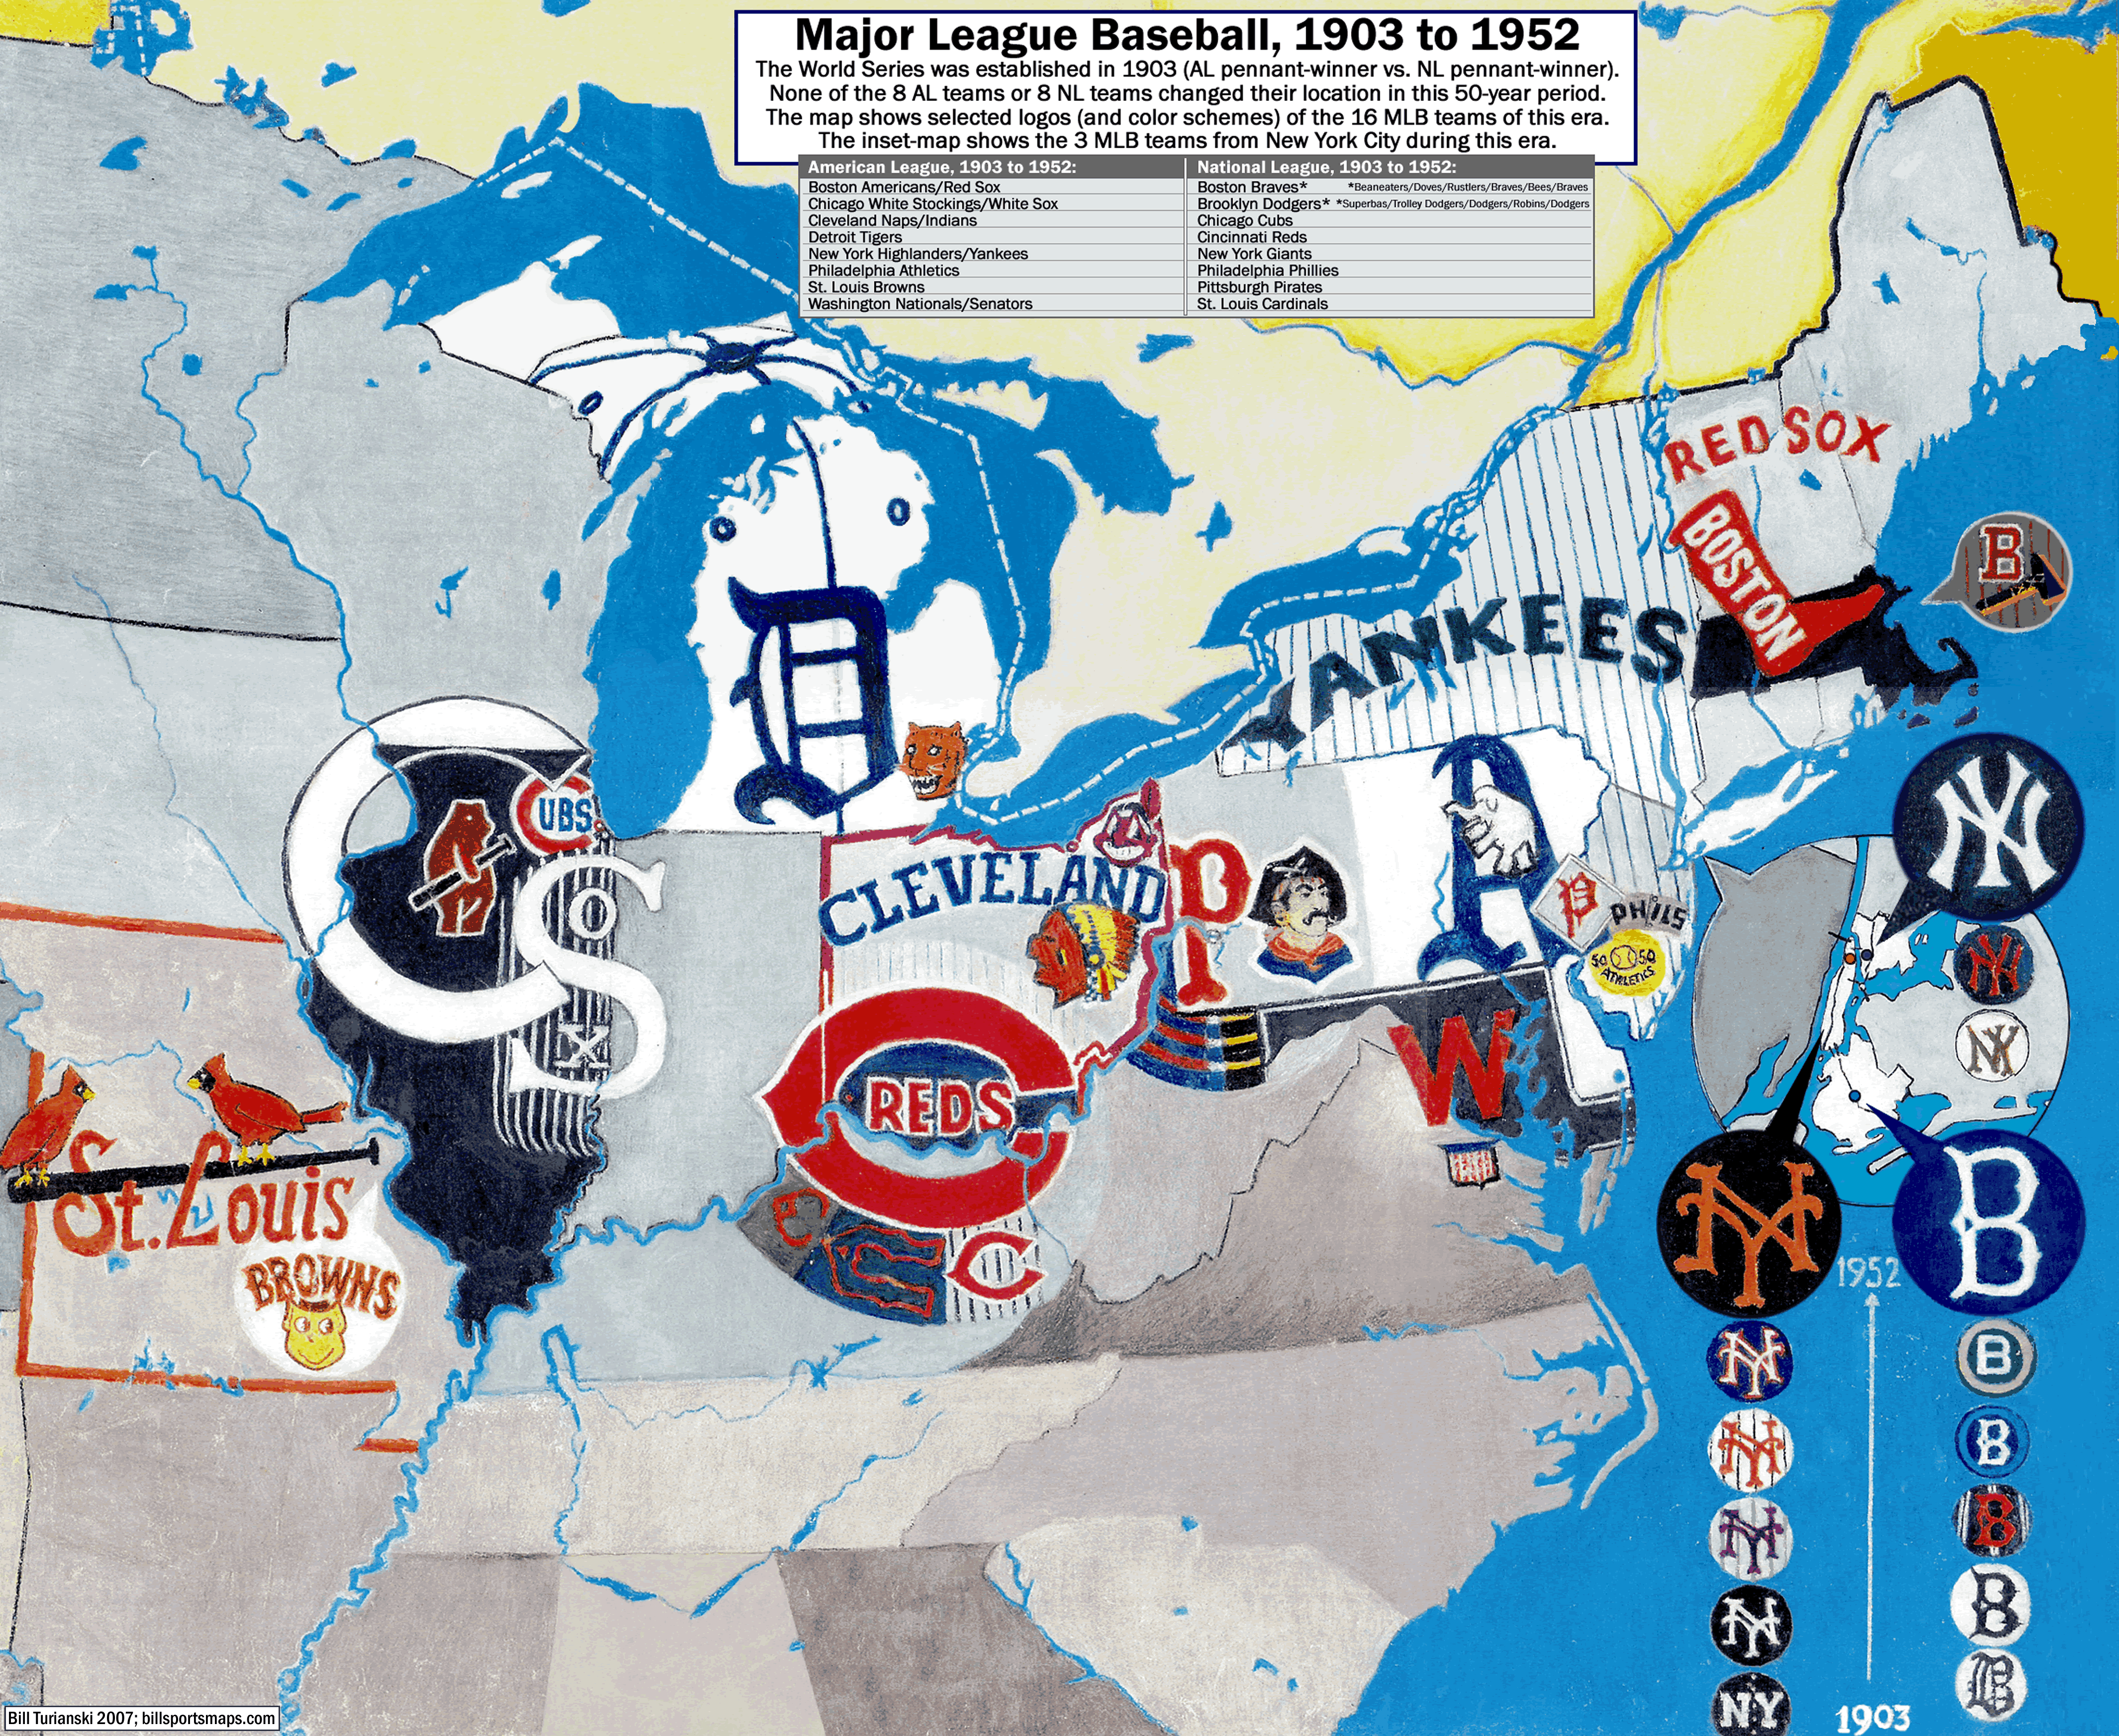
The map shows the locations of the 24 MLB teams of 1971.
On the map, next to each MLB team’s location-dot there are 3 things: their cap-logo, one of their 1971 jersey-logos (either home or away jersey), and a rectangular box (listing: ballpark, win total in 1971, and home average attendance in ’71). All but one of the jersey-logos are from photos of the old jerseys (see 23 photo credits at the foot of this post); one jersey-logo – the Detroit Tigers’ 1971 away jersey-logo – I drew myself.
The jersey-logo: sized to reflect that team’s 1971 average attendance. The larger the jersey-logo, the higher their attendance. Any other logos on the team’s uniforms in 1971 are also shown. Specifically, shoulder-patch-logos, of which there were 9 of such in 1971: the White Sox [in 1971-75 colors: red-white-powder blue], the Angels, the Astros, the Braves, the Cubs, the Royals, the Indians, the Mets, and the Twins.
1971 Team Average Attendance: shown at the right-hand side of the map-page. For the third straight year, the best-drawing MLB team in 1971 was the New York Mets, who drew 27.9-K per game at the then-8-year-old Shea Stadium in Queens, New York City, NY. This year was the peak of the Mets’ outdrawing the then-moribund New York Yankees: 1971 was the second-straight year the Mets were drawing double that of the Yankees (Mets at 27.9-K-per-game, the Yankees at a meagre 13.2-K). From the mid-Sixties to the mid-Seventies, the Mets ended up outdrawing the Yankees for 12 seasons (1964 to ’75). Second-best drawing ball club in 1971 was the Los Angeles Dodgers, at 25.4-K-per-game. Two other teams drew above 20-K: the Boston Red Sox and the Chicago Cubs.
The worst drawing clubs in 1971 were the Padres, the Indians, the Senators, and the Brewers, all of whom drew below 10-K. It was worrying that two of these poor-drawing teams were only two or three years, old (Padres, est. 1969; Brewers est. 1970). And the twelve-year-old Washington Senators (II), who drew 8.0-K in 1971, would depart the nation’s capital after the ’71 season, and move to Dallas/Fort Worth, Texas, as the Texas Rangers (est. 1972). On the map-page here, I have shown the 1972-franchise-shift of Washington Senators (II) to Texas Rangers, using a long pale-gray line-segment with arrows pointing to their new location in Arlington, Texas.
Section for the 1971 MLB champions, the Pittsburgh Pirates: at the top of the map-page. I featured photos of the 13 players on the ’71 Pirates with the highest WAR [Wins Above Replacement], plus the their manager, Danny Murtaugh. Photo credits are at the foot of this post. The players are: Willie Stargell (LF & HoF), Roberto Clemente (RF & HoF), Manny Sanguillén (C), Bob Robertson (1B), Steve Blass (RHP), Al Oliver (OF/1B), Gene Clines (OF/PH), Dave Cash (2B/3B), Nelson Briles (RHP), Richie Hebner (3B), Dock Ellis (RHP), Rennie Stennett (2B/PH), Milt May (C).
1971 MLB Statistical Leaders: at the foot of the map. (In both the American League and the National League.) Leaders in the following categories: ERA, Wins, WAR for Pitchers; Batting Average, Home Runs, RBIs, WAR for Position Players. A photo of each player is shown, with stats; photo credits are at the foot of this post.
…
…
-
1971 World Series – Pittsburgh Pirates beat Baltimore Orioles in 7 games.
The Baltimore Orioles, the reigning MLB champs, had just completed their third straight AL playoff series sweep (twice over the Minnesota Twins, and then in ’71 over the Oakland A’s). And the Orioles had just finished their third straight season with over 100 wins. The O’s were tied with the NY Mets for the best team-ERA in 1971 (at 2.99), and featured four pitchers who were 20-Game Winners: Dave McNally, Mike Cuellar, Pat Dobson, and future-Hall-of-Famer Jim Palmer (10th-best ERA in ’71 at 2.63). Baltimore scored the second-most Runs in 1971, and their offense was powered by two sluggers: future-Hall-of-Famer Frank Robinson (OF), and Boog Powell (1B). In 1971, two Orioles were in the top 7 of American Leaguers for WAR [Position players]: Frank Robinson and OF/PH Merv Rettenmund. And the Orioles had a solid defensive unit, with future-Hall-of-Famer Brooks Robinson at Third Base, and 8-time Gold Glove-winner Mark Belanger at Shortstop. Baltimore’s manager was the wily Earl Weaver (who managed the Orioles for 17 years (1968–1982; 1985–86). The Baltimore Orioles were the heavy favorites to win the ’71 World Series.
The Pittsburgh Pirates had last won the World Series in 1960 (in an upset win over the NY Yankees). In ’71, Pittsburgh won the NL East by 7 games over St. Louis; in the playoffs they beat San Francisco 3 games to 1.
On September 1 1971, the Pirates had fielded the first all-minority line-up (Rennie Stennett, Gene Clines, Roberto Clemente, Willie Stargell, Manny Sanguillen, Dave Cash, Al Oliver, Jackie Hernandez, Dock Ellis and Bob Veale). Which was a long 24 years after Jackie Robinson had first broke the color barrier, back in 1947. This came as a result of the fact that Pirates front office and General Manager Joe L. Brown ignored the de-facto rule of the day, of racial quotas. MLB teams put a few black and Latin players in starting roles, leaving benches of MLB teams full of white players. In the MLB in the 1950s and the ’60s, teams had two or three or four minority players, maybe five or six, but almost always, never more than six (an exception being the NL-pennant-winning San Francisco Giants of 1962, who had 8 minority players on their roster, including Willie Mays, Felipe Alou, Juan Marichal, Orlando Cepeda, and José Pagán, all 5 of which were in the SF Giants top-12-for-WAR that year).
In The Team that Changed Baseball – Roberto Clemente and the 1971 Pittsburgh Pirates, Bruce Markusen writes, ‘In general, very few African-American and Latino players made major league rosters as utility players. It was clear that most teams in the fifties and the sixties were operating under another unwritten rule: an African American or Latino had to be considered a star, or at least good enough to make it as a starter, to be included on the roster – at all.”
The Pirates refused to follow that vestige of segregation. The Pirates scouted extensively in the Caribbean and in Central America for black and Latin players to fill any role (including leadership roles), and at any position, and not just as marquee players. Joe L. Brown was Pirates GM from 1955 to 1976. Brown took over the General Manager’s job in Pittsburgh from Branch Rickey, in November 1955, when Rickey retired. Branch Rickey is the man who was the most instrumental in breaking the color barrier, by convincing the Brooklyn Dodgers Board of Directors to start looking for a black ballplayer to sign (this was in 1943), and then signing Jackie Robinson for the Brooklyn Dodgers in 1946.
In 1971, the list of the 12 top players on each MLB team (as measured by WAR), showed almost all MLB teams having 3 or 4 minority players in their top-12-for-WAR. Two teams had 5 minority players in their top-12-for-WAR: the Minnesota Twins and the San Francisco Giants. The Pittsburgh Pirates had 8 minority players in their top-12-for-WAR.
The 1971 Pirates were not especially dominant in terms of pitching, with the 11th-best ERA (5th-best in the NL). They featured 19-game winner Dock Ellis, 15-game winner Steve Blass (2.85 ERA) and closer Dave Giusti (with the most Saves in the NL, 30). The real strength of the ’71 Pirates was in their offense: they scored the most Runs and had the best Slugging Percentage. They featured three sluggers: future-Hall-of-Famer Willie Stargell in Left Field (.295, 48, 125), Bob Robertson at 1st Base (.271, 26, 72) and Richie Hebner at 3rd Base (.271, 17, 67). And they featured 3 who could hit for average: future-Hall-of-Famer Roberto Clemente in Right Field (.341, 13, 86), Al Oliver in Center (.282, 14, 64), and the Panama-born Manny Sanguillen behind the plate (.319, 7, 81). On the 1971 Pirates’ roster were two players who remained from their 1960 championship team, Roberto Clemente, and, in a utility role, the 1960 World Series MVP Bill Mazeroski (2B) [inducted into the Hall of Fame in 2001]. The 1971 Pirates’ manager was the same who had led the team in 1960 – the Chester, Pennsylvania-born Danny Murtaugh, who was well liked by players. Murtaugh would serve for 15 seasons, in 4 stints, as the Pirates’ skipper (the gap-years being for health reasons) (1957-64, 1967, 1970-71, 1973-76).

Photo and Image credits above – Aerial shot of Three Rivers Stadium [circa 1970], photo by Pittsburgh Post-Gazette at post-gazette.com/sports. -Exterior shot of Baltimore’s Municipal Stadium, 1971 NBC World Series broadcast, screenshot from video uploaded by Stephen Alexander at youtube.com. -Merv Rettenmund, screenshot from video uploaded by Stephen Alexander at youtube.com. -Jim Palmer, screenshot from video uploaded by Stephen Alexander at youtube.com. -Bob Robertson, photo unattributed at ebay.com. -Bruce Kison, screenshot from video uploaded by Stephen Alexander at youtube.com. -Nelson Briles, photo by Focus on Sport via Getty Images via gettyimages.com. -Brooks Robinson, photo by Tony Triolo/Sports Illustrated via Getty Images via gettyimages.com. -Steve Blass, photo from National Baseball Hall of Fame and Museum at baseballhall.org. -Roberto Clemente, photo unattributed at bucsdugout.com. -Pirates players celebrating after the final out, screenshot from video uploaded by Stephen Alexander at youtube.com.
Game 1: Orioles win, 5-3.
Merv Rettenmund hit a 3-run HR in the 3rd inning, and Dave McNally pitched a 3-hit, 3-run Complete Game. Win: Dave McNally.
Game 2: Orioles win, 11-3
The Orioles pounded the six Pirates pitchers w/ 14 hits (all singles). Jim Palmer went 8 innings, the first 7 scoreless. Win: Jim Palmer; Save: Dick Hall.
Game 3: Pirates win, 5-1
Bob Robertson hit a 3-run HR in the 7th inning, and Steve Blass pitched a 3-hit, 1-run Complete Game. Win: Steve Blass.
Game 4: Pirates win, 4-3
First-ever World Series night game. O’s scored 3 in the 1st; then Bruce Kison pitches 6⅓ scoreless innings. Game-winning-RBI by backup-C Milt May. Win: Bruce Kison; Save: Dave Giusti.
Game 5: Pirates win, 4-0
Nelson Briles pitched a 2-hit shutout, and had an RBI. Bob Robertson hit his 2nd HR of the Series. Win: Nelson Briles.
Game 6: Orioles win, 3-2 (10)
The Orioles win it in 10 innings, on a sacrifice fly by Brooks Robinson, with Frank Robinson scoring on a close play at the plate. Win: Dave McNally (2-0).
Game 7 Pirates win, 2-1, and win the Series 4 games to 3
A pitcher’s duel between the Orioles’ lefty Mike Cuellar, and the Pirates’ Steve Blass. In the 4th inning, Series MVP Roberto Clemente hit his 2nd HR. In the top of the 8th, Pirates backup-3B José Pagán doubled to score Willie Stargell. In the bottom of the 8th, the O’s got their only run, on a ground-out-RBI by Don Buford. Winning Pitcher: Steve Blass, who went all 9 innings, again, and finished the Series at an MVP-worthy 2-0, 18 IP, 1.00 ERA.
Roberto Clemente: 1971 World Series MVP
12-29, 3 R, .414 BAvg, 2 2B, 1 3B, 2 HR, 4 RBI, 1.210 OPS.
…
…
Jersey-logo photo credits -
-Atlanta Braves 1970 home jersey, photo from Heritage Auctions at sports.ha.com.
-Baltimore Orioles 1971 jersey, photo from customthrowbackjerseys.com.
-Boston Red Sox 1971 road jersey, photo from Heritage Auctions at sports.ha.com.
-California Angels 1971 road jersey, photo from Heritage Auctions at sports.ha.com.
-Chicago Cubs 1970 road jersey, from Heritage Auctions at sports.ha.com.
-Chicago White Sox 1970 road jersey, photo from Heritage Auctions at sports.ha.com.
-Cincinnati Reds 1970 home jersey photo from Heritage Auctions at sports.ha.com.
-Cleveland Indians 1970 home jersey, photo from worthpoint.com.
-Houston Astros 1971 road jersey, photo from Heritage Auctions at sports.ha.com.
-Kansas City Royals 1971 road jersey, photo from goldinauctions.com.
-Los Angeles Dodgers 1971 road jersey, photo from lofty.com.
-Milwaukee Brewers 1970 road jersey, photo from Heritage Auctions at sports.ha.com.
-Minnesota Twins home jersey circa 1968-71, photo from lelands.com.
-Montreal Expos 1970 road jersey, photo from goldinauctions.com.
-New York Mets 1970 jersey, photo from Heritage Auctions at sports.ha.com.
-New York Yankees road jersey circa 1967-71, photo from customthrowbackjerseys.com.
-Oakland A’s road uniform-logo, photo from worthpoint.com.
-Philadelphia Phillies 1971 road jersey, photo from Heritage Auctions at sports.ha.com.
-Pittsburgh Pirates 1971 home jersey, photo from robertedwardauctions.com.
-San Diego Padres 1970 road jersey, from lelands.com.
-San Francisco Giants 1970 home jersey, photo from Heritage Auctions at sports.ha.com.
-St. Louis Cardinals 1971 road jersey, photo from Heritage Auctions at sports.ha.com.
-Washington Senators 1970 home jersey, photo from Heritage Auctions at sports.ha.com.
…
1971 Pittsburgh Pirates players: photo and image credits…
-1971 Pittsburgh Pirates home jersey, from robertedwardauctions.com. 1971 Pittsburgh Pirates road jersey, from mlbshop.com/pittsburgh-pirates. -Willie Stargell, photo by Focus on Sport via Getty Images via gettyimages.es. -Roberto Clemente, photo unattributed at cowlatinamerica.voices.wooster.edu. -Manny Sanguillén, photo by Focus on Sport via Getty Images via gettyimages.com. -Bob Robertson, photo by Focus on Sport via Getty Images via gettyimages.com. -Steve Blass, 1971 Sports Illustrated cover via mbird.com. -Al Oliver, unattributed at pinterest.com. -Gene Clines, photo unattributed at history.pittsburghbaseball.com. -Dave Cash, 1971 Topps card via vintagecardprices.com. -Nelson Briles, photo from Pittsburgh Pirates via oldbucs.blogspot.com. -Richie Hebner, photo unattributed at pinterest.com. -Dock Ellis, photo unattributed at gameusedonly.com. -Rennie Stennett, photo unattributed at pinterest.com via usdaynews.com. -Milt May, photo unattributed at ebay.com. -Danny Murtaugh (manager), photo by Focus on Sport via Getty Images via gettyimages.in. -1971 Pittsburgh Pirates uniforms [illustrations], by Marc Okkonen at exhibits.baseballhalloffame.org/dressed_to_the_nines.
…
Photos of 1971 MLB leaders on map page…
-Vida Blue, photo unattributed at dglsports.ca.
-Tom Seaver, 1971 Topps card, at pinterest.com.
-Mickey Lolich, photo by Focus on Sport/Getty Images via gettyimages.com.
-Ferguson Jenkins, August 20 1971 Sports Illustrated cover, via gettyimages.com.
-Wilbur Wood, photo by Diamond Images/Getty Images via southsidesox.com.
-Tom Seaver, photo by Malcolm Emmons/USA Today Sports via amazinavenue.com.
-Tony Oliva, photo by SPX/Diamond Images via Getty Images via gettyimages.com.
-Joe Torre, 1972 Street and Smith’s Baseball magazine, photo by Sporting News via Getty Images via gettyimages.com.
-Bill Melton, photo by Doug McWilliams/National Baseball Hall of Fame and Museum at baseballhall.org.
-Willie Stargell, photo by Tony Tomsic/Getty Images via gettyimages.com.
-Harmon Killebrew, photo unattributed at baberuthmuseum.org.
-Joe Torre, photo unattributed at pinterest.com.
-Graig Nettles, photo unattributed at pristineauction.com.
-Willie Stargell, August 2 1971 Sports Illustrated cover, from sicovers.com.
___
Thanks to all at the following links…
-Base map, by US federal government employee at commons.wikimedia.org/wiki/File:StatesU.svg.
-Baseball-Reference.com.
-1971 Major League Baseball season (en.wikipedia.org).


![exhibits.baseballhalloffame.org/dressed_to_the_nines/[1968 Detroit]](http://exhibits.baseballhalloffame.org/dressed_to_the_nines/detail_page.asp?fileName=al_1968_detroit.gif&Entryid=1115)
![exhibits.baseballhalloffame.org/dressed_to_the_nines/[1967 St. Louis]](http://exhibits.baseballhalloffame.org/dressed_to_the_nines/detail_page.asp?fileName=nl_1967_stlouis.gif&Entryid=1105)
![exhibits.baseballhalloffame.org/dressed_to_the_nines/[al_1929_philadelphia]](http://exhibits.baseballhalloffame.org/dressed_to_the_nines/detail_page.asp?fileName=al_1929_philadelphia.gif&Entryid=467)