billsportsmaps.com

February 8, 2019

All-time La Liga (Spain/1st division): List of all clubs with at least one season in the Spanish 1st division (88 seasons/since 1929/63 clubs); with Spanish titles listed.

Filed under: Football: All-time 1st Div,Spain — admin @ 9:45 am

spain_1st-division_la-liga_88-seasons_chart-of-all-time-most-seasons-in-spanish-1st-div_by-club_w-seasons_consec_titles_colours-and-crest_post_k_.gif
All-time La Liga (Spain/1st division): List of all clubs with at least one season in the Spanish 1st division (88 seasons/since 1929/62 clubs); with Spanish titles listed.


By Bill Turianski on 8 February 2019; twitter.com/billsportsmaps.

Sources…
-Spanish Premier Division All-Time Table 1928-2018 (87 Leagues) [up to 2017-18] (rsssf.com).
-Anexo:Clasificación histórica de la Primera División de España [up to 2017-18] (es.wikipedia.org).
-La Liga/Performance by club [titles] (en.wikipedia.org).
-laliga.es/kits-for-2018-19.

-Links to my other All-time 1st division charts [2018-19 season]
-England: All-time Football League/Premier League (since 1880-81).
-Italy: All-time Serie A (since 1929-30.
-Germany: All-time Bundesliga (since 1963-64).

    This chart is for All-time Spanish 1st division: total seasons by club.

{Click on image at the top of this post.}
Going from left to right on the chart, here is what is listed on the chart…
1). Name of club.
2). Level (aka division) that the club is in, currently [2018-19].
3). Crest & colours [home colours from 2018-19].
4). Seasons in Spanish 1st Division (La Liga): 88 seasons (1929 to 1935-36; 1939-40 to 2018-19).
5). Consecutive seasons in the 1st division [current/2018-19] – OR – Last season that the club was previously in the 1st division.
6). La Liga clubs for 2018-19 are shown with crest and small home kit illustration [tan column down the middle of the chart].
7). Full name of club.
8). La Liga titles: Spanish titles [87 seasons] (1929-2018). Only 9 clubs have won the Spanish title.

There are 63 clubs that have played in the Spanish first division since it was established in 1929. Three clubs that were founding members have played all 88 seasons, and have never been relegated – Real Madrid, Barcelona, and Athletic Club [Bilbao]. Ten clubs that have played in the Spanish 1st division are defunct.

Below are the 25 clubs in Spain with the most seasons played in the Spanish 1st division (La Liga)…
List below includes 4 things:
1) Seasons in 1st Division [divisional status in 2018-19 is noted, if club is not currently in 1st Div]. 2) Location. 3) Colours. 4) Average attendance (and attendance-change from 2017-18) {figures from 7 Feb 2019; source: soccerway.com }.

Joint-1st: Athletic Club [Bilbao]. 88 seasons. From Bilbao, the capital and largest city in the Basque Country. Colours: Red-and-White stripes with Black. 40.6 K per game (up +3.2 K).

Joint-1st: Barcelona. 88 seasons. From Barcelona, the 2nd-largest city in Spain, and the capital of the autonomous community of Catalonia; they are located in the western part of the city, in the district of Les Corts. Colours: Dark-Blue-and-Garnet-Red stripes with Gold trim. 73.8 K per game (highest-drawing club in Spain) (up +8.0 K).

Joint-1st: Real Madrid. 88 seasons. From Madrid, the largest city and capital of Spain; they are located in the wealthy Chamartín district in downtown Madrid. Colours: All-White with various random trim colours. 62.3 K per game (2nd-highest-drawing club in Spain) (down -3.2 K).

Joint-4th: Valencia. 84 seasons. From Valencia, the 3rd-largest city in Spain, and the capital of the the autonomous community of Valencia. Colours: White with Black. 39.3 K per game (up +0.6 K).

Joint-4th: Espanyol. 84 seasons. From Cornellà de Llobregat, which is in the south-west of Greater Barcelona. Colours: Blue-and-White stripes. 18.6 K per game (up +0.9 K).

6th: Atlético Madrid. 82 seasons. From Madrid, located east of the city-centre, in the Rosas neighborhood of the San Blas-Canillejas district. Colours: Red-and-White stripes with Blue. 57.0 K per game (up +1.5 K).

7th: Sevilla. 75 seasons. From Seville, the 4th-largest city in Spain, and the capital of the autonomous community of Andalusia. Colours: All-White with Red trim and Black socks. 36.4 K per game (up +3.3 K).

8th: Real Sociedad. 72 seasons. From the city of San Sebastián, in the Basque Country, about 12 miles (20 km) from the French border. Colours: Blue-and-White stripes. 22.3 K per game (up +2.6 K).

9th: Zaragoza. 58 seasons. [Currently in the 2nd division.] From Zaragoza, in the autonomous community of Aragorn (in northeastern Spain). Colours: White with Dark-Blue. 20.9 K per game [highest-draw in the 2nd division] (up +2.2 K).

Joint-10th: Celta Vigo. 53 seasons. From Vigo, in the autonomous community of Galicia, in northwest Spain. Colours: Pale Blue with White. 16.2 K per game (up +0.5 K).

Joint-10th: Betis. 53 seasons. From Seville, Andalusia. Colours: Bright-Green and White. 47.2 K per game [4th-highest-drawing team in Spain, currently] (up +0.7 K).

12th: Deportivo La Coruña. 46 seasons. [Relegated in 2018, and currently in the 2nd division.] From A Coruña, in Galicia, in northwest Spain. Colours: Blue-and-White stripes. 16.6 K per game (down -4.0 K).

13th: Racing Santander. 44 seasons. [Currently in the 3rd division.] From Santander, the capital of the autonomous community of Cantabria, on the north coast of Spain. Colours: Green with Black. Their current attendance is unavailable, because the Spanish 3rd division does not report attendance figures.

14th: Valladolid. 43 seasons. [Promoted to 1st division in 2018.] From Valladolid, in the autonomous community of Castile and León (which is in north-central Spain). Colours: Pale-Purple-and-White stripes. 18.2 K per game (up +7.7 K).

15th: Sporting Gijón. 42 seasons. [Currently in the 2nd division.] From Gijón, the largest city in the autonomous community of Asturias (in northern Spain). Colours: Red-and-White stripes with Blue. 19.3 K per game (down -1.3 K).

16th: Oviedo. 38 seasons. [Currently in the 2nd division.] From Oviedo, the capital of Asturias (in northern Spain). Colours: Blue with White. 13.9 K per game (about the same as last season).

17th: Osasuna. 37 seasons. [Currently in the 2nd division.] From Pamplona, Navarre (which is the capital of the autonomous community of Navarre, and is the 2nd-largest city in the Greater Basque cultural region). Colours: Red with Dark-Blue. 13.9 K (up about 0.1 K).

18th: Las Palmas. 34 seasons. [Relegated in 2018, and currently in the 2nd division.] From the Canary Islands (in the Atlantic Ocean, located about 60 miles (~100 km) west of Morocco]. Colours: Yellow with Blue. 13.7 K per game (down -2.3 k).

19th: Mallorca. 27 seasons. [Currently in the 2nd division; promoted from 3rd div in 2018.] From Palma, which is in the Balearic Islands (an archipelago off the coast of eastern Spain in the Mediterranean Sea). Colours: Red with Black. 7.5 K per game (attendance change from 2017-18 unavailable, due to Mallorca being in the 3rd tier last season).

20th: Granada. 23 seasons. [Currently in the 2nd division.] From Granada, at the foot of the Sierra Nevada mountains in Andalusia. Colours: Red-and-White stripes with Blue. 10.1 K per game (down -0.7 K).

21st: Elche. 21 seasons. [Currently in the 2nd division; promoted from 3rd div in 2018.] From Elche, which is in the southern part of the Valencian autonomous community. Colours: White with Green trim. 9.6 K per game (attendance change from 2017-18 unavailable, due to Elche being in the 3rd tier last season).

Joint-22nd: Hércules. 20 seasons. [Currently in the 3rd division.] From Alicante, a city in the southern part of the Valencian autonomous community. Colours: Blue-and-White with Black. Their current attendance is unavailable, because the Spanish 3rd division does not report attendance figures.

Joint-22nd: CD Málaga (1904-92/defunct). 20 seasons. Club was dissolved in 1992; replaced by current-2nd-division side CF Málaga (who have played 17 seasons in the Spanish 1st division).

24th: Villarreal. 19 seasons. From the small city of Villarreal (population of around 51,000), located about 40 miles (65 km) north of Valencia. Colours: All-Yellow with Blue trim. 16.3 K per game (down -0.3 K).

25th: Rayo Vallecano. 18 seasons. [Promoted to 1st division in 2018.] From the neighborhood of Vallecas, in Punte de Vallecas, which is a district in the southeast of Madrid. Colours: White-with-Red-sash and Black. 11.8 K per game (up +2.4 K).

___
Thanks to all at the links below…
Sources:
-Spanish Premier Division All-Time Table 1928-2018 (87 Leagues) [up to 2017-18] (rsssf.com).
-Anexo:Clasificación histórica de la Primera División de España [up to 2017-18] (es.wikipedia.org).
-La Liga/Performance by club [titles] (en.wikipedia.org).
-laliga.es/kits-for-2018-19.
-Small kit illustrations from each team’s page at en.wikipedia.org.

January 30, 2019

NFL 1962 season, map with helmets/jerseys & final standings + offensive stats leaders; champions: Green Bay Packers./+ Chart: NFL teams’ helmet-logos and changes in design in a 10-year span (1953 to 1962 seasons).

Filed under: NFL>1962 map/season,NFL/ Gridiron Football — admin @ 3:07 pm

nfl_1962_map-with-helmets_1962-standings_offensive-stats-leaders_home-jerseys_green-bay-packers-champs_post_e_.gif
NFL 1962 season, map with helmets/jerseys & final standings + offensive stats leaders


By Bill Turianski on 30 January 2019; twitter.com/billsportsmaps.
Links…
-1962 NFL season
-1962 NFL Championship Game (en.wikipedia.org).
-1962 NFL season (pro-football-reference.com).
-1962 NFL uniforms (gridiron-uniforms.com).

    In 1962, the Green Bay Packers repeated as champions.
    This was start of the Packers historic run of 5 NFL titles in 7 seasons (1961, 1962, 1965, 1966, 1967).

The season before, in 1961, the Green Bay Packers, under third-year head coach Vince Lombardi, had won their first NFL title in 18 years (their last title had been won in 1944). In the 1961 NFL title game, the small-town Packers had demolished the big-city New York Giants 36 to 0, at the then-4-year old City Stadium [now called Lambeau Field] in Green Bay, WI. (Population of Green Bay in 1960: 62,000 {en.wikipedia.org/wiki/Green_Bay,_Wisconsin#Demographics}.) Although the Packers had a decent new stadium, one which was capable of expansion, the fact still remained that the Green Bay NFL franchise was the last vestige of the small-town era of the NFL (1920-34).

The small-town Green Bay Packers were a team that played in a league that was becoming exponentially more popular each year. Every NFL or AFL team in 1962 played in a city that was at least 10 times larger than tiny and isolated Green Bay. Even the creation of the new rival-league the AFL, which started up in 1960 with 8 teams, had not changed that fact. (The NFL had 14 teams as of 1962, so by 1962, there were 22 major-league pro football teams in the USA.) Yet by 1962, many cities ten times the size of Green Bay still did not have an NFL or AFL team, and they were clamoring for one.

1962 NFL Championship Game – Green Bay Packers 16, New York Giants 7.
In 1962, both the Packers and the Giants had repeated as conference [divisional] winners. The Packers went 13-1, winning the West by 2 games and losing only to the 2nd-place-finishing Lions. The Giants went 12-2, winning the East by 3 games, with losses to the 2nd-place Steelers and to the 3rd-place Browns. The Packers’ offense, which was the league’s best in ’62 (at 29.6 points per game) was built on a strong ground game. The Packers starting QB was Bart Starr, and they were led offensively by FB Jim Taylor, and HB/K Paul Hornung, but Hornung was partially injured in 1962. Jim Taylor led the league in rushing yards, yards from scrimmage, and TDs, and was voted the NFL’s MVP in 1962. The Packers’ main receiving threat was WR/P Max McGee, and TE Ron Kramer was an All-Pro in ’62. The Packers’ defense was best in the league as well, allowing just 10.5 points per game. There were 5 All-Pros in the 1962 Packers’ D: linemen Willie Davis and Henry Jordan, LBs Bill Forester and Dan Currie, and CB/KR Herb Adderley. The Giants were almost as high-scoring as the Packers (at 28. 4 ppg). The Giants were led at QB by former 49er YA Tittle, and Tittle led the NFL in TD passes in 1962. Tittle’s main targets were End Del Shofner, HB Frank Gifford, and TE Joe Walton. The Giants were coached by Allie Sherman, who was in his second season.

Due to the rotating home-field-advantage rule in the NFL back then, it was the Eastern Conference’s turn to host the NFL title game, so that meant the New York Giants would be playing the Packers at Yankee Stadium in The Bronx, NY, on Sunday, December 30, 1962. (It was the 3rd time in 7 years that Yankee Stadium hosted the NFL title game [previously in 1956 and 1958].) Green Bay was favored by 6½ points.

(Yankee Stadium was where the Brooklyn-born Vince Lombardi, former Offensive coach of the Giants (from 1954-58), had first established his pro football coaching credentials. That is why the Packers-at-Giants 1962 NFL title game was so important to Lombardi.)

The game was played under severely cold conditions: temperature was 17 °F (−8 °C), with 35 mph winds. The conditions made throwing the ball difficult.

The game was a hard-fought and low-scoring affair. Although the NY Giants slightly out-gained the Packers, Green Bay caused 3 turnovers (2 fumbles and one interception). Packers MLB Ray Nitschke (#66) recovered both fumbles, and Nitschke also had a pass deflection which caused the interception. Nitschke was selected as MVP of the game. Packers FB Jim Taylor (#31) ran for 85 yards, plus he gained 20 yards receiving, and Taylor scored the Packers’ only TD. The Packers defense did not allow New York to score on them (the Giants’ TD was scored by their special teams, off a blocked punt in the 3rd quarter).

The Packers’ Guard Jerry Kramer (#64) was also their replacement Kicker in 1962. (Kramer replaced partially-injured HB/K Paul Hornung.) In the 1962 NFL title game, Jerry Kramer’s kicking game proved to be the difference, as he converted all 3 of his FG attempts (of 26, 29, and 30 yards). Those 3 Field Goals were no chip-shots, due to the 35-40 mph winds. Here is an article, {Packers vs. Giants in the 1962 NFL Championship Game: Jerry Kramer Does It All, by Bob Fox at bleacherreport.com from Nov. 2011.} (Jerry Kramer was voted into the Pro Football Hall of Fame by the Seniors Committee, in 2018.)

With Green Bay beating the Giants in the 1962 title game, the Packers had just made straight 3 NFL title-game appearances, winning two of them. But the New York Giants had just made 4 NFL title-game appearances in 5 years…and they had lost all 4 times (losing to Baltimore in 1958 and ’59, and losing to Green Bay in 1961 and ’62). And the Giants would lose, again, in the title-game the following season (losing to the Bears, in 1963).

green-bay-packers_1962_nfl-title-winners_packers-16_ny-giants-7_yankee-stadium_vince-lombardi_ray-nitschke_jim-taylor_jerry-kramer_h_.gif
Photo and Image credits above -
Packers 1962 and NY Giants 1962 helmets, illustrations by gridiron-uniforms.com/[1962]. Vince Lombardi on the sidelines at Yankee Stadium, photo by Neil Leifer at neilleifer.com. Nitschke stopping Giants’ Alex Webster, photo by Neil Leifer at neilleifer.com. Nitschke recovering fumble, photo by Milwaukee Journal-Sentinel at archive.jsonline.com. Ray Nitschke, photo unattributed at cmgww.com/football/nitschke. . Jim Taylor scoring in 1962 NFL title game, photo by Vernon Biever via nydailynews.com/sports. Jerry Kramer, photo by Frank Rippon via packers.com. Jerry Kramer kicking a FG in 1962 title game, photo unattributed at fs64sports.blogspot.com. Packers congratulating Kramer after his 4th quarter FG, screenshot of video from nfl.com/videos.

1962 Green Bay Packers: 10 All-Pro players; plus 10 from the ’62 Packers were later inducted into the Pro Football Hall of Fame.
Note: All-Pro, below, means: 1962 AP, 1st team.
-Jim Taylor (FB): 1962 All-Pro, and 1962 MVP [AP]; Taylor was inducted to the HoF in 1976.
-Forrest Gregg: 1962 All-Pro (T); Gregg was inducted into the HoF in 1977.
-Herb Adderley: 1962 All-Pro (CB/KR); Adderley was inducted into the HoF in 1980.
-Willie Davis: 1962 All-Pro (DE); Davis was inducted into the HoF in 1981.
-Jim Ringo: 1962 All-Pro (C); Ringo was inducted to the HoF in 1981.
-Jerry Kramer: 1962 All-Pro (G/K); Kramer was inducted to the HoF in 2018.
-Dan Currie: 1962 All-Pro (LB).
-Bill Forester: 1962 All-Pro (LB).
-Henry Jordan: 1962 All-Pro (DT).
-Ron Kramer: 1962 All-Pro (TE).
-Bart Starr (QB); Starr was inducted into the HoF in 1977.
-Ray Nitschke (LB); Nitschke was inducted into the HoF in 1981.
-Paul Hornung (HB/K); Hornung was inducted to the HoF in 1986.
-Vince Lombardi (Head coach of the Packers from 1959-67). Lombardi was inducted into the HoF in 1971.

    Helmet changes in 1962 NFL: Bears, 49ers, and Steelers introduce helmet logos (see further below).

The chart below shows NFL teams’ helmet-logos and changes in design, in a 10-year span (1953 to 1962 seasons). This was the time period that saw the most drastic changes in helmet logo design in the NFL. By 1962, the iconography of NFL teams had been set. And with very few exceptions, the helmet logo-designs of each of the 14 NFL teams of 1962 have not changed much at all to this day…only Washington’s helmet is different today, while the Cowboys and the 49ers changed helmet colors [both did so in 1964]).

Below: NFL teams 1953 to 1962: Helmet logo-design changes (10-season-span)
NFL teams (franchises) listed in order of establishment. Helmet-logo-changes are indicated by an arrow, with date shown.
Click on image below for full-size chart…
nfl_helmets_helmet-design-changes_all-teams_from_1953_to_1962_post_c_.gif
NFL teams 1953 to 1962: Helmet logo-design changes (10-season-span)
Helmet illustrations from gridiron-uniforms.com.

1962: Chicago Bears introduce their helmet-logo (a wishbone-shaped-C), on their midnight blue helmet.

Below: Chicago Bears’ helmet evolution (since the post-War era/1946-2018)…
chicago-bears_helmets_1946-2018_.gif
Bears helmets from gridiron-uniforms.com/[CHI].

1962: San Francisco 49ers introduce their helmet-logo (S-F-in-football), on a silver helmet.
(Two years later, in 1964, the 49ers would introduce their S-F-in-football logo, on a gold helmet.)

Below: San Francisco 49ers’ helmet evolution (since their inception in the AAFC in 1946/1946-2018)…
san-francisco-49ers_helmets_1946-2018_b_.gif
49ers helmets from gridiron-uniforms.com/[SF].

1962: the Pittsburgh Steelers introduce their helmet-logo (the US Steel Steelmark), on their gold helmet.
(One year later, in 1963: the Steelers would introduce their revised Steelmark logo, on a black helmet.)

steelmark-logo_on_steel-products_c_.gif
Photo and Image credits above – researchgate.net.

In January of 1960, the U.S. Steel Corp. introduced the Steelmark logo. The original Steelmark logo was a grey-edged circle enclosing three hypocycloids (diamonds with inward-curving edges) with the word ‘Steel’; the three star-shapes were in yellow, orange and blue. It was used to promote the steel industry, both in print ads and on labels on the steel products themselves. Throughout the Sixties and the Seventies the Steelmark logo was on labels of American-made steel products ranging from kitchenware to filing cabinets to steel tanks to tricycles. In 1962, Republic Steel of Cleveland, a co-owner of the Steelmark logo, approached the Pittsburgh Steelers organization about using the Steelmark logo in their football uniforms. The Steelers debuted the Steelmark logo on their gold helmets in the 10th week of the 1962 NFL season, on Sunday the 18th of November (the Steelers beat Washington 32-21 that day).

So the Pittsburgh Steelers new helmet-logo, with their first version of the Steelmark logo, was worn for the last 5 games in 1962. The orange star from one of the the original designs was replaced with a red star (making the 3 stars Yellow, Red, and Blue). The logo was worn on only the right side of the gold 1962 Steelers helmet. The reason for this was because the team was not sure the look would be popular. So the equipment manager of the Steelers was instructed to affix the Steelmark logo-decals to only the right-side of the helmets, in case the helmets didn’t look good (so that there would be less work scraping them off, if they didn’t look OK). Well, they looked fine.

pittsburgh-steelers_steelmark-logo_helmet-1962_1963_k_.gif
Steelers helmets from gridiron-uniforms.com/[PIT].

Encouraged by the success of the Steelmark-logo helmet, the Steelers decided to try it out on a black helmet. And so 8 weeks later, the Steelers introduced their now-iconic black-helmet-with-Steelmark-logo, on Jan. 6 1963, in the exhibition-game called the Playoff Bowl, versus the Lions, in Miami, FL. The helmet was simply a reverse of their existing helmet: black-with-a-gold-stripe instead of gold-with-a-black-stripe.

For the next season of 1963, the Steelers petitioned the Steelmark logo’s owner, the American Iron and Steel Institute, to let the football team change the word ‘Steel’ in the logo to ‘Steelers’. Also, the outside grey circle on the logo was made a lighter grey, and was a wider ring. The Steelers added small white player-numbers to the front of the helmet (the team had worn large player-numbers on the sides of their helmets from 1957-61/ see helmet-logos chart further above to see that).

The Steelers never placed the Steelmark-logo on the left side of their helmets. The Steelers have worn this helmet design since September 1963. The only changes made have been…1) the Steelers changed from grey facemasks to black facemasks, in 1977; and 2) they made the blue star a tiny bit darker, in 2002 {sportslogos.net/Pittsburgh_Steelers}.

___
Photo and Image credits
Packers players on map page,
Reproduction of early-1960s Packers helmet, from ebay.com. Early-1960s Packers pennant, from sports.mearsonlineauctions.com. Bart Starr & Jim Taylor, photo by George Silk/Getty Images via gettyimages.com. Jerry Kramer [photo circa 1963], unattributed at pinterest.com. Jim Ringo [photo circa 1962], unattributed at thegridfe.com. Jim Taylor & Forrest Gregg [SI cover from Sept. 1962], from si.com/vault. Willie Davis [photo circa 1964], photo unattributed at pinterest.com. Henry Jordan [1961 Topps card], from ebay.com. Dan Currie [photo circa 1963], photo unattributed at fs64sports.blogspot.com. Ray Nitschke, photo by Sports Illustrated via lombardiave.com. Bill Forester [1962 Topps card], unattributed at pinterest.com. Herb Adderley [photo circa 1962], photo unattributed at pinterest.com. Ron Kramer [photo circa 1963], unattributed at pinterest.com.

Offensive stats leaders on map page,
Eddie LeBaron [photo from 1961], photo by Neil Leifer via gettyimages.com. Sonny Jurgensen [photo from 1963], photo by Neil Leifer via gettyimages.ae. YA Tittle [photo from 1961], photo by Neil Leifer via si.com/vault. Jim Taylor [photo circa 1965], photo by Getty Images via 247sports.com. Bobby Mitchell [photo circa 1962], unattributed at pinterest.com. Frank Clarke [1962 Post card], from amazon.com.


-Blank map by anonymous US federal government employee, at File:StatesU.svg (commons.wikimedia.org).
-Thanks to the contributors at pro-football-reference.com
-Thanks to the contributors at NFL 1962 season (en.wikipedia.org).
Special thanks to Tim Brulia, Bill Schaefer and Rob Holecko of The Gridiron Uniform Database, for giving billsportsmaps.com the permission to use football uniforms illustrations from Gridiron Uniform Database {GUD}.

January 23, 2019

2018-19 FA Cup 4th Round Proper- map with current league attendances & fixture list./+Biggest upset in FA Cup 3rd Round: Sheffield Utd 0-1 Barnet.

Filed under: 2018-19 FA Cup — admin @ 4:12 pm

2018-19_fa-cup_map_4th-round_map-of-the-32-clubs_w-current-attendances-in-league_fixture-list_clubs-by-division_post_e_.gif
2018-19 FA Cup 4th Round Proper- map with current league attendances & fixture list


By Bill Turianski on 23 January 2019; twitter.com/billsportsmaps.
Links…
-The competition…FA Cup .
-2018-19 FA Cup 4th Round (us.soccerway.com).
-BBC.com/fa-cup.

Update
FA Cup 4 R Saturday 26 Jan 2019 – Upsets
Wins:
AFC Wimbledon 4-2 West Ham Utd (Wimbledon: 58 places lower)
Millwall 3-2 Everton (Millwall: 28 places lower)

Draws:
Middlesbrough 1-1 Newport County (Newport: 56 places lower)
Shrewsbury Town 2-2 Wolves (Shrewsbury: 54 places lower)

2018-19_fa-cup_4th-round_26-jan-2019_cup-upsets_wimbledon_millwall_newport-co_shrewsbury_b_.gif

Chart: Clubs in the 4th Round, by Division (with current league crowd-sizes shown)…

2018-19_fa-cup_4th-round_the-32-teams_by-division_w-crowd-sizes_e_.gif
Attendance figures from soccerway.com.

    Biggest upset in 2018-19 FA Cup 3rd Round – Sheffield Utd 0-1 Barnet
    Barnet (of the 5th division/National League) were 84 league-places and 3 divisions lower than 2nd-division side Sheffield United…

Barnet FC. Est. 1888. Nick-name: the Bees. Ground: The Hive. Capacity 6,500 (5,419 seated). Canons Park, northwest London Borough of Harrow. Colours: Orange and Black. Located, by road, about 6 miles (10 km) south-west of the club’s former location in Barnet.

Barnet have played 21 seasons in the Football League.
Barnet were in the Southern League when they became a founding member of the 5th division in 1979 {Alliance Premier League 1979-80}. In 1990-91, under longtime manager Barry Fry, Barnet won promotion to the 4th Division of the Football League. This was in the 5th year that an automatic promotion-spot, into the Football League, was allocated to the 5th division. Barnet won the Conference by 2 points over Colchester United in 1991. And then, 2 years later, in their second season in the Football League, Barnet won promotion again, to the 3rd division (in 1992-93). Barnet went back down to the 4th tier the next season (’93-94).

Barnet ended up staying 10 seasons in the Football League (1991-2001), with relegation to non-League [the Conference] in 2001. Their peak attendance was in their debut season in the League in 1991-92, at 3.6 K per game. It took Barnet 5 years to get back to the League, which they did in 2004-05, winning the 5th division with ease, 12 points ahead of Hereford United. At this point (2005-06), Barnet were drawing 2.2 K per game. Barnet’s second spell in the Football League lasted 8 seasons, all in the lower-half of the 4th division table. So you could say that it was becoming an ingrained fact that it was an uphill battle for Barnet to maintain League status. Relegation back to non-League came in 2013. It just so happened that this came about exactly as Barnet were about to leave their home of over 100 years, Underhill Stadium (1907-2013).

2013: Barnet are relegated out of the League again, and re-locate from Barnet to Harrow…
Underhill Stadium was famous for its sloped pitch. It was also the home of the Arsenal reserves. After the club’s 100-year lease expired, an ongoing dispute with Barnet Council forced the club to eventually sell the ground, and look elsewhere for a new home {see images and captions further below}. The club had to re-locate to find a suitable set-up. Barnet’s new venue, the Hive, is in the adjacent borough of Harrow, about 6 miles away (by road). They have plenty of room there for training fields, which they are able to rent out. (Note: the Hive is on the London Metro’s Jubilee Line, at the Canons Park station, which happens to be 3 stops north of Wembley Stadium, the site of the FA Cup Final {see map and aerial photo below}.)

Barnet’s 2013 relegation-/and-re-location did not drastically reduce crowd-size that much in 2013-14, given that a drop-off in crowds is to be expected when a club loses League status. {See Barnet attendance chart in the illustration below.} Barnet ended up dropping about 700 per game (down from 2.4 K in League Two, to 1.7 K in the Conference). It only took Barnet two seasons, this time, to re-gain promotion to the League, which was done in 2014-15, with Barnet beating out Bristol Rovers by one point for the Conference title. Barnet then ended up with a 3-season stint in the Football League, once again finishing in the lower half of League Two the whole way.

On the 5th of May 2018, for the third time in their history, Barnet were relegated out of the League, on goal difference (Morecambe survived). Barnet have become somewhat of a League/non-League yo-yo club, with two relegations out of the League since 2013. But 5 years later, relegation, this time, has hit Barnet harder…attendance has dropped around one-thousand-per-game (down from 2.2 K in League Two, to 1.2 K, currently, in the National League). In August 2018, Barnet started their fourth stint in non-League, and went winless in their first 5 games. They have recovered, and sit in 16th place with 4 games in hand (at the close of January 2018). But survival, and not a promotion push, is the best that can be salvaged. In other words, Barnet will be stuck in non-League next season. And Barnet just lost their manager, John Still [age 68], who retired a few days after Christmas in 2018. The 44-year-old Darren Currie, who was Still’s assistant coach, has taken over as caretaker manager.

Yet while their National League campaign was sputtering, Barnet were putting together a decent Cup run…
On 3 November, in front of 1.7 K at the Hive, Barnet held on to a 1-1 score versus 3rd-vision side Bristol Rovers. Then in the replay, they beat Rovers 1-2 at the Memorial Stadium in Horfield, Bristol, on Wednesday 21st November 2018. Goals were scored by MF Craig Robson in the 75th minute, and by substitute FW Byron Harrison two minutes later, on an assist by MF Dan Sparkes (77′).

Then a late-November 2nd Round draw, with 6th-tier-side Stockport County, saw Barnet win 1-0 at the Hive, in front of 2.8 K (with Stockport bringing down over one thousand traveling supporters). Barnet’s winning goal was scored in the 8th minute, by MF Dan Sparkes, on a header from a cross by DF Cheye Alexander.

Then in the FA Cup 3rd Round, Barnet were drawn, away, to 2nd-division-side Sheffield United…
Sheffield United, sitting 3rd in the Championship, and in a quest to return to the Premier League, might not have placed that high a priority on the FA Cup right then. But, regardless, the Blades went into the match 84 league-places and 3 divisions higher than Barnet. The Blades’ fanbase might not have prioritized the match either, as there were just 9.9 K in attendance there at Brammall Lane. That figure included 966 traveling Barnet fans, who made the 160-mile journey up north, to South Yorkshire. Barnet scored the winner in the 21st minute on a penalty, scored by FW Shaq Coulthirst. To win the penalty, Coulthirst had threaded a pass to 19-year-old LW Ephron Mason-Clark, who was brought down in the box by a lunging Richard Stearman. Barnet held on for the win, greatly aided by a 89th-minute point-blank save that ‘keeper Mark Cousins made on a header by Blades’ FW Leon Cousins {see screenshots below}.

In the 4th Round draw, as just rewards for a brilliant 3rd Round Cup-upset, Barnet got a nice 4th Round tie, versus fellow London side Brentford.
Brentford, who are also nick-named the Bees, are in 17th place in the Championship. Brentford’s Griffin Park in West London is located only about 8 miles south of the Hive. The match will be played at the Hive, on Monday night, the 28th of January. The match was, of course, selected for television broadcast, and it is sold out.

barnet_underhill_move-to-harrow_the-hive_league-history_c_.gif
barnet-fc_2018-19_fa-cup-3-rd_brammall-lane_sheffield-utd_0-1_barnet_e-mason-clark_s-coalthirst_m-cousins_d-currie_d_.gif
Photo and Image credits above – Barnet 18/19 small kit illustrations, from en.wikipedia.org/Barnet. Barnet 18/19 jersey illustration from historicalkits.co.uk/Barnet. Underhill Stadium, photo unattributed at dailymail.co.uk/football/article-Barnet-leave-Underhill-104-years. Aerial shot of the Hive from barnetfc.com. R Stearman penalty on E Mason-Jones, screenshot from video from streamable.com/4ms55 via reddit.com/soccer. Ephron Mason-Clark, photo by Gavin Ellis/TGS Photo via barkinganddagenhampost.co.uk. Penalty goal by Shaq Coalthirst, photo by Matt West via theguardian.com/football. Shaq Coalthirst, photo by James Williamson/AMA/Getty Images via hitc.com. GK Cousins’ save, and Mark Cousins after the save, screenshots from video uploaded by FA Emirates Cup at youtube.com. Traveling Barnet fans, photo by Mark Cosgrove/News Images/REX via dailymail.co.uk/football. Darren Currie & Barnet players thank the traveling fans, photo by Getty Images via dailymail.co.uk/football.

___
Thanks to all at the links below…
-Blank map of UK historic counties, by Nilfanion (using UK Ordnance Survey data), at File:United Kingdom police areas map.svg (commons.wikimedia.org).
-Blank relief map of Greater London, by Nilfanion (using UK Ordnance Survey data), at File:Greater London UK relief location map.jpg.
-Blank relief map of Greater Manchester, by Nilfanion (using Ordnance Survey data), at File:Greater Manchester UK relief location map.jpg.
-Blank relief map of West Midlands, by Nilfanion, at File:West Midlands UK relief location map.jpg -Attendances from us.soccerway.com.
-2018-19 FA Cup (en.wikipedia.com).

January 10, 2019

2019 Copa Libertadores: location-map for the 47-team tournament, with Club Histories (Libertadores appearances & titles listed).

Filed under: Copa Libertadores — admin @ 8:12 am

conmebol_copa-libertadores_2019_location-map_47-teams_post_e_.gif
2019 Copa Libertadores: location-map for the 47-team tournament, with Club Histories (Libertadores appearances & titles listed)


By Bill Turianski on 10 January 2019; twitter.com/billsportsmaps.
Links/Sources…
-2019 Copa Libertadores (en.wikipedia.org).
-Copa Libertadores 1960-2017 Club Histories (rsssf.com).

    2019 Copa Libertadores…the 60th edition of South America’s most prestigious fútbol competition.

Shown on the map are all 47 teams that have qualified for the 2019 Libertadores (including the 28 teams which have qualified for the Group Stage of 32).

Qualified teams by country: Brazil has 8 teams (7+ Copa Sudamericana holder). Argentina has 7 teams (6+ Copa Libertadores holder). The eight other countries all have 4 teams each, in the tournament (Uruguay, Colombia, Paraguay, Chile, Ecuador, Peru, Bolivia, Venezuela).

Teams are shown in the two flanking sections on either side of the map, organized by country. Shown there in the country-groupings are each team’s all-time total Libertadores appearances (in the tan-colored column), and Libertadores titles (in the pale-blue-colored column).

For the 2019 Libertadores, there are 12 cities with more than one team qualified, and those 12 cities are labelled, and the teams from those cities are shown in small boxes.

At the far left of the map-page is the Libertadores titles list by club (25 clubs have won the Libertadores title). At the far right is the Libertadores titles list by country (of the 59 Libertadores titles, 25 have been won by Argentine teams, and 18 have been won by Brazilian teams).

Finally, at the top is a banner which includes the reigning champions, River Plate, of Argentina. By beating Boca Juniors 3-1 aggregate, River won their 4th Libertadores title (1986, 1996, 2015, 2018).

The Preliminaries (3 stages) start on 22 January…
Within each country, the top-ranked spots get a bye to the Group Stage. The 19 lower-ranked spots must play in the 3 Preliminary Stages. The Preliminary spots are portioned out two-per-country, except for 1 preliminary-spot in the country of the Cup Holder (Argentina, this year). On the map-page, the 19 teams that comprise the Preliminary rounds are shown in italics. From these 19 lowest-ranked qualifiers, only 4 will qualify for the Group Stage of 32. The three Preliminary rounds last a little over a month (ending on the 28th of February).

The Group Stage (of 32) begins on 5-7 March (1st game-week)…
The Group Stage lasts 2 months, and has 6 game-weeks, with the final game-week played on 7-9 May. {2019 Copa Libertadores schedule.}


Below, Argentina’s 7 Libertadores teams for 2019…

argentina_map-of_2019-copa-libertadores_qualified-teams_river-plate_boca-jrs_godoy-cruz_rosario-central_huracan_talleres_h6_.gif

Below, Brazil’s 8 Libertadores teams for 2019…

brazil_map-of_2019-copa-libertadores_qualified-teams_atl-paranaense_palmeiras_cruzeiro_flamengo_internacional_gremio_sao-paulo_atl-mineiro_n_.gif

Below, Uruguay’s 4 Libertadores teams for 2019…

uruguay_map-of_2019-copa-libertadores_qualified-teams_penarol_nacional_danubio_defensor-sporting-_e_.gif

___
Thanks to all at the links below…
-Globe-map of South America by Luan at File:South America (orthographic projection).svg (en.wikipedia.org/[South America]).
-Blank map of South America by Anbans 585 at File:CONMEBOL laea location map without rivers.svg (en.wikipedia.org/[2018 Copa Libertadores]).
-2019 Copa Libertadores (en.wikipedia.org).
-Copa Libertadores 1960-2017 Club Histories (rsssf.com).
-Libertadores titles list {en.wikipedia.org/wiki/Copa_Libertadores#Performances_by_club}.

January 1, 2019

2018-19 FA Cup 3rd Round Proper- map with attendances & fixture list./+ chart: 64 qualified clubs by division./+ illustration for Woking FC (lowest-placed club to qualify for the 3rd Round)./+ 3 updates: biggest cup-upsets in Saturday’s matches; biggest cup-upsets in Sunday’s matches./+Clubs in 4th Round draw (36 clubs/4 replays),

Filed under: 2018-19 FA Cup — admin @ 1:04 am

2018-19_fa-cup_map_3rd-round_map-of-the-64-clubs_w-current-attendances-in-league_fixture-list_post_c_.gif
2018-19 FA Cup 3rd Round Proper- map with attendances & fixture list./+ chart: 64 qualified clubs by division


By Bill Turianski on 1 January 2019; twitter.com/billsportsmaps.
Links…
-The competition…FA Cup .
-2018-19 FA Cup/3rd Round (en.wikipedia.org).
-BBC.com/fa-cup.

Update (8th of January): Clubs in 4th Round draw (36 clubs/4 replays)
Chart: 2018-19 FA Cup 4th Round draw – Clubs in the draw, by division.
Current crowd-size [league matches] shown for each club.
Clubs in draw: 14 from Prem/ 12 from C’ ship/ 7 from L1/ 2 from L2/ 1 non-League (Barnet).
2018-19_fa-cup_4th-round_draw_e_.gif
Attendance data: soccerway.com.

Updates (5th & 6th of January):
2018-19 FA Cup 3rd Round, from Saturday 5 January 2019: chart of the biggest upsets & the best results for lower-placed team.
Biggest upset: Gillingham over Cardiff (Gillingham was 45 places and 2 divisions lower).
2018-19_fa-cup_3rd-round_cup-upsets_sat-5-jan-2019_gillingham_portsmouth_stanley_bristol-city_shrewsbury_blackburn_c_.gif

Update:
2018-19 FA Cup 3rd Round, from Sunday 6 January 2019: chart of the biggest upsets & the best results for lower-placed team.
3 big upsets…
Barnet over Sheffield Utd (Barnet: 84 places/3 div lower);
Newport County over Leicester City (Newport: 74 places/3 div lower).
Oldham Athletic over Fulham (Oldham: 59 places/3 div lower).
2018-19_fa-cup_3rd-round_cup-upsets_sunday-6th-jan-2019_c_.gif

Below: the 64 clubs in the 3rd Round, listed by division…
2018-19_fa-cup_3rd-round_qualified-clubs-by-level_64-teams-crests_r_.gif

    Woking FC (National League South/6th level): lowest-placed team in the 2018-19 FA Cup 3rd Round Proper…

Woking FC, established 1889, are nicknamed the Cards (as in the Cardinal red in their Red-and-White halved jerseys). Woking play at the Kingfield Stadium in Woking, Surrey (located, by road, 31 miles south-west of central London). The Kingfield is an unusual ground in that it has spartan lower-non-League type stands on three sides, and a steep, roofed modern stand behind one goal: the Leslie Gosden Stand (2,016 seats; opened December 1995). This came about when Woking had large ambitions 25 years, or so, ago. But then the money ran out, and it has been a matter of consolidation since the early 2000s.

Many parts of the London commuter belt contain clubs that never have been able to grow their fan-base very much, because of being overshadowed by all the nearby big London clubs. And the county of Surrey certainly falls into this category. Surrey is a home county that has no Football League presence. There has never been a Surrey-based club in the League. Woking have come close (finishing 2nd in the Conference National, in 1994–95 and ’95–96), but Woking have never been higher than the 5th division.

Woking were a mainstay in the 5th tier fifteen years ago (Woking played 17 straight seasons in the 5th division, from 1992-93 to 2008-09). But this is now their second spell in the 6th tier, after 3 seasons up in the 5th tier. So, in other words, Woking are becoming somewhat of a 6th-tier-/-5th-tier yo-yo club. Woking draw solid for a life-long non-League club (2.2 K last season), and still draw well above 1 K now that they are stuck back in the 6th tier. And Woking could bounce straight back to the National League…it is starting to look like the National League South could see a title-race between former League club Torquay United, and Woking. (As to the other NL-S promotion candidates: Billericay are fading now that the Tamplin-money is gone; Concord Rangers might be too small a club to mount a promotion-push; although Welling, Chelmsford, Bath, and Dartford could pose a threat.)

Woking have qualified for the FA Cup 3rd Round three times.
Woking’s first appearance in the FA Cup 3rd round, back in the 1990-91 season, was their greatest moment. At that point in their history, Woking had not yet been promoted to the 5th division, and were an Isthmian League side. Woking beat three 5th division sides to get to the 3rd round (Bath City in the 4th Q, Kidderminster in the 1st R, Merthyr Tydfil in the 2nd R). Then in the 3rd round, Woking beat Second Division side West Bromwich Albion, away, 2-4, to reach the 4th round. Woking beat a team four levels higher, playing away, and despite being 1-0 down at the half. The hero that day was Surbiton, Surrey-born and Gibralter cricket international Tim Bazaglo, who had a hat-trick {see image below}. (In the 4th round in 1991, Woking lost 1-0 to Everton.)

Video – FA Cup Upset – Woking (Non-League) 4-2 West Brom (1991) | From The Archive (1:35 video uploaded by The Emirates FA Cup at youtube.com).

Below: January 1991: Woking beat West Bromwich, a team 4 divisions higher (1990-91 FA Cup 3R at the Hawthorns in West Bromwich)…
woking_fa-cup-upset_1990-91_fa-cup_3rd-round_west-bromwich_2-4_woking_tim-buzaglo_e_.gif
Image above – screenshot from youtube.com. Old Woking badge from vintagefootballshirts.com. 1990-91 FA Cup wordmark from sportspages.com.

Woking’s second appearance in the FA Cup 3rd round came six years later, in 1996-97. Woking qualified for the 3rd round in ’96-97 by beating two Football League clubs: the then-3rd-tier-side Millwall (away) in the 1st round, and 4th-tier-side Cambridge United (away), in the 2nd round. (In the 3rd round, Woking lost to Coventry City, in a replay, 1-2.)

Now Woking will make their third appearance in the 3rd round.
Here are the 5 clubs Woking beat in mid-to-late-2018, to qualify:
2nd Qualifying round, Tooting & Mitcham Utd (8th tier)
3rd Qualifying round, Kempston Rovers (8th tier)
4th Qualifying round, Welling Utd (6th tier)
1st Round, (away at) Torquay Utd (6th tier)
2nd Round, (away at) Swindon Town (4th division). (Winning goal in the 54′, Jake Hyde (FW), headed in a cross from the left, by Josh Casey (LB; captain).

Video – Swindon Town 0 – 1 Woking | Match Highlights (12:00 video uploaded by Woking FC TV at youtube.com…Jake Hyde’s goal can be seen at ~5:30 in video).

In the draw for the 3rd round, Woking were handed a sweet home match, versus Premier League side Watford (on Sunday the 6th of January). Watford is located just north-west of Greater London, in south-west Hertfordshire, and is situated just 34 miles (by road) north of Woking. So that makes for a very good match for traveling Watford fans – and, as of 31st of December, the match has essentially been sold out (250 tickets remain). And the Woking v Watford tie has been selected for television coverage, so Woking will be earning a significant sum from the match.

Below: Woking beats Swindon Town, away, 0-1, to qualify for the FA Cup 3rd Round for the first time in 22 years…
woking-fc_lowest-placed-club_fa-cup_3rd-round_2019_kingsfield-stadium_surrey_jake-hyde_alan-dowson_e_.gif
Photo and Image credits above – Aerial image of Kingfield Stadium, from bing.com/maps. Old Woking coat of arms, from old.woking.gov.uk/woking/people/crest. Photo of Family Stand, Directors Stand & Moaners’ Corner, photo by groundhopping.se/Woking. Leslie Gosden Stand, photo by DL Chadwick via geograph.org.
Jake Hyde scores winner v Swindon, photo by David Holmes via wokingnewsandmail.co.uk/sport. Jake Hyde goal at Swindon: Woking players celebrating with traveling fans, screenshot from video uploaded by Woking FC TV at youtube.com. Woking manager Alan Dowson, arriving back at the supporters’ celebration, at the Kingfield Stadium, later that night: screenshot from video uploaded by Woking FC TV at youtube.com. Traveling Woking fans at Swindon, photo from twitter.com/WokingFCFans. Woking players and coaches celebrate after win, photo unattributed at thenonleaguefootballpaper.com.

___
Thanks to all at the links below…
-Blank map of UK historic counties, by Nilfanion (using UK Ordnance Survey data), at File:United Kingdom police areas map.svg (commons.wikimedia.org).
-Blank relief map of Greater London, by Nilfanion (using UK Ordnance Survey data), at File:Greater London UK relief location map.jpg.
-Blank relief map of Greater Manchester, by Nilfanion (using Ordnance Survey data), at File:Greater Manchester UK relief location map.jpg.
-Blank relief map of West Midlands, by Nilfanion, at File:West Midlands UK relief location map.jpg -List of Greater Manchester settlements by population.
-Attendances from us.soccerway.com.

December 22, 2018

All-time Serie A (Italy/1st division): List of all clubs with at least one season in the Italian 1st division (87 seasons/since 1929-30/66 clubs); with Italian titles listed.

Filed under: Football: All-time 1st Div,Italy — admin @ 11:01 am

italy_1st-division-serie-a_87-seasons_chart-of-all-time-most-seasons-in-italian-1st-div_by-club_w-seasons_consec_titles_colours-and-crest_post_c_.gif
All-time Serie A (Italy/1st division): List of all clubs with at least one season in the Italian 1st division (87 seasons/since 1929-30/66 clubs); with Italian titles listed


By Bill Turianski on 22 December 2018; twitter.com/billsportsmaps.

This chart for Italy here is similar to the one I made for England, earlier this year {here: England, 1st division – all-time: List of all clubs with at least one season in the English 1st division (120 seasons/since 1888-89/65 clubs).; with English titles listed.

This chart here is in the same template as the chart I recently made, for Germany {here: All-time Bundesliga (Germany/1st division): Chart of all clubs with at least one season in the German 1st division (56 seasons/since 1963-64/55 clubs); with German titles listed.

The chart here shows the list of all clubs that have played in the Italian 1st division (Serie A).
There are 66 clubs who have played in Serie A, since it was instituted in 1929-30. (2018-19 is the 87th season of Serie A.)
Going from left to right on the chart, here is what is listed on the chart…
1). Name of club.
2). Level (aka division) that the club is in, currently [2018-19]. Levels are shown at the foot of the chart. Also, there is a small chart further below here which shows all 9 levels in the Italian football pyramid.
3). Crest & colours [home colours from 2018-19].
4). Seasons in Italian 1st Division (Serie A): 87 seasons (1929-30 to 1942-43; 1946-47 to 2018-19).
5). Consecutive seasons in the 1st division [current/2018-19] – OR – Last season that the club was previously in the 1st Division.
6). Serie A clubs for 2018-19 are shown with crest and small home kit illustration [grey column down the middle of the chart].
7). Full name of club.
8). Italian titles: Italian titles [113 seasons] (1898-1915; 1920-1943; 1946-2018). (FIGC season 1921-22 not included. No title awarded in 1927 [Torino stripped of title]. No title awarded in 2005 [Juventus stripped of title].)

Here are the 20 all-time longest-serving clubs of Serie A (2018-19 is the 87th season of Italian 1st division football)…
with city-location and home average attendance from 20 Dec. 2019. 5 clubs below are not in Serie A in 2018-19, and their current divisional status is noted.
1). 87 seasons: Internazionale. Milan, Lombardy. Drawing 62.0 K (highest attendance in Italy, currently).
=2). 86 seasons: Roma. Rome, Lazio. Drawing 38.8 K (4th-highest).
=2). 86 seasons: Juventus. Turin, Piedmont. Drawing 39.9 K (3rd-highest).
4). 85 seasons: Milan. Milan, Lombardy. Drawing 38.8 K (4th-highest).
5). 81 seasons: Fiorentina. Florence, Tuscany. Drawing 31.4 K (7th-highest)
6). 76 seasons: Lazio. Rome, Lazio. Drawing 32.6 K (5th-highest).
7). 75 seasons: Torino. Turin, Piedmont. Drawing 19.2 K (12th-highest).
8). 73 seasons: Napoli. Naples, Campania. Drawing 31.7 K (6th-highest).
9). 72 seasons: Bologna. Bologna, Emilia-Romagna. Drawing 21.5 K (9th-highest).
10). 62 seasons: Sampdoria. Genoa, Liguria. Drawing 19.3 K (11th-highest).
11). 58 seasons: Atalanta. Bergamo, Lombardy. Drawing 18.6 K (13th-highest).
12). 52 seasons: Genoa. Genoa, Liguria. Drawing 22.0 K (8th-highest).
13). 46 seasons: Udinese. Udine, Friuli-Venezia Guilia. Drawing 21.3 K (10th-highest).
14). 39 seasons: Cagliari. Cagliari, Island of Sardinia. Drawing 15.3 K (15th-highest).
=15). 30 seasons: Bari. Bari, Apulia. Attendance unavailable due to Bari currently playing in the amateur 4th division (Serie D).
=15). 30 seasons: Vicenza. Vicenza, Veneto. Drawing 8.3 K in the 3rd division (Serie C/Group B) [2nd-highest in the 3rd div].
17). 29 seasons: Palermo. Palermo, Island of Sicily. Drawing 13.2 K in the 2nd division (Serie B) [highest-draw in 2nd division & 16th-highest overall].
18). 28 Seasons: Hellas Verona. Verona, Veneto. Drawing 10.5 K in the 2nd division [5th-highest-draw in 2nd division & 24th-highest overall].
19). 26 seasons: Triestina. Trieste, Friuli-Venezia Guilia. Drawing 4.3 K in the 3rd division (Serie C).
20). 25 seasons: Parma. Parma, Emilia-Romagna. Drawing 15.5 K (14th-highest).
Attendance data from soccerway.com/[Serie A].

I will have an All-time 1st Division chart (like this one), for Spain, in February.

Levels in the Italian Football Pyramid
(Top 3 levels are professional. Top 2 levels are national leagues; 3rd level is comprised of 3 regional groups. Amateur from the 4th level, down to the 9th level)…
A=1st Division: Serie A.
B=2nd Division: Serie B.
C=3rd Division: Serie C.
D=4th Div (1st-amateur): Serie D.
5th Div (2nd-amateur): Eccellenza.
6th Div (3rd-amatuer): Promozione.
7th Div (4th-amateur): Prima Categoria.
8th Div (5th-amateur): Seconda Categoria.
9th Div (6th-amateur): Terza Categoria.

italy_football-pyramid_levels-1-9_a4_.gif
Data from it.wikipedia.org/wiki/Campionato_italiano_di_calcio#Piramide_attuale.

___
Thanks to all at the links below…
Sources:
-Serie A/Seasons in Serie A (en.wikipedia.org).
-Italy – Serie A All-Time Table 1929/30-2017/18 (rsssf.com).
-List of Italian football champions/Clubs (en.wikipedia.org).
-Small kit illustrations from each team’s page at en.wikipedia.org.

December 6, 2018

American Football League: 1961 AFL season, map with helmets/jerseys & final standings + offensive stats leaders; champions: Houston Oilers.

Filed under: AFL (gridiron football),AFL, 1961 map/season,Retro maps — admin @ 9:32 am

afl_1961_2nd-season_map_w-final-standings_o-stats-leaders_champions-houston-oilers_post_h_.gif
American Football League: 1961 AFL season, map with helmets/jerseys & final standings + offensive stats leaders; champions: Houston Oilers


By Bill Turianski on 6 December 2018; twitter.com/billsportsmaps.
Links…
-1961 AFL season
-1961 AFL Championship Game (en.wikipedia.org).
-1961 AFL season (pro-football-reference.com).
-1961 AFL teams’ uniforms (illustrations by Gridiron Uniforms Database at gridiron-uniforms.com/[AFL 1961]).

    The AFL (of 1960-69) had a 10-year battle with the established pro football league, the NFL.

In 1970, the AFL essentially won the battle, by virtue of the fact that the NFL allowed all 10 of the AFL franchises to join the NFL, in a full dual-league merger. Plus, the AFL won the last two match-ups with the NFL…Super Bowl III (1968 season) saw the AFL’s New York Jets beat the NFL’s Baltimore Colts, and Super Bowl IV (1969 season) saw the AFL’s Kansas City Chiefs beat the NFL’s Minnesota Vikings.

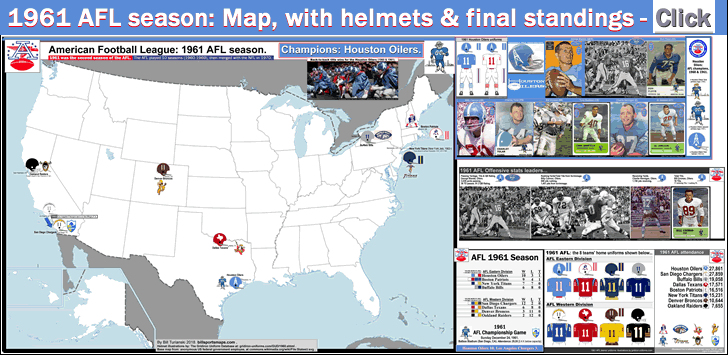
The map (click on image at the top of the post)…
The map shows the primary helmets and jerseys worn by the 8 AFL teams of 1961, the second season of the American Football League (IV) (1960-69). At the lower-right of the map-page are the final standings of the 1961 AFL, along with home jerseys and helmets of the 8 AFL teams of 1961. At the bottom-right corner are the attendance figures for the 1961 AFL, with comparisons to 1960 figures. At the upper-right of the map-page are standout players for the champions, the 1961 Houston Oilers. Below that are 1961 AFL offensive leaders in the following categories: Passing Yardage, QB Rating & TD Passes: George Blanda, Houston Oilers. Rushing Yardage and Yards from Scrimmage: Billy Cannon, Houston Oilers. Receiving Yards: Charlie Hennigan, Houston Oilers. Total TDs: Bill Groman, Houston Oilers.

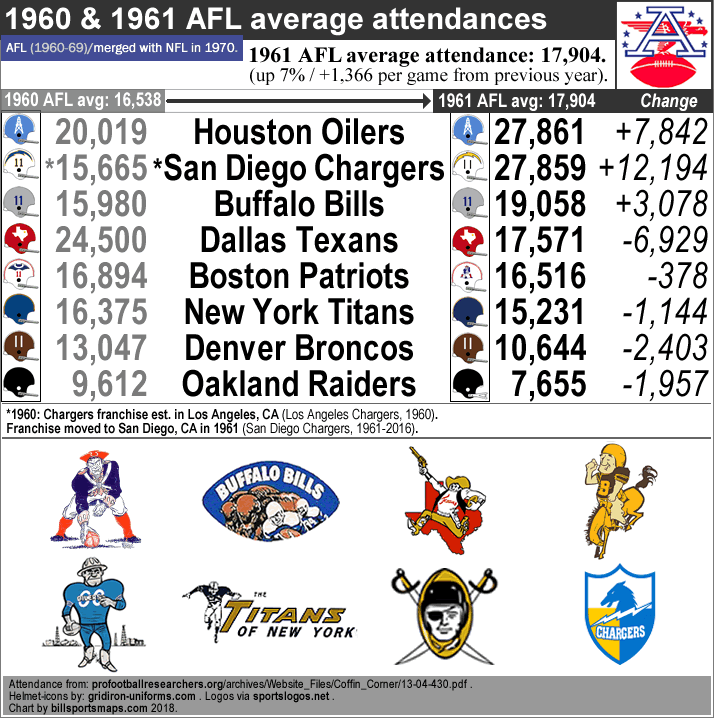
The AFL survived its first season of 1960 in debt, but relatively unscathed. Although there was one franchise shift in 1961 (the Los Angeles Chargers moved 120 miles south to San Diego), the 8-team AFL stayed afloat, abetted primarily by the league’s five-year television contract with ABC. In 1961, the AFL as a whole averaged 17.9 K per game, which was a slight increase of 7% from their first season (when the new league drew 16.5 K per game). The true explosion in attendance (and popularity) for the AFL was about 4 years further down the road, though. (By 1965, the AFL would have an overall league-attendance of 31 thousand per game, a figure which was led by huge, plus-40-K-size crowds in New York City and Buffalo, NY.) The AFL as a whole lost about $2 million in its second year. But that was less than half the losses of the first season. There was a definite sense that, after two seasons battling the NFL, the AFL was no longer threatened with survival. In fact, in 1961, three teams – the Boston Patriots, the Buffalo Bills, and the Houston Oilers – did not end up in the red.

Below: chart showing 1960 & 1961 AFL attendances (overall-league-average, and all 8 team-averages ([home regular season games])…
afl_1960_1961_avg-attendances_oilers_chargers_bills_texans_patriots_titans_broncos_raiders_b_.gif
Above: Attendance from: profootballresearchers.org/archives/Website_Files/Coffin_Corner/13-04-430.pdf .
Helmet-icons by: gridiron-uniforms.com. Logos via sportslogos.net. Chart by billsportsmaps.com 2018.

    In 1961, the two repeat divisional champions – the Houston Oilers and the San Diego Chargers – were also the best drawing teams.

The Chargers and the Oilers both benefited from the fact that they were from cities which, back then, had no other major-league competition [Major League Baseball would soon place teams in both cities: Houston Astros in 1962, San Diego Padres in 1969]. Both the Oilers and the Chargers drew 27.8 K per game in 1961.

Below are brief profiles of the 8 AFL teams circa 1961…

Houston Oilers.
In 1960, the powder-blue-clad Houston Oilers, drawing a solid 20 K per game, had won the first AFL title (over the Los Angeles Chargers) {1960 AFL map/season, billsportsmaps.com}. And in ’61, in the midst of securing their second-straight title, the Oilers increased their crowds by over 7 thousand per game (at a league-best 27.8 K per game). But after 5 games in the 1961 season, with the Oilers at 1-3-1, owner Bud Adams (AFL co-founder with Lamar Hunt) had fired head coach Lou Rymkus. His replacement was Wally Lemm, who led the Oilers to 9 straight wins to finish the season. And so, on Dec 24 1961, in San Diego, the Oilers faced the Chargers in the AFL title game again. Led by QB/K George Blanda and HB Billy Cannon, and a defense that only gave up 3 points on the day, the Houston Oilers repeated as champions {see illustration further below}.

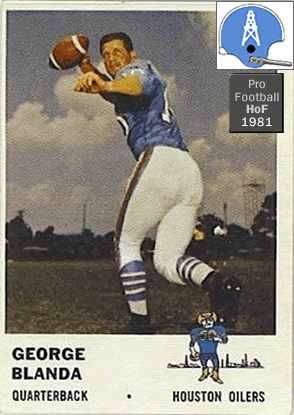
In 1960, rejected NFL QB George Blanda had came out of retirement to join the Houston Oilers as a 33-year-old. Blanda had been QB/K for the Chicago Bears from 1950-58, but he retired when he learned that George Halas intended to demote him to only placekicking duties. So when the AFL got started up, Blanda realized he could get another shot as a starting QB. In 1960 and ’61, Blanda led the Houston Oilers to the first two AFL titles, setting a TD passing record that stood for 23 years. Blanda threw 36 TD passes in 1961, and was selected as the Associated Press AFL Most Valuable Player. (That 36-TD-passes record was matched by YA Tittle of the NFL’s New York Giants two years later in 1963, and was not beaten until the NFL added 2 games to the season, and was first surpassed by Dan Marino in 1984; and is now held by Tom Brady with 50 TD passes.)

Below: Hall of Fame player who was on the 1961 Houston Oilers: George Blanda (QB/K) [Blanda was 1961 AFL MVP].
houston-oilers-1961_george-blanda_hall-of-fame_d_.gif
Images above – gridiron-uniforms.com/[AFL 1961]; 1962 Fleer card at pinterest.com.

One of Blanda’s main targets as he led the Oilers to those two consecutive AFL titles was Charlie Hennigan. Hennigan was a WR who had played for a small college in Louisiana (Northwestern State), and he had never gotten a chance in the NFL (he wasn’t even drafted by an NFL team). Hennigan was working as a high school football coach and Biology teacher before the AFL came along. In 1961, Hennigan had 12 TD Receptions and had a record-setting 1,746 yards receiving that season. This was a pro football record that stood for 34 years.

Other offensive standouts for Houston in ’61, besides the record-setting Blanda and Hennigan, were…Billy Cannon (HB, with a league-best 948 yards rushing and league-2nd-best 1,534 yards from scrimmage), Charley Tolar (FB, with 796 yards from scrimmage), and Bill Groman (WR, with 1,175 yards receiving and a league-best 18 total TDs). Houston’s offense was so explosive in 1961 that the Oilers ended up scoring 100 points more than any other AFL team that season. The Oilers scored 513 points in 1961 – an average of 36.64 per game. To this day, that is the 4th-best ever in pro football. {See this chart I made from 2013: All-time top 5 pro football offenses…#1: Rams 1950; #2: Broncos 2013; #3: Patriots 2007; #4: Oilers [AFL] 1961; #5: Bears 1941.}

From 1960-64, the Oilers played at the fondly-remembered Jeppesen Stadium, which was basically a glorified high school football stadium (at 36-K-capacity). (The Houston Oilers would go on to play in the Houston Astrodome from 1968 to 1996. The franchise moved to Nashville, TN, as the Tennessee Titans, in the late-1990s.)

San Diego Chargers.
After the 1960 season, the LA Chargers had given up on trying to compete for fans with the NFL’s Los Angeles Rams. So the Chargers moved down the freeway to San Diego, into Balboa Stadium [a former racetrack], where a second deck had just been added, making it a 34-K-capacity venue. In 1961, the dark-pastel-blue-clad and gold-lightning-bolt-bedecked San Diego Chargers drew 12 thousand per game more than they had drawn in LA, in 1960. But the Chargers peaked too soon in ’61, and coasted once they’d clinched the division, and then lost to the Oilers, again, in the 1961 AFL title game. And a worrying sign was that the 1961 title game did not sell out (5 thousand tickets went unsold at Balboa Stadium on December 24th, 1961). (The Chargers, under innovative head coach Sid Gillman, would go on to appear in 3 more AFL title games [5 in total], but would only win one AFL title – in 1963, when they demolished the Patriots 51-10. The Chargers would move into the 50-K-capacity San Diego Stadium in 1967, playing there until 2016. The franchise moved back to Los Angeles in 2017.)

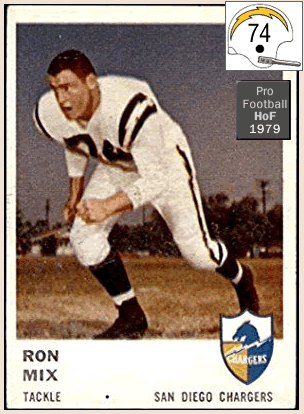
Below: Hall of Fame player who was on the 1961 San Diego Chargers: Ron Mix (OT).
chargers-1961_hall-of-fame_ron-mix_b_.gif
Images above – gridiron-uniforms.com/[AFL 1961]; 1961 Fleer card from amazon.com.

Buffalo Bills.
Third-best drawing AFL team in 1961 was the up-and-coming Buffalo Bills, who drew 19.0 K at the rock-pile known as War Memorial Stadium. Despite their ramshackle venue, the Buffalo Bills would increase their crowd-size significantly in the following years, up to 43 K per game, en route to their 1964 and ’65 AFL titles. Buffalo might have played in a dump, but the franchise, owned by Detroit-based auto-dealership-heir Ralph Wilson Jr, was one of the three most stable franchises in the early AFL. (The other two stable early-AFL franchises being the Dallas Texans, owned by AFL founder Lamar Hunt, and the Houston Oilers, owned by AFL co-founder Bud Adams, both of whom came from big-oil-money.) In 1961, the Bills were still wearing their original colors of dark-blue-and-silver. The following year (1962), the Bills’ introduced their red-standing-buffalo helmet-logo, and their blue-white-red colors. (The Buffalo Bills would play at War Memorial Stadium until 1972, moving into their purpose-built 80-K-capacity stadium in 1973, in suburban Orchard Park, NY, located 11 miles south-east of Buffalo. The Bills are the only NFL team to lose four consecutive Super Bowl games [1990-93 seasons].)

Below: Hall of Fame player who was on the 1961 Buffalo Bills: Billy Shaw (OG).
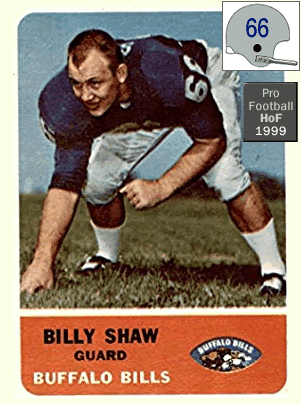
buffalo-bills-1961_billy-shaw_hall-of-fame_c_.gif
Images above – gridiron-uniforms.com/[AFL 1961]; 1962 Fleer card from amazon.com.

Dallas Texans.
Fourth-best drawing AFL team in 1961 was the Dallas Texans, a franchise that would end up in Kansas City, Missouri a couple years later [as the Chiefs]. The red-and-gold clad Texans had been the top draw in the AFL in the first season, drawing 24.5 K per game. This was a particularly impressive figure, when one considers the fact that the Dallas Texans of 1960 had to compete for fans with the also-brand-new NFL expansion team, the Dallas Cowboys. But by 1961, competition with the Cowboys, for the local fan-dollar, was starting to erode the Texans’ support. Attendance fell 7 K per game, to 17.5 K in 1961. Dallas Texans owner-and-league-founder Lamar Hunt was beginning to see that his upstart AFL team could not compete locally with the long-established NFL, especially if (and when) the then-basement-dwelling Cowboys improved. The Dallas Texans would go on to win the 1962 AFL title, only to up stakes and move to Kansas City in 1963. (The Kansas City Chiefs went on to win 2 AFL titles [1966 & 1969], and the Chiefs won the last game ever played by an AFL team, Super Bowl IV [Jan 1970], over the Minnesota Vikings. The Chiefs have not appeared in a Super Bowl game since then.)

Below: standout player who was on the 1961 Dallas Texans: Abner Haynes (HB) [1960 AFL MVP & 1960 AFL Rookie of the Year].
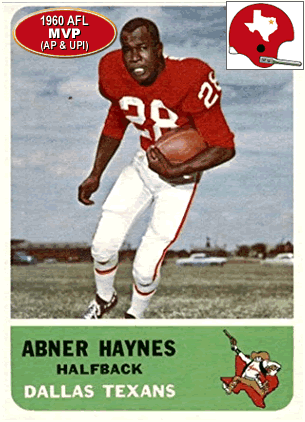
dallas-texans-1961_abner-haynes_1960-afl-mvp_b_.gif
Images above – gridiron-uniforms.com/[AFL 1961]; 1962 Fleer card from amazon.com.

Boston Patriots.
Fifth-best drawing AFL team in 1961 was the Boston Patriots, who drew almost exactly the same sized crowds in their first two seasons (16.8 K in ’60; 16.5 K in ’61). The red-white-and-blue clad Patriots played at Boston University’s Nickerson Field. In their first season, the Patriots sported a bizarre-looking helmet-logo: a blue 18th-century-style tri-corner hat, floating on a white field atop red uniform-numbers {see it in the attendance chart further above, or here, at helmethut.com}. They wisely scrapped that confusing logo, and in 1961, the Patriots introduced their new helmet logo, a Minuteman-in-a-3-point-stance-hiking-a-football (aka Pat Patriot; that logo remained up to 1992). As mentioned before, the Patriots broke even in 1961, and this was an example of the relative stability that this franchise offered to the AFL in its wild and woolly early years. But the Patriots in their first eleven years had a vagabond-like existence, playing in 4 different venues…at Boston University (1960-62), then at MLB’s Fenway Park (1963-68), then at Boston College’s Alumni Stadium [in Chestnut Hill, MA] (in 1969), and then at Harvard Stadium (in 1970). In 1971, the Patriots finally got a purpose-built stadium, Foxborough, located completely outside of Boston, 23 miles south-west of downtown Boston, and 21 miles north-east of Providence, RI [hence their name-change to a more regional moniker, the New England Patriots]. (The Patriots would not win a title until 2001, but have now won 5 Super Bowl titles [last in the 2016 season].)

Below: standout player who was on the 1961 Boston Patriots: Gino Cappelletti (SE/K) [1964 AFL MVP].
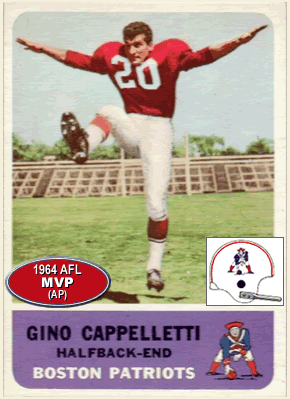
boston-patriots-1961_gino-cappelletti_b_.gif
Images above – gridiron-uniforms.com/[AFL 1961]; 1962 Fleer card from psacard.com/team-sets/1960-1969-decade-patriots.

In 1961, there were two struggling AFL franchises: Oakland and New York, plus another bad-drawing team, in Denver.
The Oakland Raiders.
The Oakland Raiders were the last AFL franchise to organize, and this hurt them considerably, because the Raiders had no time to secure a viable venue. The largest football venue on the East Bay was in Berkeley: the University of California’s 81-K-capacity Memorial Stadium. But the Cal administrators refused to let the Raiders play there. So the Raiders were forced to play in San Francisco for their first two seasons. In 1960, the black-helmeted Raiders played at the home of the NFL’s San Francisco 49ers, at Kezar Stadium, and they drew just 9.4 K per game. After their first season the Raiders franchise was half-a million in debt and needed a $400,000 loan from Bills owner Ralph Wilson, Jr. to stay afloat. Then in 1961, the Raiders were forced to play at the windy and cold MLB-venue, Candlestick Park, and the Raiders drew a pathetic 7.6 K per game, and posted the league’s worst record (2-12). All this was because there was no suitable venue yet, across the Bay in Oakland. And the city of Oakland would not finish building the delay-plagued Oakland Coliseum complex for five more years. The Raiders threatened to re-locate, and the city of Oakland responded by slapping together a temporary stadium that was basically scaffolding. That was Frank Youell Field, located in a mixed-industrial area near downtown Oakland. It was supposed to be temporary, but thanks to multiple delays in the building of the Oakland Coliseum, the Raiders ended up playing at the small 22-K-capacity Youell Field for four years (1962-65) {see Raiders in the Youell Field era, in this illustration}. (Al Davis would be hired by the Raiders as head coach/GM, in January 1963, introducing the Raiders’ silver-and-black colors that year.) (The Raiders moved to Los Angeles, CA in 1982. After 13 years in LA, the Raiders moved back to Oakland, CA in 1996. The Raiders will move out of Oakland for the second time in 2019 or 2020, this time to play in Greater Las Vegas, NV. The Raiders won the 1967 AFL title, and have won 3 Super Bowl titles [last in the 1983 season].)

Below: Hall of Fame player who was on the 1961 Oakland Raiders: Jim Otto (C).
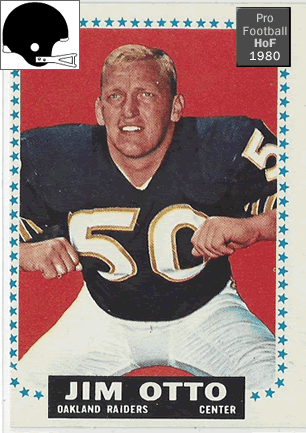
raiders-1961_jim-otto_hall-of-fame_d_.gif
Images above – gridiron-uniforms.com/[AFL 1961] ; 1963 Fleer card from marketplace.beckett.com.

New York Titans.
The NY Titans were stuck playing at the decrepit old Polo Grounds on the northern tip of Manhattan, NYC. The Titans were drawing poorly for a big-city team (at 15-K-per-game, which most observers felt was a grossly inflated figure). And the Titans ownership group was so cash-strapped that the following year, in order to meet payroll, the franchise would need big cash infusions from Dallas Texans owner-and-league-founder Lamar Hunt. (In 1963, the dark-blue-and-gold clad New York Titans franchise changed ownership, and became the green-and-white clad New York Jets. Then in 1964, the NY Jets would move out of the soon-to-be-demolished Polo Grounds, and into the big new municipal venue built by the City of New York, Shea Stadium in Queens, NYC. And in the ensuing years (1964-on), the Jets’ league-leading attendance would go on to skyrocket past 50 K per game, then past 60-K per game [and to full-capacity at Shea] by ’67. The New York Jets went on to win the 1968 AFL title, then the plucky Jets upset the NFL’s Baltimore Colts to win Super Bowl III [Jan. 1969]. The Jets have not appeared in any title game since then. The NY Jets have played in the state of New Jersey since 1984 [sharing a venue with the NY Giants].)

Below: Hall of Fame player who was on the 1961 New York Titans: Don Maynard (E).
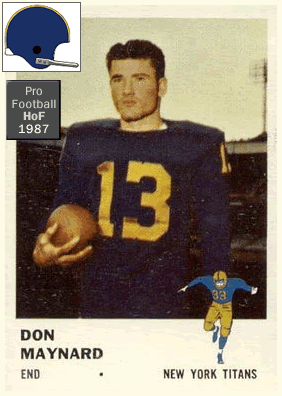
new-york-titans-1961_hall-of-fame_don-maynard_b_.gif
Images above – gridiron-uniforms.com/[AFL 1961]. 1962 Fleer card, unattributed at pinterest.com.

Denver Broncos.
In 1961, the brown-and-mustard-yellow clad Denver Broncos were also drawing poorly, pulling in just 10.6 K per game. But time would later show that the Broncos’ sparse crowds in their first few seasons was mainly a result of how bad the team was (the Broncos went 3-11 in 1961). First proof of that was a year away: in 1962, the now-orange-and-blue clad Broncos won 4 more games, going 7-7, and drawing over 14 thousand more per game, at 25.4 K. (The Denver Broncos have remained on the same site in Denver since their inception in 1960…playing at Bears Stadium/Mile High Stadium [for 41 years up to 2000], and then at Broncos Stadium at Mile High [since 2001]. The Denver Broncos have won 3 Super Bowl titles [last in the 2015 season].)

Below: standout player who was on the 1961 Denver Broncos: Lionel Taylor (SE) [5-time All-AFL].
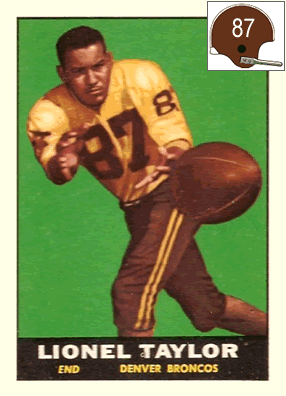
denver-broncos-1961_lionel-taylor_c_.gif"denver-broncos-1961_lionel-taylor_c_.gif"
Images above – gridiron-uniforms.com/[AFL 1961]; 1961 Topps card from vintagecardprices.com.

    1961 AFL Championship game (the Houston Oilers beat the Chargers in the title game, for the second straight season)…

The 1961 AFL title game was marred by poor officiating. It also featured 13 turnovers. Oilers QB George Blanda gave up 5 interceptions. But his 35 yd TD pass to Billy Cannon in the 3rd Q was the difference (see photos below). The irony was that the Houston Oilers, who had a high-powered offense that set records in 1961, won the AFL title that year thanks to a defense that kept the Chargers from scoring a TD.
http://billsportsmaps.com/wp-content/uploads/2018/12/houston-oilers_1961_afl-champions_balboa-stadium_george-blanda_billy-cannon_charlie-hennigan_n_.gif
Photo and Image credits above – 1961 AFL title game at Balboa Stadium, program from afl-football.50webs.com. George Blanda scrambling, photo by Hy Peskin at hypeskin.com/1961-afl-championship-houston-oilers-at-san-diego-chargers. George Blanda [photo from 1961 AFL Title game], photo by Hy Peskin at gettyimages.com. Billy Cannon on sideline, photo by Hy Peskin at hypeskin.com. Billy Cannon making a reception, photo by David F. Smith/Associated Press via nytimes.com/2017/11/02/sports/houston-championships. Chargers coaches berate lineman, photo unattributed at goldenrankings.com/AFLchampionship1961. Los Angeles Examiner headline Dec 25 1961, “Old Pro Blanda Whips Gillman Again”, from ebay.com. George Blanda scrambling, photo unattributed at fs64sports.blogspot.com. Oilers [1960 photo] in huddle, unattributed at sportsecyclopedia.com/nfl. Charlie Hennigan, unattributed at nflpastplayers.com. Oilers players on bench [photo circa 1961], screenshot from Full Color Football #1 uploaded by TheAFLHistory at youtube.com.
__
Photo and Image credits on the map page…
Houston Oilers,
Oilers players on bench [photo circa 1961], screenshot from Full Color Football #1 uploaded by TheAFLHistory at youtube.com. Reproduction of 1960-61 Houston Oilers helmet, photo from supersportscenter.com. George Blanda [photo circa 1964], unattributed at goldenrankings.com. George Blanda [photo from 1961 AFL Title game], photo by Hy Peskin at gettyimages.com. Don Floyd [1961 Fleer card], from marketplace.beckett.com. Billy Cannon [photo circa 1961], unattributed at fanbase.com. Charley Tolar [1965 photo/re-done as quasi=1961 Fleer card], from boblemke.blogspot.com. Bill Groman [photo from 1960], photo unattributed at sportsecyclopedia.com/[Houston Oilers]. Tony Banfield [1962 Fleer card], from footballcardgallery.com. Charlie Hennigan [photo circa 1964], unattributed at crazycantoncuts.blogspot.com. Al Jemison [1962 Fleer card], from ebay.com.

Offensive stats leaders on map page,
George Blanda [photo circa 1961], photo unattributed at fs64sports.blogspot.com. Billy Cannon [photo circa 1962], from AP via chron.com/sports. Charlie Hennigan [photo from 1961 AFL title game], photo by http://hypeskin.com/wpbeta/1961-afl-championship-houston-oilers-at-san-diego-chargers//wpbeta/1961-afl-championship-houston-oilers-at-san-diego-chargers/”>hypeskin.com. Bill Groman [1961 Fleer card], from amazon.com.

Thanks to,
-Blank map by anonymous US federal government employee, at File:StatesU.svg (commons.wikimedia.org).
-Thanks to Sportslogos.net for 1960-era AFL team logos.
-Thanks to Buffalo Bills official site for original Bills logo (1960-61).
-Thanks to Infinite Jets blog for hard-to-find full-color NY Titans logo.
-Thanks to the Coffin Corner newsletter, for this pdf, profootballresearchers.org/archives/Website_Files/Coffin_Corner/13-04-430.pdf [AFL attendance by team 1960-69] .
-Thanks to the contributors at pro-football-reference.com.
-Thanks to the contributors at AFL 1961 season (en.wikipedia.org).
-Special thanks to Tim Brulia, Bill Schaefer and Rob Holecko of The Gridiron Uniform Database, for giving billsportsmaps.com the permission to use football uniforms illustrations from Gridiron Uniform Database {GUD}.

November 28, 2018

2018-18 FA Cup 2nd Round – map with attendances & fixture list/+ chart showing qualified clubs by league level./+ update, map of 3rd Round draw (69 clubs).

Filed under: 2018-19 FA Cup — admin @ 12:06 pm

2018-19_fa-cup_map_2nd-round_map-of-the-40-clubs_w-current-attendances-in-league_fixture-list_post_b_.gif
2018-18 FA Cup 2nd Round Proper- map with attendances & fixture list

By Bill Turianski on 28 November 2018; twitter.com/billsportsmaps.
Links…
-The competition…FA Cup (en.wikipedia.org).
-bbc.com/fa-cup.

2018-19 FA Cup 2nd Round – Qualified clubs by league-level…
2018-19_fa-cup_2nd-round_qualified-clubs-by-level_d_.gif


Update (9 December 2018)
Map of 3rd Round draw (69 clubs/ five 2nd R replays) Click on image below…

2018-19_fa-cup_3rd-round_draw_69-teams_post_e_.gif
3rd R draw (map of 69 clubs in the 2018-19 FA Cup 3rd R draw)

Update
(9 December 2018) -
Below: chart of clubs in the 2018-19 FA Cup 3rd Round draw (69 clubs/ five replays)…>
2018-19_fa-cup_3rd-round_qualified-clubs-by-level_69-teams-crests_k_.gif"

___
Thanks to all at the following links…
-Blank map of UK historic counties, by Nilfanion (using UK Ordnance Survey data), at File:United Kingdom police areas map.svg;
-Blank relief map of Greater London, by Nilfanion (using UK Ordnance Survey data), at File:Greater London UK relief location map.jpg;
-Blank relief map of Greater Manchester, by Nilfanion (using Ordnance Survey data), at File:Greater Manchester UK relief location map.jpg (commons.wikimedia.org).
-Blank relief map of West Midlands, by Nilfanion, at File:West Midlands UK relief location map.jpg -Fixtures, bbc.com/sport/football/fa-cup/scores-fixtures/2019-01.
-Soccerway.com, for avg attendance figures (levels 3-6).

November 17, 2018

Scotland: map of all clubs that drew above 1 K (22 clubs/2017-18 figures), with seasons in 1st Level and Scottish titles listed./+ The two clubs promoted to the Premiership for 2018-19 (St Mirren, Livingston).

Filed under: Scotland — admin @ 1:03 pm

scotland_attendance-map_2018_all-clubs-drawing-above-1-k_w-seasons-in-1st-div_scottish-titles_post_e_.gif
Scotland: map of all clubs that drew above 1 K (22 clubs/2017-18 figures), with seasons in 1st division and Scottish titles listed


By Bill Turianski on 12 November 2018; twitter.com/billsportsmaps.

Links…
-Premiership table, fixtures, results, attendance, teams, etc…Premiership [2018-19] (soccerway.com).
-BBC/Sport, bbc.com/Scottish Football.
-BBC Radio Scotland, Off the Ball ['The most petty and ill-informed football show on radio!', hosted by Stuart Cosgrove (journalist & St Johnstone supporter) and Tam Cowan (journalist & Motherwell supporter).]

Sources for chart:
-Attendance figures: us.soccerway.com/national/scotland/premier-league.
-Seasons in Scottish 1st Level, Scotland – All-Time Table (since 1890/91) [and ending at 2012-13] (rsssf.com).
-List of Scottish football champions;
-List of Scottish Cup finals/Performance by club;
-List of Scottish League Cup finals/Performance by club;
-Population figures: Scotland;
-List of metropolitan areas in the United Kingdom;
-List of towns and cities in Scotland by population (en.wikipedia.org).

The map shows all Scottish football clubs which drew over 1,000 per game in 2017-18.
Also listed on the map page are the following, with A through E listed in chart form at the right of the map, and F (populations) shown in a small chart on the left-side of the map…
A). Average attendance in 2017-18 (from 2017-18 domestic leagues – for 1st Level: 1st phase [16 or 17 home matches]; for 2nd and 3rd Levels: 18 home matches.)
B). Seasons spent in Scottish 1st Level (122 seasons of the Scottish top flight (1890-91 to 1938-39; 1946-47 to 2018-19). 2018-19 Level, and promotion/relegation noted.
C). Either: Consecutive seasons in the Scottish 1st level (since X season)…
D). Or, last season the club was in the Scottish 1st level.
E). Major titles, with last title listed (Scottish titles, Scottish FA Cup titles, Scottish League Cup titles, UEFA titles).
F). City and Town populations in Scotland (Metro-area and Locality populations of the 25 largest cities and towns in Scotland [2011 and 2012 figures]).

There were 22 Scottish clubs that drew above 1,000 per game in 2017-18, comprising all 12 clubs in the Premiership [1st level], 8 of the 10 clubs in the 2nd level (Scottish Championship), and 2 of the 10 clubs in the 3rd level (Scottish League One).

There were two 3rd-tier clubs which drew above 1 K last year. One was Raith Rovers, from Kirkaldy in Fife, on the north shore of the Firth of Forth (Raith are still in the 3rd division this season). The other was Ayr United, who are from the west coast of Scotland in Ayrshire. Ayr United won promotion to the Scottish Championship last season. Although it’s still rather early in the season, Ayr United could actually now win back-to-back promotions. As of 12 Nov 2018, Ayr are in first place in the 2nd division, 4 points ahead of the Highlands-based/just-relegated Ross County. Ayr United’s attendance is currently up about a thousand per game, from 1.5 K to 2.5 K. Although Ayr United have played in 35 seasons of the Scottish 1st level, they have not been in the top flight in 40 years (last in 1978-79).

If this map here had current [12 Nov 2018] attendance figures, all 22 of these clubs would still be on the map, plus one more club – Alloa Athletic, who were also promoted to the 2nd division in 2017-18. Alloa is located on the eastern edge of the Central Belt [aka the Central Lowlands], on the north side of the River Forth, at the point where the Forth turns into an estuary, 25 miles north-west of Edinburgh (by road), and 8 miles north of Falkirk. Alloa play at the 3,200-capacity Recreation Park, a ground which has a real Non-League feel to it {here’s an article about Alloa’s Recreation Park, Alloa Athletic, Recreation Park (scottishfootballgroundswordpresscom.wordpress.com)}.

    The two clubs promoted from the 2nd level to the Premiership for 2018-19: St Mirren and Livingston…

St Mirren FC.
St Mirren won the 2017-18 Scottish Championship by 8 points over Livingston. So, in 2018-19, St Mirren are playing their 98th season of Scottish top-flight football.

St Mirren are from Paisley, just west of Glasgow. (Paisley has a population of around 76,000; it is also considered part of Greater Glasgow. Paisley does not have City status, and is often called the largest town in Scotland.) Established way back in 1877, St Mirren were one of the 10 founding members of the Scottish Football League in 1890-91. (Note: only 4 of the founding clubs of Scottish top flight football are in the 2018-19 Scottish Premiership: Celtic, Rangers, Heart of Midlothian, and St Mirren.)

St Mirren have been wearing their Black-and-White vertical stripes since 1884. St Mirren have been regularly featuring red trim in their kits since the late 1980s {historicalkits.co.uk/Scottish_Football_League/St_Mirren}. Origin of the club’s name, ‘They are named after Saint Mirin, the founder of a church at the site of Paisley Abbey and Patron Saint of Paisley. There is also a street in Paisley named St Mirren Street.’ {-excerpt from en.wikipedia.org/St_Mirren_F.C.}.

Back in 2007, St Mirren sold its old ground, Love Street, to the Tesco retail chain, and with those proceeds, they were able to pay off their debts and then build their new ground, St Mirren Park. It is on a site about a mile west of where Love Street was, adjacent to a National Rail link. St Mirren Park opened in January 2009, with a capacity 8,023 (all seated). (The ground is also home of the Scotland U-21 team.) The stadium was built to have a capacity of around 2,700 less than Love Street. St Mirren were drawing in the 4.4 K range for a number of years, in their new home, before relegation in 2015.

From 2015 to 2018, St Mirren spent three seasons down in the Championship. St Mirren were drawing 3.5 K the first two seasons stuck in the 2nd tier, then saw crowds rebound back to 4.4 K in their promotion-run last season. Now back in the top tier, they are drawing about 1.1 K more, at 5.5 K. Thanks to not playing in a cavernous ground, St Mirren have the 5th-best percent-capacity in the Premiership right now…(Best Percent-Capacity figures in Scotland [12 Nov 2018]:
Rangers at 49 K and 97%-cap.
Celtic at 58.3 K and 96%-cap.
Hearts at 18.1 K and 90%-cap.
Hibs at 17.5 K and 86%-cap.
St Mirren at 5.5 K and 70%-cap. Source, soccerway.com.)

But St Mirren are having a tough time of it back in the Premiership, and currently sit second-to-last, in 11th place, one point above Dundee FC (with whom they drew 1-1, away, on Saturday the 11th of November). So it looks like the Saints will be facing a relegation battle this season. And the worrying thing for St Mirren fans is that their only win in the league came in their season opener versus Dundee.

st-mirren-fc_promoted-to-scottish-premiership-2018_st-mirren-park_c_.gif
Photo and Image credits above – Coat of Arms of the Town of Paisley, from ngw.nl/heraldrywiki. 18/19 St Mirren jersey, photo unattributed at footballshirtculture.com. Shot of Paisley Town Hall and surrounding neighborhood, photo Jeremy Watson at spanglefish.com/Watsononarchitecture. Aerial shot of St Mirren Park, photo by Thomas Nugent at geograph.org.uk. St Mirren fan’s pitch invasion [14 April 2018], photo unattributed at dailyrecord.co.uk.

Livingston FC.
Counting 2018-19, Livingston have played 6 seasons of top flight football. Livingston, West Lothian is located 18 miles west of central Edinburgh, and has a population of around 56,000. Livingston wear Amber-with-Black-trim {historicalkits.co.uk/Scottish_Football_League/Livingston}. Livingston are a club which was formed much more recently than most clubs in Scotland’s top few divisions. Livingston FC were established in 1943, as Ferranti Amateurs, a works team of the Ferranti engineering company, initially playing in the Edinburgh FA’s Amateur Second Division.

The club changed their name to Ferranti Thistle in 1948. The club did not get into the Scottish Football League until there was an opening in 1974. This came about due both to the demise of Third Lanark 7 years earlier, and the institution of a new three-tier format of the Scottish Football League, and so a place opened up in the 3rd tier. Ferranti Thistle joined the SFL by a vote of 21–16 over Inverness Thistle. At the same time (1974), the club changed its name to Meadowbank Thistle. 14 years later, in 1987-88, Meadowbank Thistle would have won promotion to the Scottish top flight, had there not being re-organization that season (the 1st level was reduced from 12 to 10 teams). The club changed its name to Livingston FC in 1995. This was the same year that Livingston’s Almondvale Stadium, capacity 9.5 K, opened.

In May 2001, the club was into their sixth year with their present-day name of Livingston, when they finally won promotion to the top flight, by winning the [2nd level] SFL First Division. Livingston then spent 5 seasons in the top tier (2001-06). Livingston’s crowd-size peaked in their first season up in the top level, with 7.4 K in 2001-02 {source: european-football-statistics.co.uk}. Then they drew in the 5-K-range for the next 4 years. But the club’s rise had come along with overspending, which led to financial turmoil, and Livingston were plunged into administration in February 2004. Two years later, Livingston were relegated (in 2005-06), when they finished last, 15 points from safety. That was one of the worst records by a SPL club, later eclipsed only by Gretna.

It got worse: in 2008-09 Livingston finished in 7th, 8 points above the drop, but were relegated to the [4th level] SFL 3, for breaking rules on insolvency. (The club had missed a deadline to pay debts to West Lothian Council, who owned Almondvale Stadium by this time.) Some felt this was the death-knell of the club. But the opposite happened. The following year, Livingston won the SFL 4th tier title by 15 points (in 2009-10). Then Livingston won the SFL 3rd tier title by 23 points in 2010-11. Then followed 4 second-tier-seasons of mostly mid-table finishes, before winning promotion back to the top flight in 2017-18, when Livingston won the Premiership play-offs. Livingston beat Dundee United 4-3 aggregate in the semifinals, and then Livingston beat Partick Thistle 3-1 aggregate in the finals.

So now Livingston have returned to the Scottish top flight for the first time in 13 years. As of 12 Nov 2018, Livingston are in 7th place (5 W, 4 D, 3 L), and have seen their crowds swell from 1.3 K to 4.4 K, back to what they were drawing in their original spell in the top tier. That current average attendance figure was enlarged by the 9.0 K attendance they had in a nil-nil draw versus Celtic, on Sunday the 11th. That the recently-promoted Livingston were able to hold the reigning Scottish champs to a scoreless draw is a sign that the club looks capable of establishing a foothold in the Scottish Premiership.

livingston-fc_promoted-to-scottish-premiership-2018_almondvale-stadium_b_.gif
Photo and Image credits above – Illustration of 18/19 Livingston jersey by historicalkits.co.uk/Scottish_Football_League/Livingston. Aerial shot of Almondvale Stadium by Mike Pennington at geograph.org.uk. Drone shot of Almondvale Stadium by David Laurie at youtube.com. Interior shot of Avondale Stadium, photo by Andrew Chapman at footballgroundguide.com.
___
-Thanks to Demis.nl, for images which allowed me to stitch together the blank topographic map of Scotland {via Demis Web Map Server}.
-Thanks to maiz at File:Scotland in the UK and Europe.svg (en.wikipedia.org).
-Thanks to Soccerway.com for attendances, from us.soccerway.com/national/scotland/premier-league.
-Thanks to European-Football-Statistics site for old attendances, european-football-statistics.co.uk.
-Thanks to RSSSF.com, rsssf.com/tabless/scotalltime.html.
-Thanks to the contributors at Scottish Premiership (en.wikipedia.org).

November 4, 2018

2018-19 FA Cup 1st Round map with current league attendances & fixture list. / + the team making its FA Cup 1st Round debut: Haringey Borough.

Filed under: 2018-19 FA Cup — admin @ 4:46 pm

2018-19_fa-cup_map_1st-round_map-of-the-80-clubs_w-current-attendances-in-league_fixture-list_post_e_.gif
2018-19 FA Cup 1st Round map, with league attendances & fixture list


By Bill Turianski on 4 November 2018; twitter.com/billsportsmaps.
Links…
-The competition…FA Cup (en.wikipedia.org).
-bbc.com/fa-cup.

2018-19 FA Cup schedule…
Below: Saturday match dates shown for each Round. The Final is on Saturday the 18th of May 2019.
2018-19_fa-cup_schedule_c_.gif

7th division side Haringey Borough (of Tottenham, North London) reach the First Round of the FA Cup for the first time…
Haringey Borough were founded in 1973, via the merger of Haringey Borough and Edmonton. The club’s roots go back to 1911, when an off-shoot of Tufnell Park formed Tufnell Spartans (renamed Wood Green Town 9 years later in 1920). Wood Green Town began playing at Coles Park in Tottenham, Haringey, North London in 1930. 40 years later, in 1970, Wood Green Town changed their name to Haringey Borough, which was three years before the merger with Edmonton.

Currently, Haringey Borough are a just-promoted 7th division club that draws 262 per game, and still play at Coles Park, which is located on White Hart Lane in Tottenham N17. (Coles Park is about a mile west of the location of Tottenham Hotspur’s still-under-construction new stadium-site.)

Until somewhat recently, Haringey Borough were a 9th division club with a rather dilapidated ground which featured no clubhouse, and they drew less than 50 per game. That changed when Tom Loizou came aboard in early 2009. Loizou had previously been in the Leyton Orient coaching set-up, and was at that point manager of 8th-division-side Cheshunt (in Hertfordshire). Haringey Borough were in a relegation-battle, and Loizou helped them avoid the drop to the 10th level. Then Loizou was given free rein (and a stake), by the chairman, to do what was necessary to improve Haringey Borough’s finances, the club’s squad, and their ground. So Tom Loizou added groundskeeper-duties to his job description, which freed up several hundred quid a month. And he expanded the weekly car-boot sale [aka Weekend Market], which takes place every Saturday, in the Coles Park parking lot. You can see a photo of Haringey Borough’s car-boot-sale-/-football-match scheme in the illustration below [from April 2014], and more photos at the following link {here: andyfuryfootballgrounds.wordpress.com/2014/04/04/coles-park-haringey-borough}. As Tom Loizou later told the Creases Like Knives blog [in 2017], ‘They had a moan about it at first, but it was the only way we could survive. And guess what, from the boot sale profits, we were able to build a clubhouse.’

In the meantime Haringey Borough had also gotten themselves promoted, winning the Essex Senior League in 2014-15, by a healthy 11-point margin. At that point, Haringey Borough were drawing 67 per game in league matches {source: nonleaguematters.co.uk/divisions/26/4/}. The next season (2015-16), now up in the 8th tier Isthmian D-1 North, Haringey Borough finished in 15th place. The following season of 2016-17 saw the club introduce their new 3G pitch (which opened up more income opportunities via pitch-rental); and the improved Haringey squad went on to finish in 5th place (losing in the play-off semi-finals). And then, in 2017-18, Haringey finished in 4th, going on to win the 2018 Ishtmian D-1 North play-off final, 3-1 over Canvey Island. So in May of 2018, Haringey Borough under Tom Loizou had won their second promotion in 4 years.

At this point, Haringey Borough were drawing 161 per game. Six months later to the present-day, Haringey Borough, now in the 7th tier Isthmian Premier Division, are drawing a hundred more, at 262 per game (as of 4 Nov 2018). But Haringey could be in for a relegation battle, as they currently are in 18th place (although they have a few games in hand).

Those games in hand are the result, of course, of Haringey Borough’s Cup run this season: Haringey Borough have just qualified for the FA Cup 1st Round for the first time ever. Haringey Borough had to advance through 5 of the 6 Qualifying Rounds to make it to the 1st Round Proper. Here is how they got there…Haringey beat Stanway Rovers (9th level) in the Preliminary Round [before 151 at Coles Park]. Then Harginey beat Brentwood Town (8th level) [away] in the 1st QR. Then Haringey beat Erith Town (9th level) in the 2nd QR [before 187 at Coles Park]. Then Haringey beat AFC Sudbury (8th level) in the 3rd QR [before 209 at Coles Park]. Then Haringey beat Poole Town (7th level) in the 4th QR [before 402 at Coles Park]. In the final qualifying match, after conceding a 1st half penalty-goal to Poole Town, Haringey scored two 2nd half goals within a 6-minute span, with goals by Jorge Djassi-Sambu (77′) and by Joel Nobule (83′) {see photos and captions below}.

Haringey Borough’s reward for their Cup-run is a choice home draw in the 1st Round, versus AFC Wimbledon. Haringey Borough’s match versus the storied South-London-based 3rd-division supporter-owned club AFC Wimbledon will be televised live on BBC-2. It is the opening game for the weekend, kickoff at 7:55 [2:55 ET] on Friday the 9th of November, at Coles Park, which has a capacity of 2,500 (280 seated). At this posting [5 days before the event], the match had not been sold out, but tickets will probably go fast. {haringeyboroughfc.com.}

haringey-borough_coles-park-tottenham_2018-19-fa-cup-1st-round_tom-loizou_z6_.gif
Photo and Image credits above – Satellite image of Coles Park from bing.com/maps. Exterior shot of Coles Park: entrance, photo by BeautifulGame15 at facebook.com/pg/BeautifulGame15. Haringey Borough coaches’ jacket crest, photo from creaseslikeknives.wordpress.com/2017/01/11/come-on-boro-an-interview-with-tom-loizou. Car-boot sale at Coles Park [2014 photo], by andyfuryfootballgrounds.wordpress.com/2014/04/04/coles-park-haringey-borough. Haringey Borough manager Tom Loizou, photo by Simon O’Connor via hamhigh.co.uk. Shot of main stand from haringeyboroughfc.net. Shot of main stand during a match, photo by BeautifulGame15 via beautifulgame2015.blogspot.com. Jorge Djassi-Sambu (14) scores the equalising goal for Haringey Borough during their FA Cup fourth qualifying round clash at home to Poole Town, photo by George Phillipou/TGS Photo via hamhigh.co.uk/sport/football/haringey-borough-afc-wimbledon-broadcast-live. Joel Noubule, photo from tgsphoto.photoshelter.com. Haringey players and coaching staff celebrate after qualifying for the FA Cup 1st Round, photo unattributed at isthmian.co.uk/bostik-matchday.

___
Thanks to all at the following links…
-Blank map of UK historic counties, by Nilfanion (using UK Ordnance Survey data), at File:United Kingdom police areas map.svg;
-Blank relief map of Greater London, by Nilfanion (using UK Ordnance Survey data), at File:Greater London UK relief location map.jpg;
-Blank relief map of Greater Manchester, by Nilfanion (using Ordnance Survey data), at File:Greater Manchester UK relief location map.jpg (commons.wikimedia.org).

-Soccerway.com, for most avg attendance figures (levels 3-5).
-Non-LeagueMatters.co.uk, for avg attendance figures (levels 6 and 7).

-haringeyboroughfc.com/Club History.
-Come on Boro – an Interview with Tom Loizou [Jan 2017] (creaseslikeknives.wordpress.com).
-Interview of Tom Loizou of Haringey Borough by Bostik League site from Oct 2017 (isthmian.co.uk).
-andyfuryfootballgrounds.wordpress.com/2014/04/04/coles-park-haringey-borough.
-facebook.com/pg/BeautifulGame15/photos.
-Tottenham’s Mbappé – Haringey Borough FC Vs Mildenhall Town FC, Bostik League North, Coles Park (31/03/18) (beautifulgame2015.blogspot.com).

« Newer PostsOlder Posts »

Powered by WordPress