billsportsmaps.com

October 28, 2010

2010-11 Conference National (aka Blue Square Bet Premier League) – Stadia map.

Filed under: 2010-11 English Football,Eng-5th level,Football Stadia — admin @ 5:40 pm

2010-11conference_segment_c.gif
2010-11 Conference National


The Seasons in 5th Level statistic I have included in each club’s profile box on the map page needs some clarification. There was no automatic promotion into the Football League before 1986-87, and because there was no nationwide Non-League division before 1979-80, it is impossible to determine what was the 5th level of English football prior to the formation of the Alliance Premier League in 1979-80 (so the Seasons in 5th Level statistic is for the 32 seasons from 1979-80 to 2010-11). The Alliance Premier League was given one promotion spot to the old Fourth Division in 1986-87, and at that point the APL changed it’s name to the Conference National (and began inserting a sponsors name into their official name, which is currently the Blue Square Bet Premier League). A second promotion spot was added starting in the 2002-03 season. There is talk these days of adding a third promotion spot, and the argument can be made that this is overdue.

The only way clubs could get into the League before 1986-87 was via election, and there was quite a bit of leeway for continually poor-performing League clubs in the lower reaches of the old Fourth Division. A whole lot of deserving Non-League football clubs never got the shot to play in the League. These days, tiny and unheralded clubs that had no League history prior to 1987 can and do move up the football pyramid…clubs like Dagenham & Redbridge and Yeovil Town in the 3rd Level (ie, League One), and seven clubs in the 4th Level (ie, League Two)… Barnet, Burton Albion, Cheltenham Town, Macclesfield Town, Morecambe, Stevenage, and Wycombe Wanderers. Meanwhile, clubs that were once mainstays of the lower Leagues, such as Darlington, Grimsby Town, Luton Town, Mansfield Town, Wrexham, and York City – well, they are finding it very hard to get back into the League. [Actually, Luton Town has spent more seasons in the top two levels of the League than the lower two levels, so their continuing stay in the wilderness of Non-League football must be especially frustrating to their 6,000-plus regular supporters.] To put it another way, the Conference is on the upswing…in terms of on-field quality, and in terms of fan support.

From Two Hundred Percent.net, from 11th October, 2010, by Ian King, ‘League Two and the Blue Square Premier: The Blurring of the Lines‘.

Usually when I make maps with club profile boxes, I include each club’s national titles and national cup titles. That would just end up being wasted space here (the only club here with a ‘major’ title is Luton Town, who won the League Cup in 1988, but I never list the League Cup anyway). So I decided to use the space for 2 topical categories…each club’s all-time best FA Cup run, and best FA Cup run in the last 20 seasons (with all FA Cup runs which reached the 5th Round or higher listed; and all joint-best runs listed). Which is just in time for the 2010-11 FA Cup First Round Proper, to be played the weekend of November 5th through the 7th. My map on 2010-11 FA Cup First Round Proper will be posted Wednesday evening, 3rd November. 14 of the 24 Conference National clubs are in the FA Cup 1st Round {BBC/FA Cup, here}, as well as 18 other, lower-placed Non-League clubs.

2009-10 average attendances (from league home matches) are shown at the bottom, center of the map page. The following link has current 2010-11 Conference National average attendances…{from www.mikeavery.co.uk/Divisional Attendance – scroll one quarter down the page to find the fifth box of stats which is 2010-11 Conference Premier Average Home Attendance, here}.
-
Thanks to the contributors to the pages at en.wikipedia.org, ‘2010-11 Football Conference‘.

Thanks to the Footy Mad.co.uk sites, for each club’s league history and cup history data, http://www.footymad.net/blue-square-premier-news/ . Note: this following set of pages on the Football365 site was also very helpful for data, even if it is 9 years now since it has been updated [set to all-time 4th tier, up to 2001-02], http://stats.football365.com/hist/tier4/attable.html

Thanks to mikeavery.co.uk, for 2009-10 attendance figures and attendance rankings.

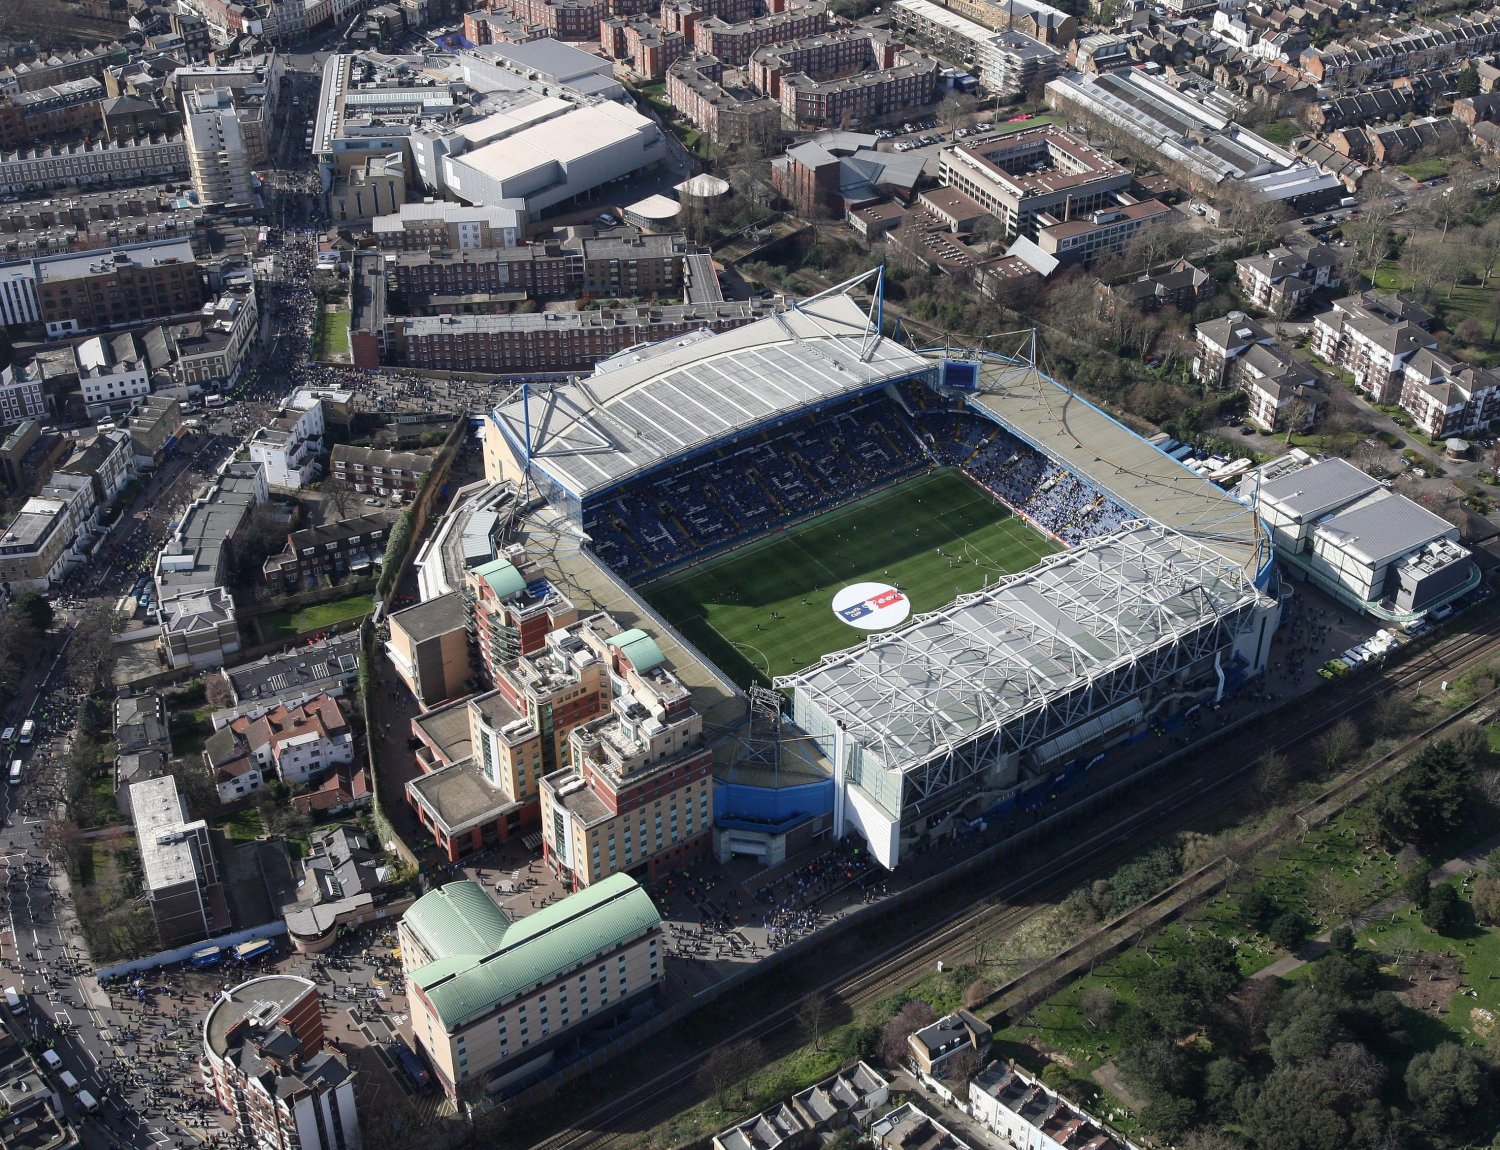
Thanks to Bing.com/maps/Bird’s Eye view…21 of the football grounds photos on the map page are from this feature. I can’t get images by going to Bing.com, though…I get them by going to each club’s page at en.wikipedia.org, clicking onto the club’s ground, then clicking on the blue-lit numbers of the football ground’s geographical coordinates. There are no Bing.com Bird’s Eye view images for 3 Conference grounds…Barrow’s Holker Road, and Forest Green Rovers’ New Lawn, so for those I had to settle for images via Google Earth satellite view; and Rushden & Diamonds’ Nene Park, so I used an image submitted by jim21 at the en.wikipedia.org page on Nene Park.

October 6, 2010

League Two, 2010-11 season – Attendance map (2009-10 figures).

Filed under: 2010-11 English Football,Eng-4th Level/League Two — admin @ 5:23 pm

Note: to see my most recent post on the English 4th division, click on the following: category: Eng-4th Level/League 2.
.
.
.
.
.
.
.
.
.
.
.
.
.
.
.

league-two2010-11_09-10attendances_post_.gif
League Two, 2010-11 season


Port Vale FC toil under the radar and in obscurity in Burslem, Stoke-on-Trent, Staffordshire. The Valiants are the rather surprising leaders of League Two after 10 matches. Port Vale have won 4 of their last 5 matches and sit atop League Two with 22 points, 3 points ahead of Chesterfield. [Chesterfield are riding a club resurgence and a swell-in-attendances following the opening of their new ground, B2net Stadium{photos, here; en.wikipedia.org page, here}.

In September, 2009, Port Vale manager Mickey Adams placed the entire squad on the transfer list, after he judged the team to be basically not trying hard enough {here is an article from the Guardian.co.ik, by Louise Taylor, from 29 September, 2009, 'Micky Adams is playing a dangerous game at Port Vale'}. This move had followed a poor 2008-09 season, when Vale finished 18th, and that had followed relegation in 2007-08. So Adams in one stroke called the entire squad out on their professionalism and lit a fire under them. Port Vale then finished eight places higher and with 20 more points than the season before. So it can be judged that Adams' move worked, seeing as how there actually was little in the way of an injection of talent in the squad throughout last season, because Vale are one of the many clubs these days that is operating on a shoestring budget (even if their gates are higher than many of their fellow fourth division clubs...Port Vale averaged 5,080 per game last season, this in a league where the median average attendance in 09/10 was around 3,600).

I hope Port Vale keep up the good form, and decent crowds continue to show at Vale Park, like the 8,443 who attended the 28th September match versus high-flying nearby rivals from 50 km. to the west, Shrewsbury Town (which Vale won 1-0, with a 74th minute goal by the veteran MF Gary Roberts). Because what Port Vale need, apart from consistency, is for more people from the Six Towns that make up the Potteries to start showing up at Vale Park, a ground that holds 18,947 {Vale Park page at port-vale.co.uk, here}`; FootballGroundsGuide.com page, here} and is frankly too large for a club the size of Port Vale. Port Vale are just like Notts County in that they are also the second biggest club in a mid sized English Midlands city, and just like Notts County, Port Vale had a taste of success around 15-20 years back. But of course Vale only made it to the 2nd Level before their recent, decade-long slide, and are in fact the club which has played the longest number of seasons in the second tier without ever having made it to the top flight...Port Vale have played 41 seasons in the second division, yet have never won promotion to the first division. And also just like Notts County, when Port Vale in the past decided it was time to expand their ground, it was an over-expansion. Both significantly enlarged the capacities of their grounds to keep up with the town rivals (Port Vale's being Stoke City...{see this: 'The Potteries Derby', from en.wikipedia.org}; Notts County's being Nottingham Forest). These big expansions were undertaken in spite of the fact that attendance averages were decidedly far smaller than the planned expansion. Unlike Notts County, this occurred with Port Vale in 1949-1950 (while Notts County over-expanded following their last, single season in the top tier in 1991-92). Vale Park opened in 1950 with a 40,000 capacity (!). 40,000 capacity was, back then, and is, now, a ridiculous size for a mid-table, 3rd division football club, even in 1950 , which was during the Post-War era that saw dramatic attendance increases throughout the country [many clubs had their all-time average attendance high in the Post-War years around 1946-47 to 1949-50 or so, including Stoke City, who drew 31,500 per game in 1947-48]. This specter of a club that over-expanded and then languished is still apparent in Burslem, because Port Vale currently play in a ground with one stand uncompleted – the Lorne Street Stand, which was demolished in 1998, and only partially rebuilt, due to lack of funds. The rub is that the club built the posh bits of the Lorne Street Stand, namely, the Executive and Corporate boxes, but left a gaping blank concrete space below, with steps, but no seats.
port-vale_vale-park_lorne-street-stand_tims92.gif
At the time, Port Vale were riding high, coming off a plus-60-year best league finish, at 8th place in 1996-97 in the old Second Division, and a pre-popstar-fame Robbie Williams was probably having the time of his life supporting the Valiants. But Port Vale were drawing only around 8,000-9,000 per game back then (with a modern-day turnstile peak of 9,214 per game in 1994-95), in what turned out to be a last, 6-season spell in the second division. One can’t help but think this partially unfinished, yet still half-empty ground sets the tone for new arrivals to Vale Park, be they players or first-time-spectators. Because what does it say about the viability of a club that has left a gaping empty space in their ground for a dozen years? And that for decades has played to crowds that are less than 50% capacity ?
-
Thanks to Tims 92 site [English football stadium photos, League and Non-League]…Saturday, 17th January, 2009, Vale Park, Port Vale 1-1 Shrewsbury Town.
Thanks to The Groundhog.WordPress.com/visit to Port Vale (May 26,2007), here.
Thanks to the contributors to the pages at en.wikipedia.org, 2010-11 Football League 2
Thanks to www.mikeavery.co.uk , for attendance figures, 2009-10 Attendance all teams high to low.

September 20, 2010

League One, 2010-11 season – Attendance map (2009-10 figures).

Filed under: 2010-11 English Football,Eng-3rd Level/League One — admin @ 4:42 pm

league-one2010-11_09-10attendances_post_2b.gif
League One 2010-11 season, with 2009-10 attendances


Note: to see my latest map-&-post of the English 3rd division, click on the following, Eng-3rd Level/League One.

On the map page, the map shows a small club crest for location and a variably-sized club crest to denote 2009-10 average attendance (home league matches). The chart at the top right includes attendance rank in all leagues combined, which I found at (mikeavery.co.uk / 2009-10 Attendance Tables Median, Levels 1-8).
-
The first chart below shows the seasons spent in the 3rd Level by club, with each current League One club’s first arrival into the third tier listed.

-
At the top left on the map page and also below is a chart I put together that shows the total seasons each current League One club has spent in each of the top 4 levels of English Football. Included, in parenthesis, is the last year the club has spent in the level. The gray vertical bar in the center is 3rd Level/League One; within that bar is a tan bar which shows how many consecutive seasons each club has presently spent in the third tier. Of all clubs currently in League One, AFC Bournemouth has spent the most seasons in the 3rd Level…67 seasons. [I am pretty sure Bournemouth is also the longest-serving member of the 3rd Level overall throughout the English League system, but I guess I will find that out for sure when I make charts like this for the1st Level/Premier league, the 2nd Level/League Championship, and the 4th Level/League Two...which I will do sometime later in this season.] Oldham Athletic has currently spent the most seasons consecutively in the 3rd Level…14 seasons.

The five columns, from left to right, are: A). English titles. B). Seasons spent in the 1st Level. The 1st Level was originally called simply the Football League and had just 12 clubs in it (from 1888-89 to 1891-92). From 1892-93 to 1991-92, the top flight was called the First Division. From 1992-93 to the present, the English top flight has been the Premier League. C). The 2nd Level. Instituted in 1892, and called the Second Division (from 1892-93 to 1992-93). The 2nd tier of English football is now known as the Football League Championship. D). The 3rd Level. Instituted in 1920 (1920-21 season), and called the Third Division. Expanded to two geographical regions the next season, as the Third Division South and the Third Division North (from 1921-22 to 1957-58). With the addition of the 4th Level in 1958-59, the 3rd Level went back to being called the Third Division (1958-59 to 1991-92). The 3rd tier of English football is now known as Football League One. E). The 4th Level. Instituted in 1958 as the Fourth Division (1958-59 to 1991-92). The 4th tier of English football is now known as the Football League Two. This is the lowest level of the Football League. Level 5 and lower are called Non-League football [note: current League One clubs that spent some seasons in Non-League football are denoted with an asterisk at the far right of the chart.]

Thanks to the Footy-Mad sites for League History info on the clubs, Footy-Mad.net/League One
Thanks to Mike Avery, 2009-10 Attendance Table at mikeavery.co.uk .

August 9, 2010

England: Premier League, 2010-11 – Stadia map.

Note: to see my latest map-&-post of the Premier League, click on the following, category: Eng>Premier League (Eng. 1st division).


.
.
.
.
.
.
.
.
.
.
.
.
.
.
.
.
.
.
.
.
.
.
.
.
.
.
.
.
.
.
.
.
.
.
.
.
.
.
.
.
.
.
.
.
.
.
.
.
.
.
.
.
.
.
.
.
.
.
.
.
.
.
.
.
.
.
.
.
.
.
.
.
.
.
.
.
.
.
.
.
.
.
.
.
.
.
.
.
.
.
.
.
.
.
premier-league_stadia2010-11_post_b.gif

___

Thanks to Historical Football Kits site, for the kit illustrations.
-
Thanks to Blackpool Today/South Stand progress {gallery}. Blackpool Today – Pool Passion mini-site. Thanks to Fussball Tempel site [Football temples of the world] (Blackburn/Ewood Park photo).

Thanks to Wigan Athletic.co.uk/The DW Stadium. Thanks to Helibott aerial photography (Bolton/Reebok Stadium photo).

Thanks to ManUtdPics.com , (Manchester United/Old Trafford photo). Thanks to The Sun.co.uk (Manchester City/Eastlands photo).

Thanks to EFC Rule.com (Everton/Goodison Park photo). Thanks to FanZone.co.uk (Liverpool/Anfield photo).

Thanks to www.expressandstar.com (Wolves/Molineux photo). Thanks to Ticket4Football.com (West Brom/Hawthorns photo). Thanks to Football Pictures.net (Aston Villa/Villa Park photo).

Thanks to WSP Group.com (Newcastle/St. James’ Park photo). Thanks to Bing.com/maps – Bird’s Eye view (Sunderland AFC/Stadium of Light bird’s eye view, here}).

Thanks to the Daily Mail.co.uk (Spurs/White Hart Lane photo) ;
(Arsenal/Emirates stadium photo).

Thanks to Fussball Tempel.net (West Ham/Boleyn Ground photo).

Thanks to Eco Compact City.org (Chelsea/Stamford Bridge photo)). Thanks to Bing.com/Bird’s Eye (Fulham/Craven Cottage bird’s-eye satellite view).
-
Thanks to Mike Avery’s Non-League Football site, for attendance figures

August 4, 2010

England: The Football League Championship, 2010-11 season – attendance map, with average attendances and percent capacities (from 2009-10).

Filed under: 2010-11 English Football,Eng-2nd Level/Champ'ship — admin @ 2:35 pm


league-championship2010-11_post.gif


From The Two Unfortunates site,
Previews of League Championship clubs
{Part 1 – Barnsley through Leicester City}
{Part 2 – Middlesbrough through Watford}

You can find each club’s 2009-10 percentage capacity on the far right of the chart on the map page. The figures are hard to pin down, because a stadium’s total seat-capacity is always going to be slightly larger than the stadium’s capacity for a Football League Championship match, because rows or columns of seats are left empty, in order to separate home and away fans The same procedure, of course, also applies in the Premier League [as well as in Football Leagues One and Two, but there are rarely sell-outs in the two lower leagues of the Football League]. I used the Football Grounds Guide.com for stadium capacity figures {www.footballgroundsguide.com}.
I like percentage capacity because it sort of provides a bit of a picture…it’s one thing to say that a club draws 17,308 per game, but to also say that that club is playing to just a 53.3% capacity, well that sounds like the club has real problems. I’m talking about you, Coventry City…who own the worst 2009-10 percentage capacity figure for clubs in the League Championship this season. How does a relatively big club like Coventry City manage such a dismal capacity rate? 1. Prolonged stay in the 2nd Level without a reasonable hope of promotion. 2. Lackluster play and a manager on his way out. 3. A charmless stadium built outside the city center and in the middle of nowhere. 4. The generally poor economy.

The fact that the Championship is the 2nd Level of English football means that the clubs’ percentage capacity numbers will be, almost by definition, sort of low…more in the high 50% to low 70% range, for a majority of the clubs. That’s because usually most of the supporters of the lion’s share of clubs in the Championship believe their club to be worthy of the Premier League, and when they are not in the top flight, or do not seem to be progressing towards that goal, attendances go down. And the Championship clubs that had the ultimately most successful seasons the previous year are now in the top flight (certainly in 2 of the 3 cases of the promoted clubs each season). So high capacity-percentage clubs in the Championship are very often just-relegated clubs from the Premier League, and just-promoted clubs from the Football League One, In other words, a club that had never been in the Premier League and that only stays a season or two there before relegation back to the Championship (like both Burnley and Hull City); and conversely, a club with a devoted fan base that was immediately promoted back from the 3rd Level (like Norwich City). Another instance of a healthy percentage-capacity number would be a small club with a small stadium, punching above their weight in a division few thought they could survive in… like both Doncaster Rovers and Scunthorpe United, but actually, both these clubs were not in the top half of the percentage-capacity ranking…a better example would be Colchester United, who in one of their two seasons of second division football, in 2007-08, played to 87.2% capacity in their tiny, former ground, Layer Road. Another example of a high percentage-capacity club in the second tier is one that basically has excellent and virtually unwavering fan support, even if the club did not fare so well the previous season. Sheffield United and Ipswich Town have been in this category in recent seasons, but the best example of this from last season is Derby County, who had the second-best average attendance at 29,230 per game last season, even though they were pretty bad. [The best-drawing club in the Championship last season was, of course, Newcastle United, who drew 43,388 per game in their promotion-winning campaign.] That Derby County average attendance figure translates to a solid 87% capacity last season, even though the Rams won less than a third of their matches and finished in 14th place.

3 of the clubs mentioned above, Norwich, Hull, and Burnley, had percentage-capacity figures of over 90% last season. But you just know that lots and lots of those people who attended matches at Burnley’s Turf Moor last season did it believing that it could very well be the only season in their lifetimes that they could see Burnley play in the Premier League. After all, Burnley were drawing in the 11,000 to 13,000 per game range for over a decade before their shock promotion season of 2008-09. The crowds at Burnley will probably dwindle unless they remain competitive and mount another promotion campaign.

Hull is very different, because as they climbed the league pyramid from 2004 to 2008, their average crowds rose in tandem. It’s astounding to realize that in 2003-04, Hull City drew 16,847 in the fourth division (which was called the Nationwide Division Three). So I am sure that Hull will keep more of their paying customers this season than does Burnley. The other relegated club, Portsmouth, I am not sure what to expect. Pompey (and their supporters, including old Bill, here) had the season-from-hell in 2009-10 [FA Cup run notwithstanding], but Portsmouth still played to a respectable 88.4% capacity. Maybe some of those Pompey fans were attending games last winter and spring thinking they better go now because there might not be a next time, what with the real threat of Portsmouth being wound up early in 2010. Well, Portsmouth dodged that HMRC bullet, and they’re still around. I can see Portsmouth getting simillar-sized, 18,000 per game crowds this season. But really, who knows. They may end up unable to field a competitive squad. Administrator Andonikou says the club can’t pay above 10,000 pounds per week for players {see this (specifically the last sentance in the article), by Neil Allen, from the News (portsmouth.co.uk), from 4 August, 2010, ‘Recruitment drive begins despite uncertain future‘.). Pompey may end up being unable to field a competitive squad. If this happens, I fear plummeting crowds, and another relegation for Portsmouth.
-
Thanks to the contributors at en.wikipedia.org, 2010-11 Football League Championship.
Thanks to Mike Avery’s site at http://www.mikeavery.co.uk.
Thanks to The Football Ground Guide (for capacities of grounds), http://www.footballgroundguide.co.uk

July 31, 2010

Premier League, 2010-11 season: attendance map, with percentage capacities, from 2009-10.

premier-league2010-11_post_b.gif


The map shows average attendance of Premier League clubs, via proportionally-sized club crests. The higher the club’s average attendance, the larger the club’s crest is on the map.
On the left-hand side of the map page, there is a chart that shows 6 statistics…1). Attendance rank of each Premier League club within the whole English football pyramid. 2). Average attendance from 2009-10 domestic league matches {source: Mike Avery’s Non-League Football page, 2009-10 archive/Mean Average Crowd, here}. 3). Average attendance from 2 seasons ago (2008-09). 4). Percent change from 08/09 to 09/10. 5). Each club’s stadium capacity for Premier League matches {source: www.premierleague.com/Club Profiles, here}. 6). Percent Capacity (average attendance divided by capacity).

When you are talking about capacity of Premier League stadiums, the number is smaller than the number most sources give for that stadium. That’s because in Premier League grounds, for safety reasons, sections of seats in the stadiums are always left vacant to separate home fans from away fans. So for example, there are 76,312 seats in Manchester United’s Old Trafford, but the official Premier League site lists Old Trafford’s capacity at 75,769.

Look how tiny Blackpool’s crest is on the map. There were 50 clubs in England (and Wales) that had a higher average attendance than Blackpool last season. But Blackpool are now a Premier League club. Just one more example of the interesting wrinkles that the promotion/relegation system creates. Blackpool averaged 8,614 per game at Bloomfield Road, which had a capacity of only around 9,500 to 10,035 for four-fifths of last season. Because of ongoing construction and expansion of the Bloomfield Road ground, pinning down their percent capacity was a problem. I was unable to find definite stadium capacity for the period between late November and early March, so I listed percent capacities for the first 5 and last 5 home league matches (at the bottom of the chart).

Highest percentage-capacity numbers in the Premier League last season were…Arsenal (99.3%), Manchester United (98.81%), Tottenham (98.79%), Stoke City (98.77%), and Chelsea (97.6%). 4 of these 5 clubs also were the top four finishers in the league table. The other, Stoke City, are renowned for having the loudest fans in English football. Stoke finished a respectable 11th place in 2009-10, and are well on their way to re-establishing a firm footing in the top flight. This season will be their third season back in the top tier after a 23-season spell in the lower leagues [Stioke were in the second division for 16 seasons and in the third division for 7 seasons in two separate spells]. Once this season starts, Stoke City will have played 55 seasons in the English first division.

Clubs with the next-best percent-capacities, in the 90-97 percent capacity range were… Wolverhampton (96.8%), Manchester City (96.0%), West Ham United (95.4%), Liverpool (94.7%), and Fulham (93.8%).

Not surprisingly, Wigan Athletic once again had the lowest average attendance and the lowest percent capacity. Wigan averaged 18,006 per game, with a 71.6 percent-capacity. Second worst percent-capacity was by Bolton, who drew 21,881 per game with a 77.9 percent-capacity. The 3 relegated clubs, Hull City, Burnley, and Portsmouth, had very respectable percent-capacities, of 96.0% (Hull), 91.6 % (Burnley), and 88.4% (Portsmouth). That and the rest of the 2010-11 League Championship’s percent capacities is covered in my map and post of the Football League Championship, 2010-11 season – attendance map, with average atendances and percent capacities (from 2009-10), here.

We’ll see how the Green and Gold protest movement affects Man U’s attendance this season…it’s now three straight seasons that Old Trafford has seen a slightly diminished turnstile count. Here is a related article from the essential Two Hunderd Percent.net site, from 23rd July, 2010, by Ian King, ‘Conflicting Season Ticket Stories at Old Trafford

From the Dirty Tackle site, from 13 August, 2010, by Brooks Peck: ‘The five Premier League clubs to sell out their season tickets‘.
-
Thanks to the contributors to the pages at en.wikipedia.org, 2010-11 Premier League.
Thanks to www.mikeavery.co.uk, Mike Avery’s Non-League Football site.
Thanks to E-F-S site, E-F-S attendances.
Thanks to the official Premier League site, for stadium capacities, Club Profiles at premierleague.com

« Newer Posts

Powered by WordPress