By Bill Turianski on 27 May 2020; twitter.com/billsportsmaps.
Links…
-KBO teams…KBO League/ Teams (en.wikipedia.org).
-KBO official site/schedule, scores, standings; About KBO, etc. (in English, with Korean option)…http://eng.koreabaseball.com/.
-KBO 리그의 공식 사이트…http://www.koreabaseball.com/Default.aspx.
-The Korea Herald/baseball (koreaherald.com/[sports]/[baseball]).
-No MLB? Korean baseball is in full swing—here’s what you need to know, from KBO cheerleaders to bat-flipping (by Tom Huddlseston at cnbc.com on May 25 2020).
…
KBO League map-page…
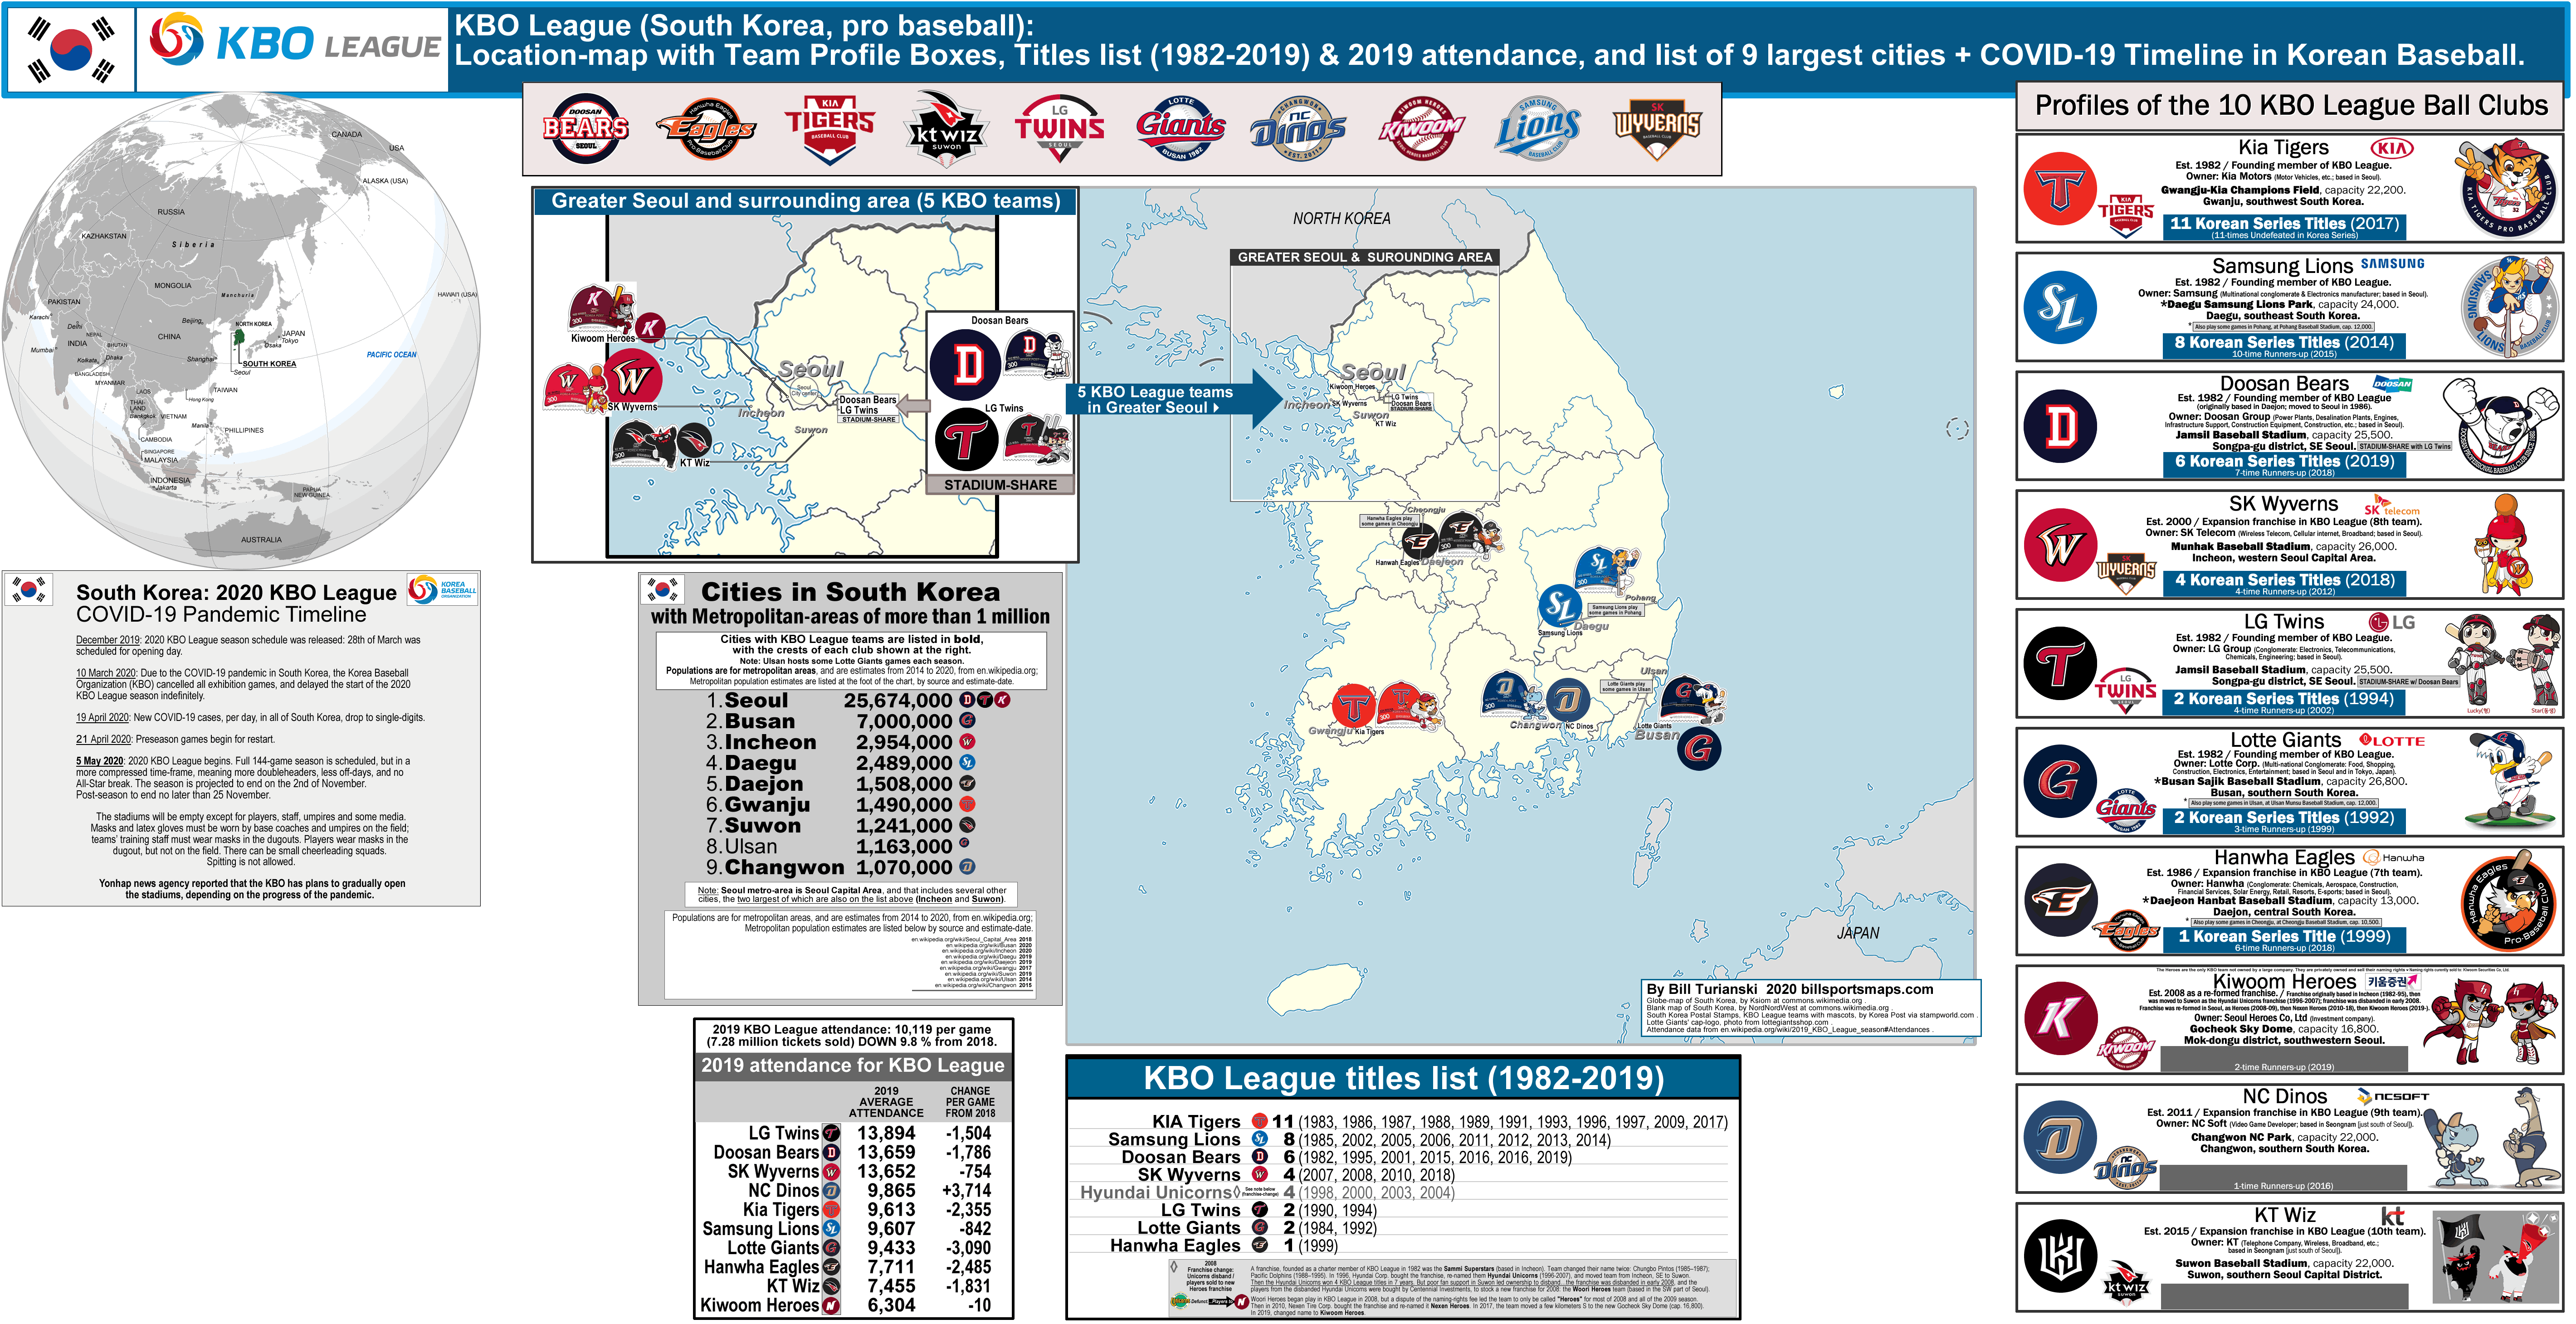
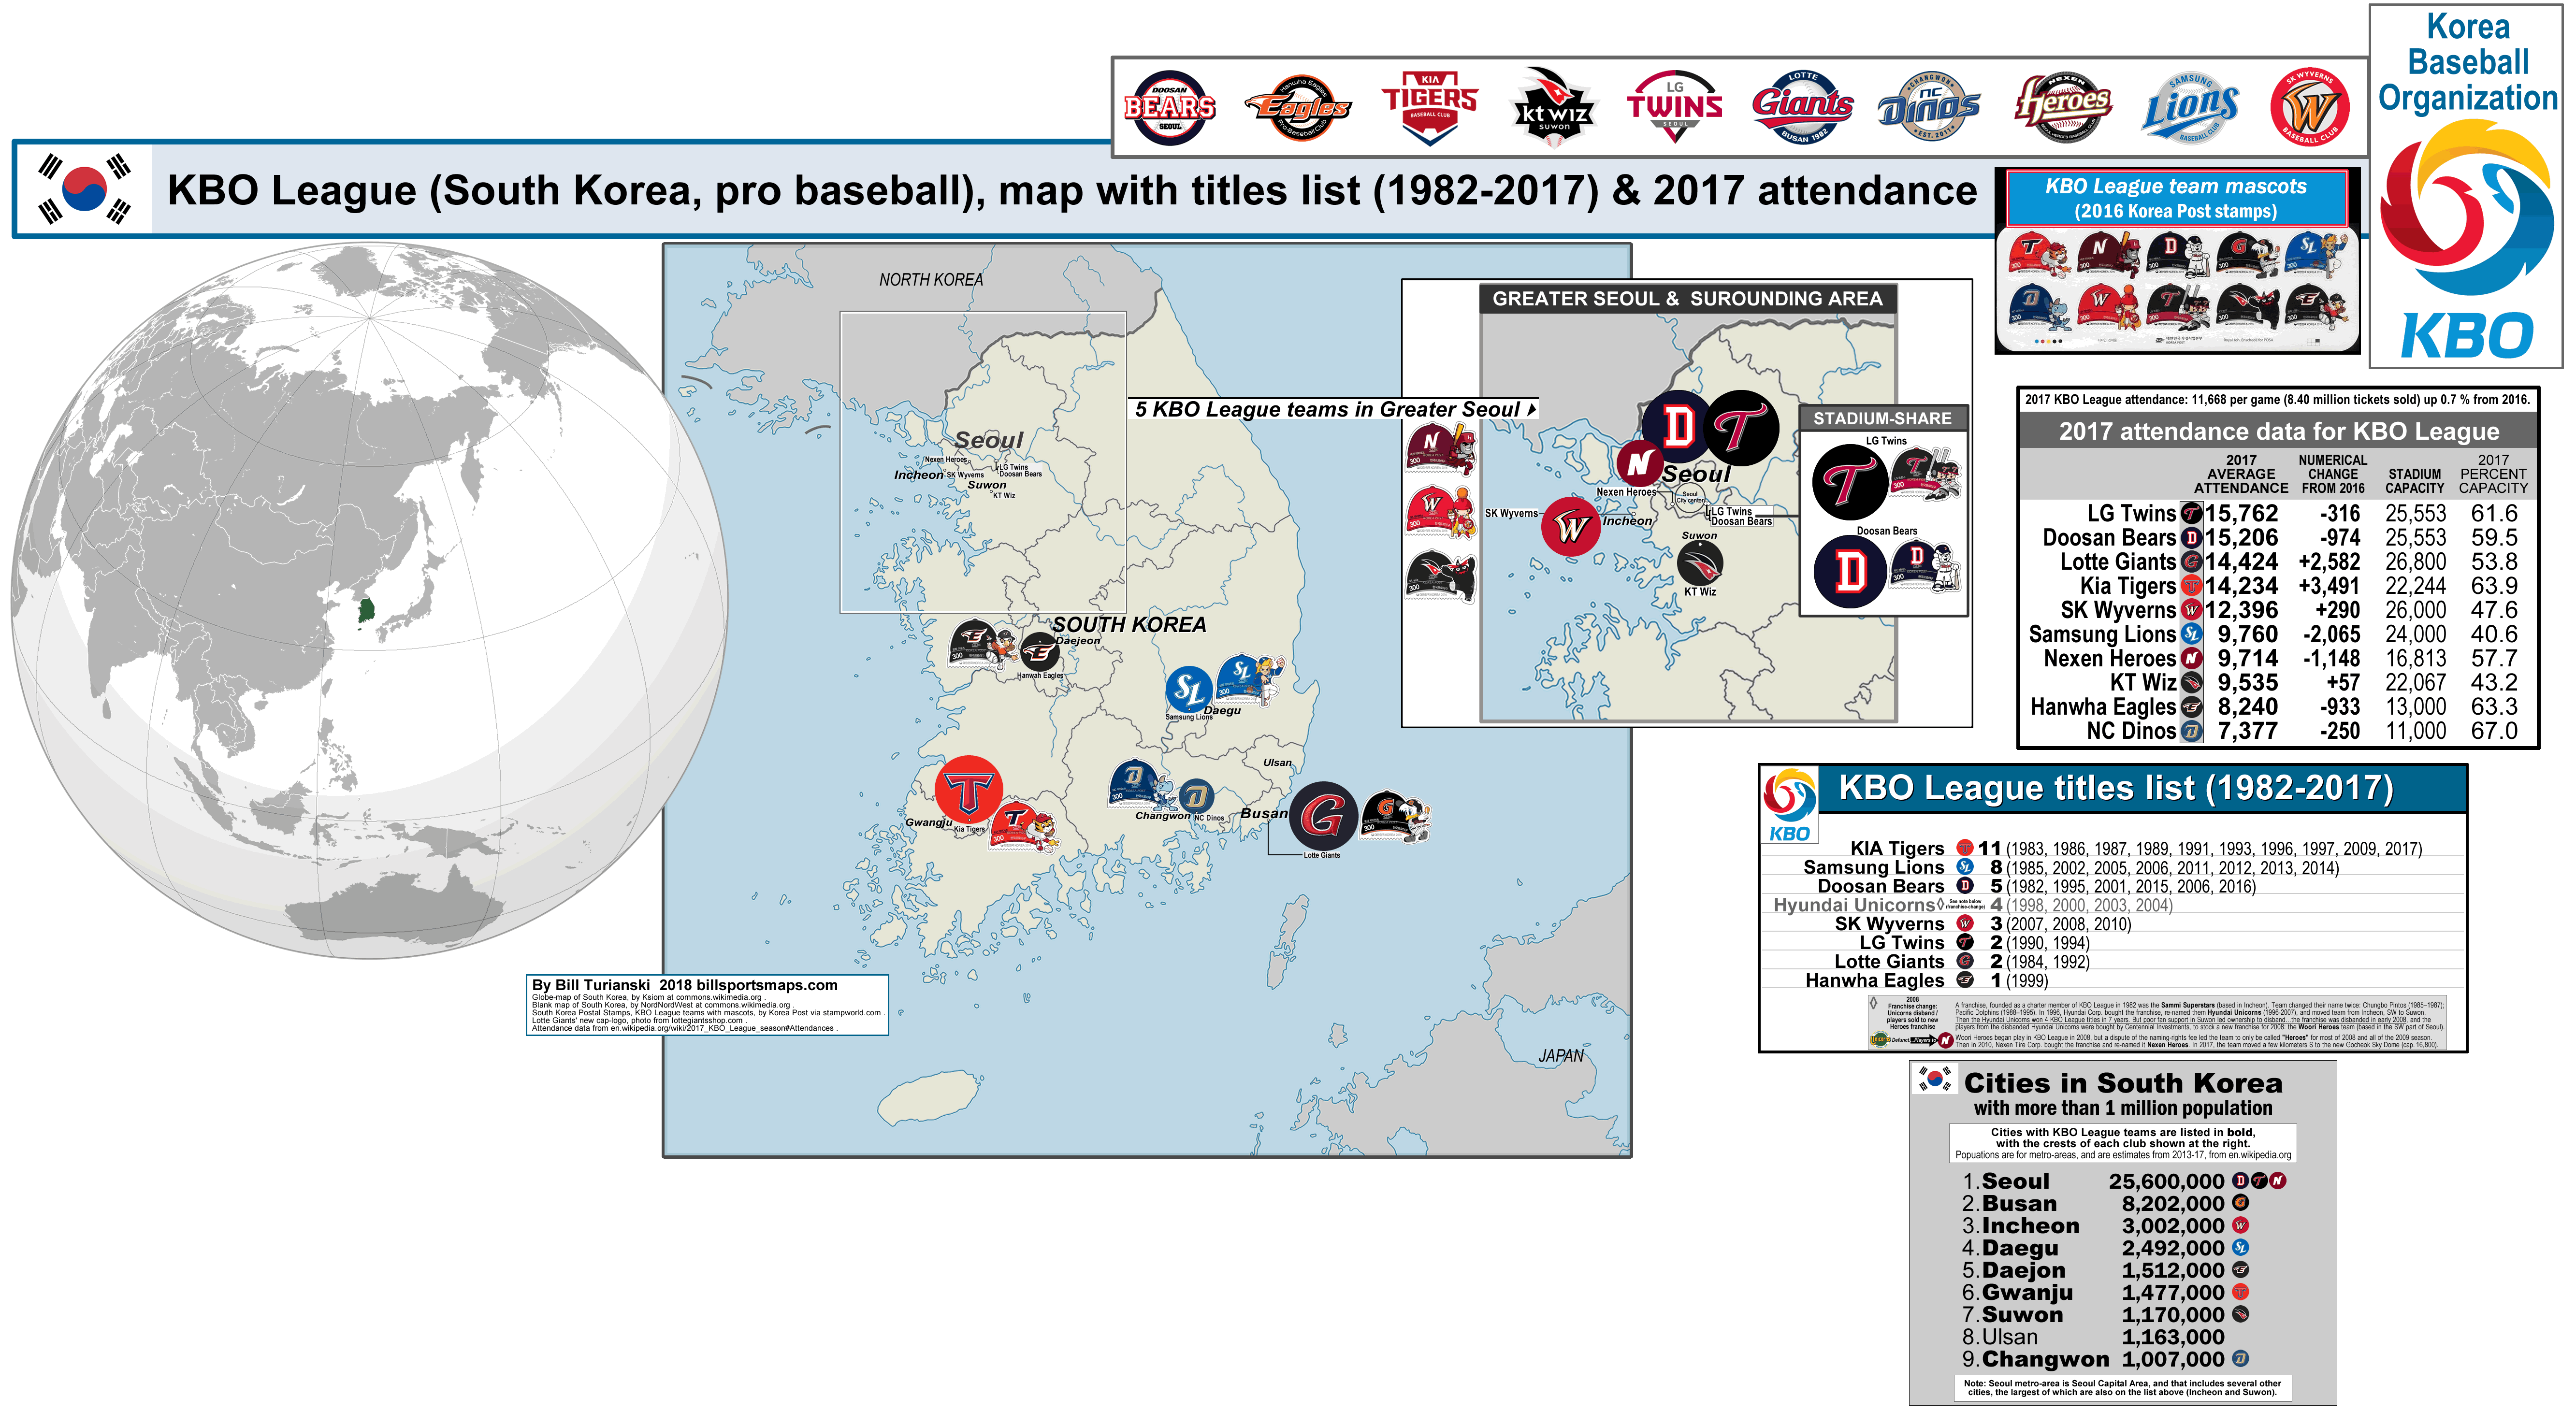
The map-page includes a COVID-19 Timeline for Korean Baseball. The text for the timeline is repeated two paragraphs below. The map-page features a location-map of the 10 KBO League teams, including an inset-map of Greater Seoul aka Seoul Capital Area (there are 5 KBO League teams in Seoul Capital Area, including 3 teams in Seoul city-proper (aka Seoul Special City). For each team, there is a Circular-cap-logo that is sized to reflect 2019 average attendance…the larger the circular-cap-logo, the higher the team’s attendance. 2016 Korea Post stamps are shown for each team. These stamps each feature the team’s mascot. Some of the stamps have been updated to show recently-changed new cap logos and color-changes (LG Twins, Lotte Giants, Kia Tigers, Kiwoom Heroes). There are also 3 charts: One chart shows the 9 largest cities in South Korea (all cities with more than one million in their Metropolitan Areas). Another chart shows 2019 attendance for the 10 KBO League teams. Attendance, overall was down for the second-straight season in the KBO League, and last year league-wide attendance fell an alarming 9.8% {see the section on 2019 KBO attendance, which is about halfway further down this post}. The third chart show the full Titles list for the KBO League (the KBO League’s first season was in 1982).
Finally, there is a section at the far right-hand side of the map-page which has Team Profile Boxes for the 10 KBO League teams. In the profile boxes there are shown or listed several things…Cap-logo. Primary logo. Season team was established. Venue-location(s) & City-location(s). [Note: 3 KBO League teams have a secondary venue, in a neighboring city, where they play a few home games each season (Lotte Giants, Samsung Lions, Hanwha Eagles). Those secondary locations are also shown on the map.] Team Owner with owner’s business, and company logo. Titles won by team, with last title listed, along with the number of times the team has finished as Runners-up. Primary mascot’s logo.
…
South Korea: 2020 KBO League: COVID-19 Timeline in Korean Baseball
December 2019: 2020 KBO League season schedule was released: 28th of March was scheduled for opening day.
10 March 2020: Due to the COVID-19 pandemic in South Korea, the Korea Baseball Organization (KBO) cancelled all exhibition games, and delayed the start of the 2020 KBO League season indefinitely.
19 April 2020: New COVID-19 cases, per day, in all of South Korea, dropped to single-digits.
21 April 2020: Preseason games begin for restart.
5 May 2020: 2020 KBO League begins. Full 144-game season is scheduled, but in a more compressed time-frame, meaning more doubleheaders, less off-days, and no All-Star break. The season is projected to end on the 2nd of November. Post-season to end no later than 25 November.
The stadiums will be empty except for players, staff, umpires and some media. Masks and latex gloves must be worn by base coaches and umpires on the field; teams’ training staff must wear masks in the dugouts. Players wear masks in the dugout, but not on the field. There can be small cheerleading squads. Spitting is not allowed.
Will there be fans in the stadiums? Yonhap news agency reported that the KBO has plans to gradually open the stadiums, depending on the progress of the pandemic.
Here are articles which helped me put together the timeline…
-2020 KBO League season (en.wikipedia.org).
-S. Korean baseball season pushed further back to late April (by Yonhap news agency at koreaherald.com/sports/baseball on 24 March 2020).
-Inside look at Korean baseball restart that offers hope for MLB (by Joel Sherman at nypost.com/[MLB] on 20 April 2020).
-S. Korean baseball regular season to begin May 5 (by Yonhap news agency at koreaherald.com/sports/baseball on 21 April 2020).
The link below is recommended…
-The Korean Baseball Organization is back from the coronavirus shutdown… (by Ryan Divish at seattletimes.com/sports on 8 May 2020).
…
Demographics of South Korea…
The population of South Korea is around 51.7 million {source: 2019 estimate, here at South Korea en.wikipedia page}. This puts South Korea as the 27th-most-populous nation on Earth. South Korea is very small, though: it is the 109th-largest country (at 100,210 km-sq or 66,690 mi-sq). That makes South Korea slightly smaller than Iceland, and slightly larger than Hungary. The largest city in South Korea (by far) is, of course, Seoul…which is absolutely gigantic, and has a metro-area population that is fifth-largest on the planet. Seoul has a special-city population of around 10.1 million, and metro-area population of around 25.5 million ! Only Tokyo, Japan (at ~37.2 million), Shanghai, Jakarta, and Delhi have larger metro-area populations than does Seoul. {Source.} Basically, half of the population of South Korea resides in Seoul’s metropolitan area. South Korea has about the 29th-highest adjusted-GDP in the world [International Monetary Fund (2020 estimates] {see this, List of countries by GDP (PPP) per capita).
KBO League est. 1982; 10 teams. Season: 144 games/5-team playoffs w/reg-season-winner getting bye to the 5-game Korean Series…
Pro major-league baseball in South Korea began in 1982, with the institution of the KBO League as a 6-team league. A minor league was established eight years later in 1990 – the KBO Futures League. In 1986, the KBO League expanded to include a seventh team.
In the first decade of its existence, the KBO League as a whole was only drawing in the 5 to 7 K range. By 1991, the KBO League had 8 teams. In 1995, cumulative attendance for the season finally topped 10 K per game, boosted by the exciting 1995 KBO season which saw three teams, the OB Bears, the LG Twins, and the Lotte Giants, go neck-to-neck for the pennant (the title in ’95 was won by the OB, now Doosan, Bears).
However, this league attendance figure wasn’t surpassed for 14 years. After 1995, the KBO began to see dwindling fan interest that lasted for about a decade. What first helped reverse the gradual slide in attendances from 1996 to 2004 was the good showing that the South Korean national baseball team had in the first World Baseball Classic, in 2005, when they finished in third. Another boost to the game there came three years later, when South Korea narrowly lost to Japan in extra innings in the second World Baseball Classic, and then six months later, the South Korean baseball team won the gold medal in the 2008 Summer Olympics in Beijing.
These results convinced many South Korean sports fans that KBO baseball was a product worth supporting. In 2008, league-wide attendance shot up 2.3 K per game to 10.4 K; the next year [2009] it was 11.1 K, and the KBO League began drawning above 11 K (up to 2018). The health of Korean pro baseball was seen in the fact that there was recent expansion. The KBO League finally got to 10 teams, first with the creation of a 9th team (the NC Dinos) in 2013, and a 10th team (the KT Wiz) in 2015.
But after reaching peak attendance in 2017, the KBO League has seen two straight years of attendance decline, including a 9.8% drop in overall attendance in 2019. The KBO League had peak attendance in 2017 at 8.40 million tickets sold, which was 11,668 per game {2017 KBO League attendance}. 2018 saw a 4% decline in attendance, at 8.07 million ticket sold and an average of 11,214 per game {2018 KBO League attendance}. Then 2019 saw a more drastic decline in attendance, at just 7.28 million tickets sold and an average of 10,119 per game {2019 KBO League attendance}.
The explanation for the alarming drop in attendance in 2019 at KBO League games is twofold...
1) A number of the bigger teams had bad seasons in 2019. Like the Lotte Giants, who finished dead last, and dropped over 3,000-per-game in attendance. Also in that category were the Kia Tigers and the Hanwha Eagles, both of whom had below-.440 -percentage seasons in 2019, and both of whom saw a drop-off of around 2,400-per-game in attendance. But then there was of situation of the SK Wyverns, who had a very good season for the second straight year (finishing in 2nd place in both 2018 and 2019), but who nevertheless saw a drop-off of around 750 per game (to a still-respectable 13.6 per game). Why?…see below.
2) The KBO League changed the specifications of their official baseballs to 1 mm wider and 1 gram heavier. And that has appeared to lower offensive numbers in 2019. In other words, the KBO messed with their baseball, and it backfired. {See this tweet from February 2019, by a writer at FanGraphs.com who is also an employee of the Lotte Giants: ‘The KBO is implementing new baseball. It is 1 mm bigger and 1 g heavier, hoping that it could help neutralize the high-offense environment that the league is known for. According to a simulation ran by the SK Wyverns, the ball resulted in 20% less home runs than the previous one’, tweet from twitter.com/[Sung Min kim].} {Also see this article, The KBO Appears to Be De-Juicing its Baseballs (by Sun Min Kim at fangraphs.com on 23 April 2019).} The theory is that the drop in offense (particularly the drop in Home Runs) drove fans away in 2019. {See this, Pitching regains foothold as home runs, attendance drop in S. Korean baseball (by Yoo Jee-Ho at en.yna.co.kr on 2 October 2019).}
Only one team had a substantial increase in attendance in 2019 in the KBO League, and that was the relatively new team the NC Dinos (est. 2013). The NC Dinos went from last-place in 2018, to a wild-card berth in 2019, winning 25 more games in the process, and seeing a 3,700-per-game increase in their crowds, to a more respectable 9.8-K-per-game attendance. That is still below the general league average (in a good season), but NC Dinos’ attendance figures were certainly better than the other new team, the KT Wiz (est. 2015), whose average attendance has dropped 2.1-K-per-game in two years.
As of the 27th of May 2020 (19 or 20 games played), the NC Dinos currently lead the 2020 KBO League, by 3 games over the LG Twins and 4 games over the reigning champions the Doosan Bears. {KBO League standings.}
…
- Doosan Bears, 2019 Korean Series champions (the Bears’ 3rd title in 5 years)
두산 베어스, 2019 한국 시리즈 챔피언 (5 년 만에 베어스 3 위)
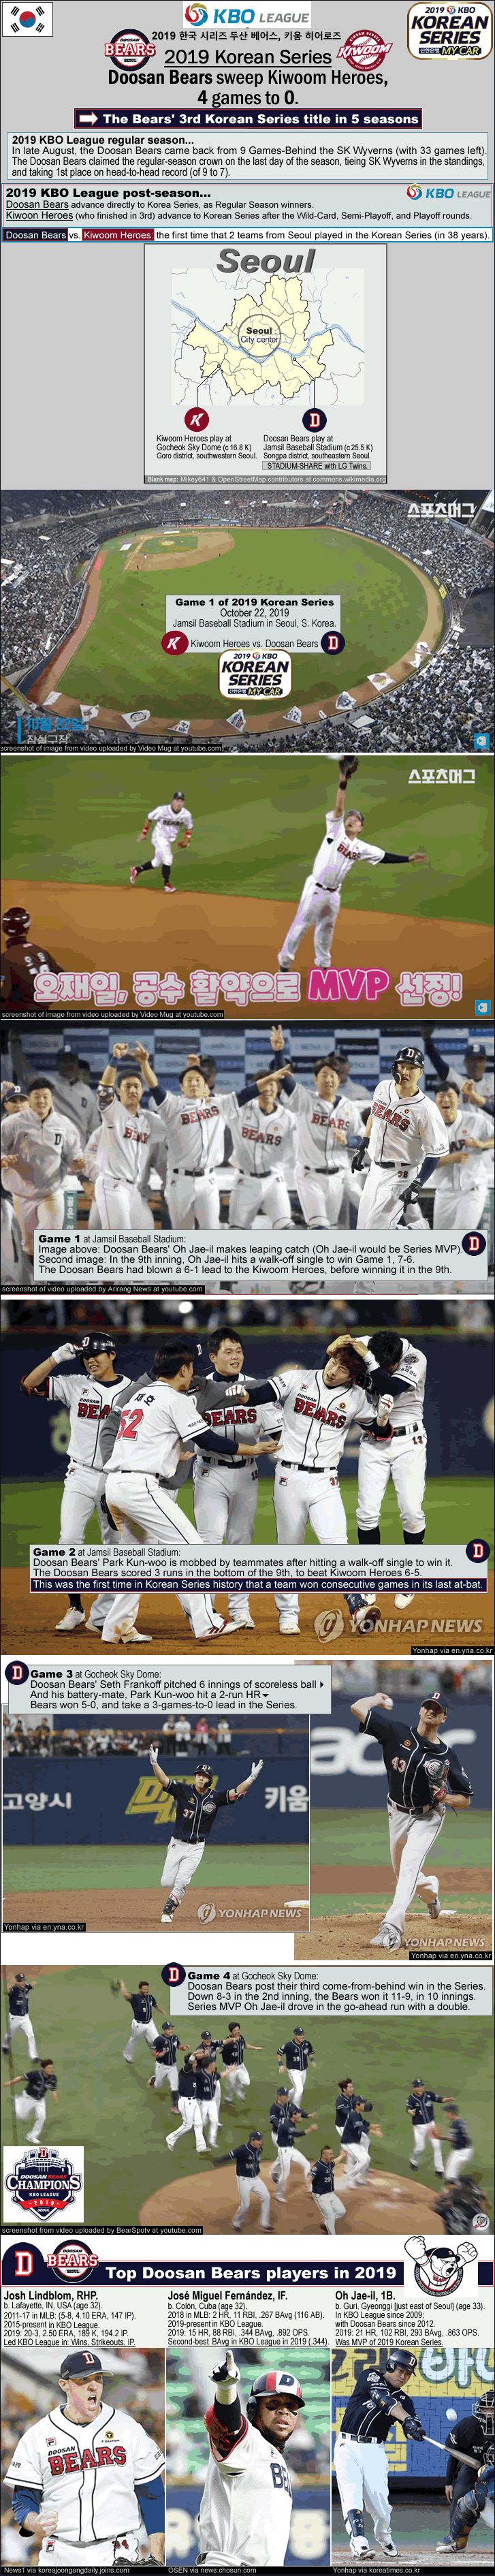
Photo and Image credits above – Blank map of Seoul, by Mikey641 & OpenStreetMap contributors at File:Seoul South Korea location map.svg (commons.wikimedia.org). Overhead view of crowd and field at Jamsil Baseball Stadium right before start of the 2019 Korean Series, screenshot of image from video uploaded by Video Mug at youtube.com. Oh Jae-il makes leaping catch, screenshot of image from video uploaded by Video Mug at youtube.com. Oh Jae-il hits walk-off single in 9th to win Game 1 for Doosan Bears, screenshot of video uploaded by Arirang News at youtube.com. Park Kun-woo is congratulated by teammates after his walk-off single in the bottom of the 9th in Game 2, photo by Yonhap via en.yna.co.kr. Game 3 standots: Park Kun-wa and Seth Frankel, photo by Yonhap via en.yna.co.kr. Doosan Bears players rush the field to celebrate their title, screenshot from video uploaded by BearSpotv베어스포티비 at youtube.com.
Josh Lindblom, photo by News1 via koreajoongangdaily.joins.com. Jose Miguel Fernandez, photo by OSEN via news.chosun.com. Oh Jae-il, photo by Yonhap via koreatimes.co.kr.
___
Thanks to all at the following links…
-Globe-map of South Korea, by Ksiom at File:South Korea (orthographic projection).svg (commons.wikimedia.org).
-Blank map of South Korea, by NordNordWest at :FileSouth Korea location map.svg (commons.wikimedia.org).
-Attendance…koreabaseball.com/Record/Crowd/History (koreabaseball.com).
-Lotte Giants’ official shop, lottegiantsshop.com/[new 2018 cap], thanks for photo of the brand-new Lotte Giants’ deep-navy-blue-and-wine-red ball cap logo.
-KBO teams’ K-stamps (2016) [KBO-team-cap-with-mascot], by Shin Jaeyong/Korea Post stampworld.com/stamps/South-Korea/Postage-stamps/g3144/.


![exhibits.baseballhalloffame.org/dressed_to_the_nines/[1925-PIT]](http://exhibits.baseballhalloffame.org/dressed_to_the_nines/detail_page.asp?fileName=nl_1925_pittsburgh.gif&Entryid=405)
.svg)