billsportsmaps.com

September 20, 2007

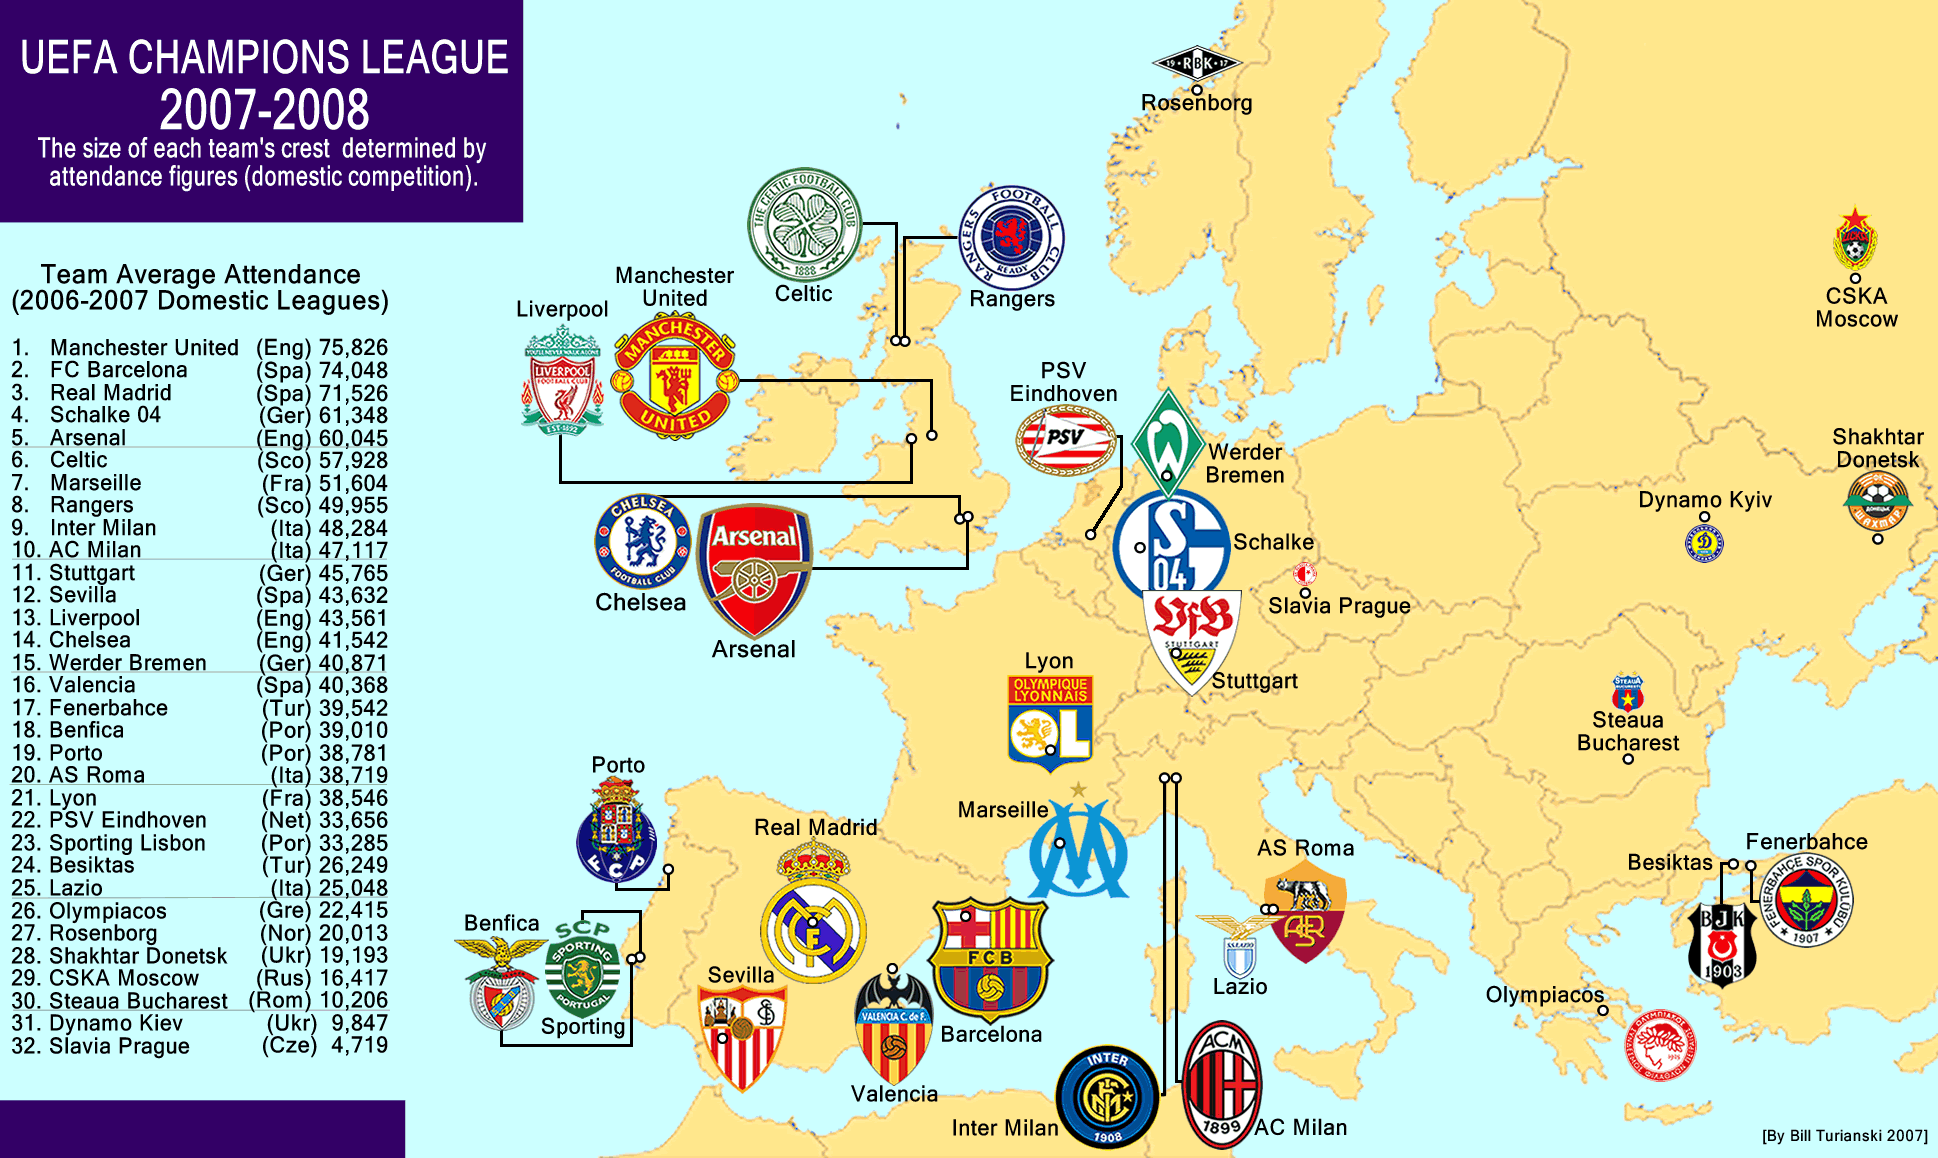
UEFA Champions League Map, 2007-08.

Filed under: UEFA Champions League — admin @ 4:19 pm

uefa_clsegment10.gif


Google


This map is an attendance map, using gate figures from each club’s domestic league.  Most of the clubs from the old Iron Curtain have paltry attendances, compared to the western European clubs.  Shakhtar Donetsk is drawing well, though.  It may be surprising to some that the two Turkish clubs draw so well: Fenerbahce drawing almost 40,000 per game, and Besiktas at 26,000. Finally, it’s amazing to consider that a club drawing less than 5,000 could make this level of competition, but that’s what Slavia Prague did.  I don’t think this is what new UEFA chief Michel Platini had in mind, though, when he said he wants to see more clubs from the lower rated leagues qualify.  I hope not.

September 19, 2007

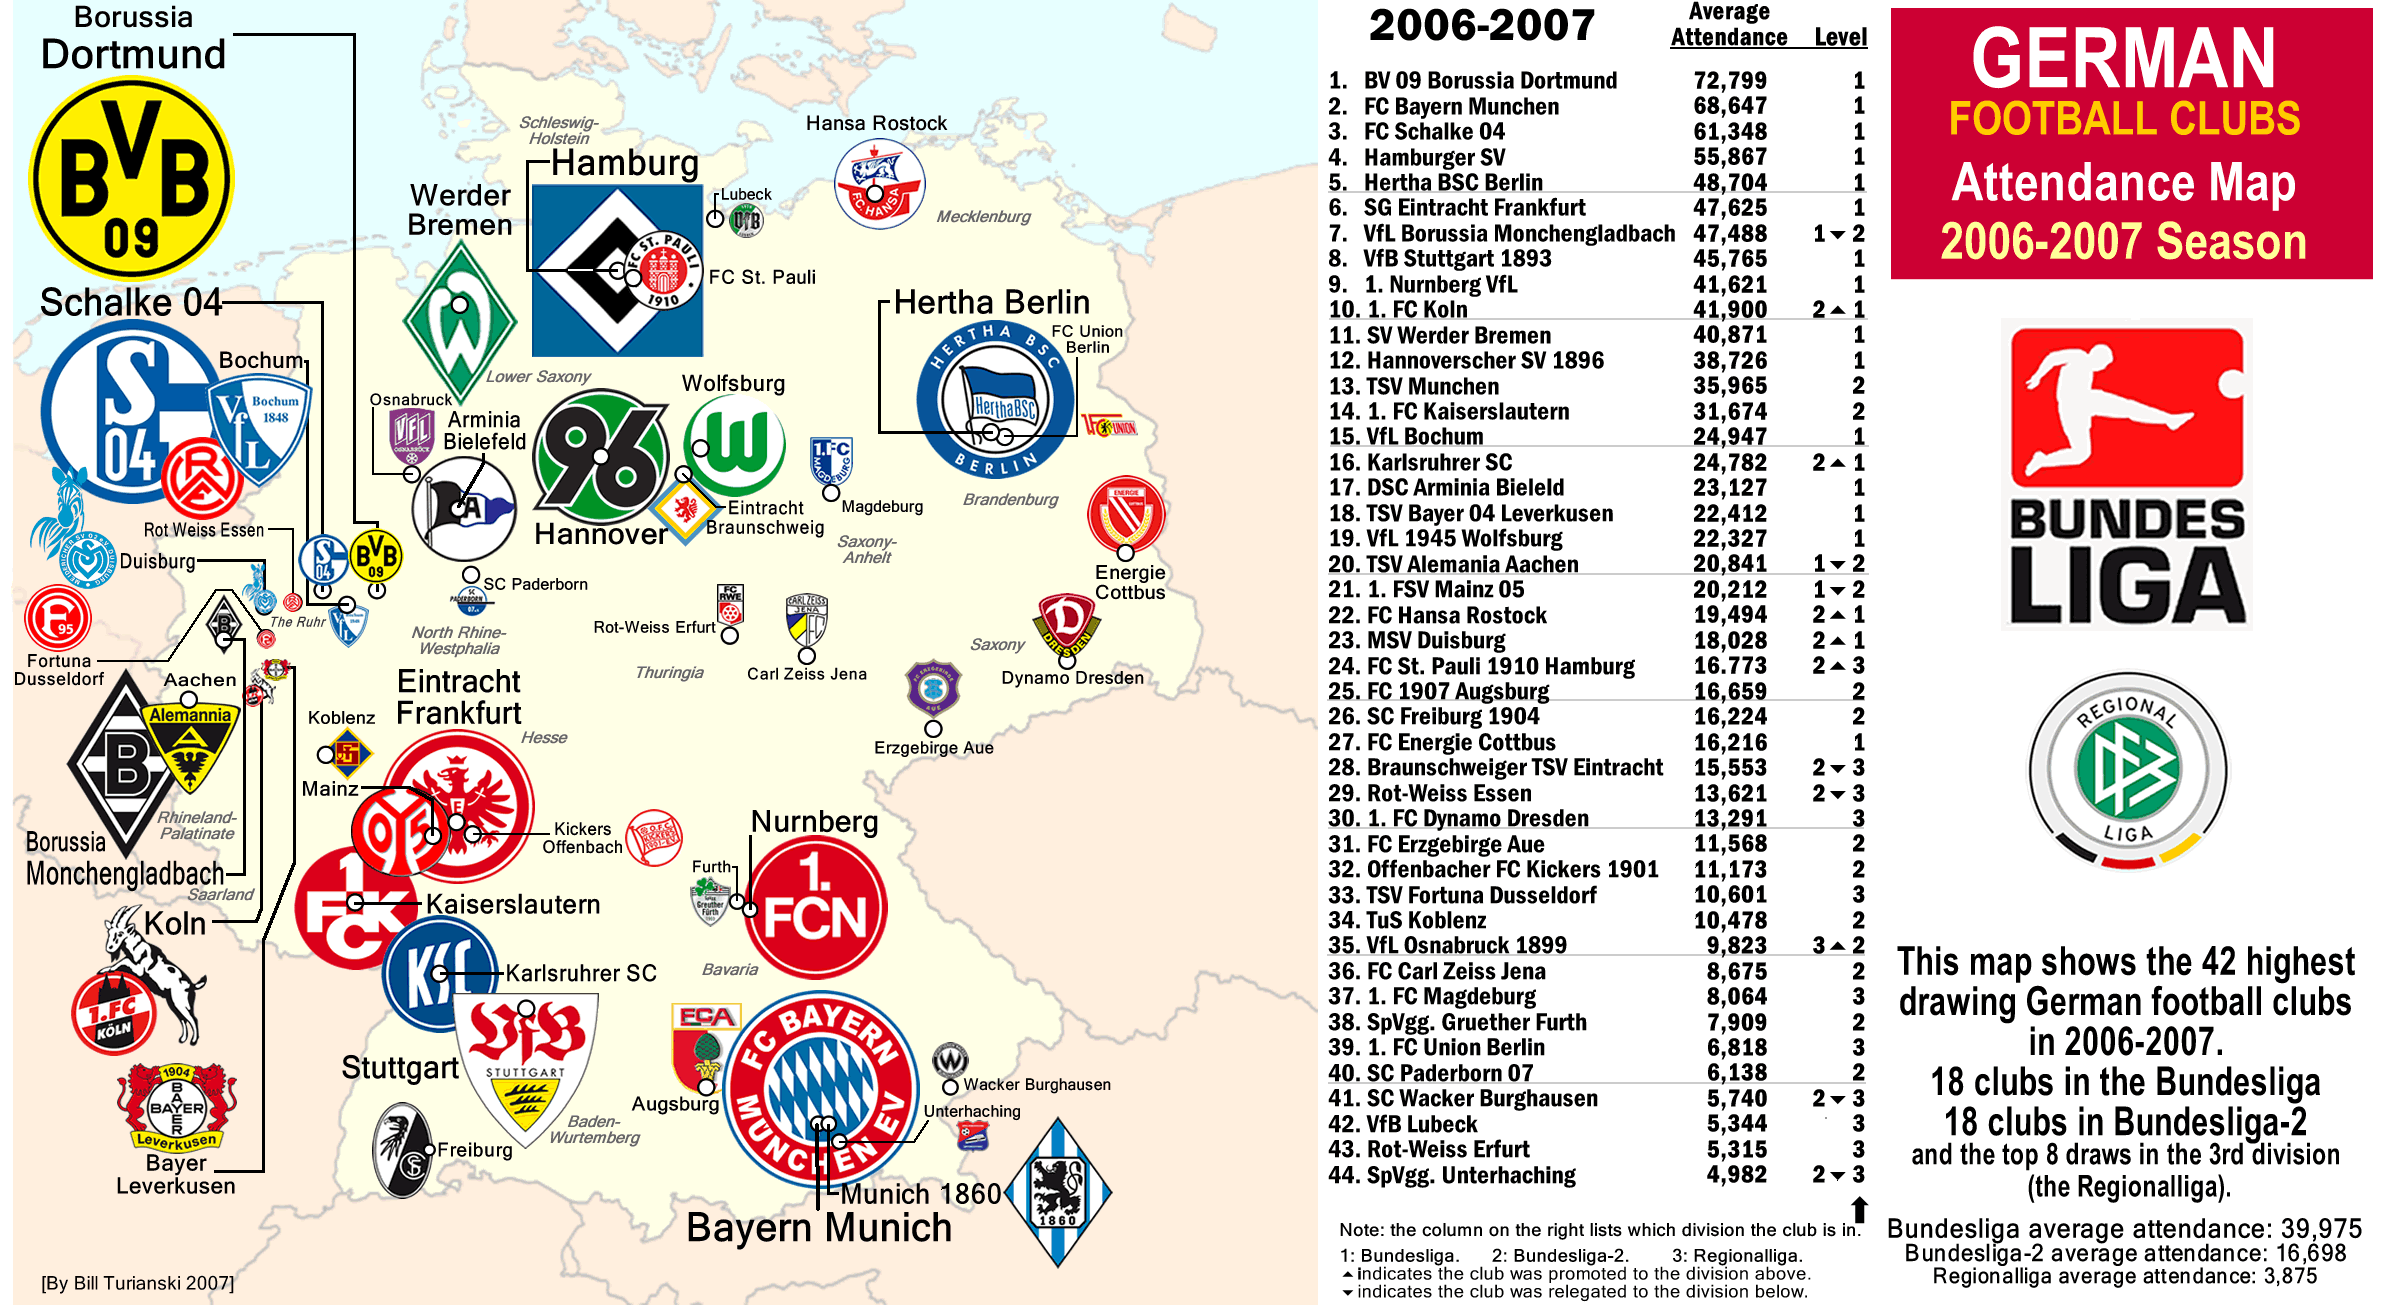
German Football-Bundesliga, Attendance map, 2006-07.

Filed under: Germany — admin @ 7:30 am

bund_segment3.gif


Note: to see my latest post on German football, click on the following, category: Germany.

German fans have it good.  The Bundesliga is full of gleaming sports palaces, and ticket prices are reasonable.  Last year’s World Cup brought a lot of stadium improvements.  Ticket prices are low because the clubs really are clubs, and the aim is recreational enjoyment for its members more than it is for profit.  Another nice thing is how close to the action the fans are.  In stadiums like Schalke’s Veltins Arena, Dortmund’s Westfalenstadion, and Munich’s new Allianz Arena, the stands are extremely close, and at a high angle.  It must be great for spectators.  It sure looks great on TV, as opposed to say, the Italian league, where it seems to be mandatory to have an ugly track oval separating the fans from the action.  I’m sorry, but is track and field that popular ?  I mean Manchester City made sure that track oval was gone once the Commonwealth Games were over. 

September 17, 2007

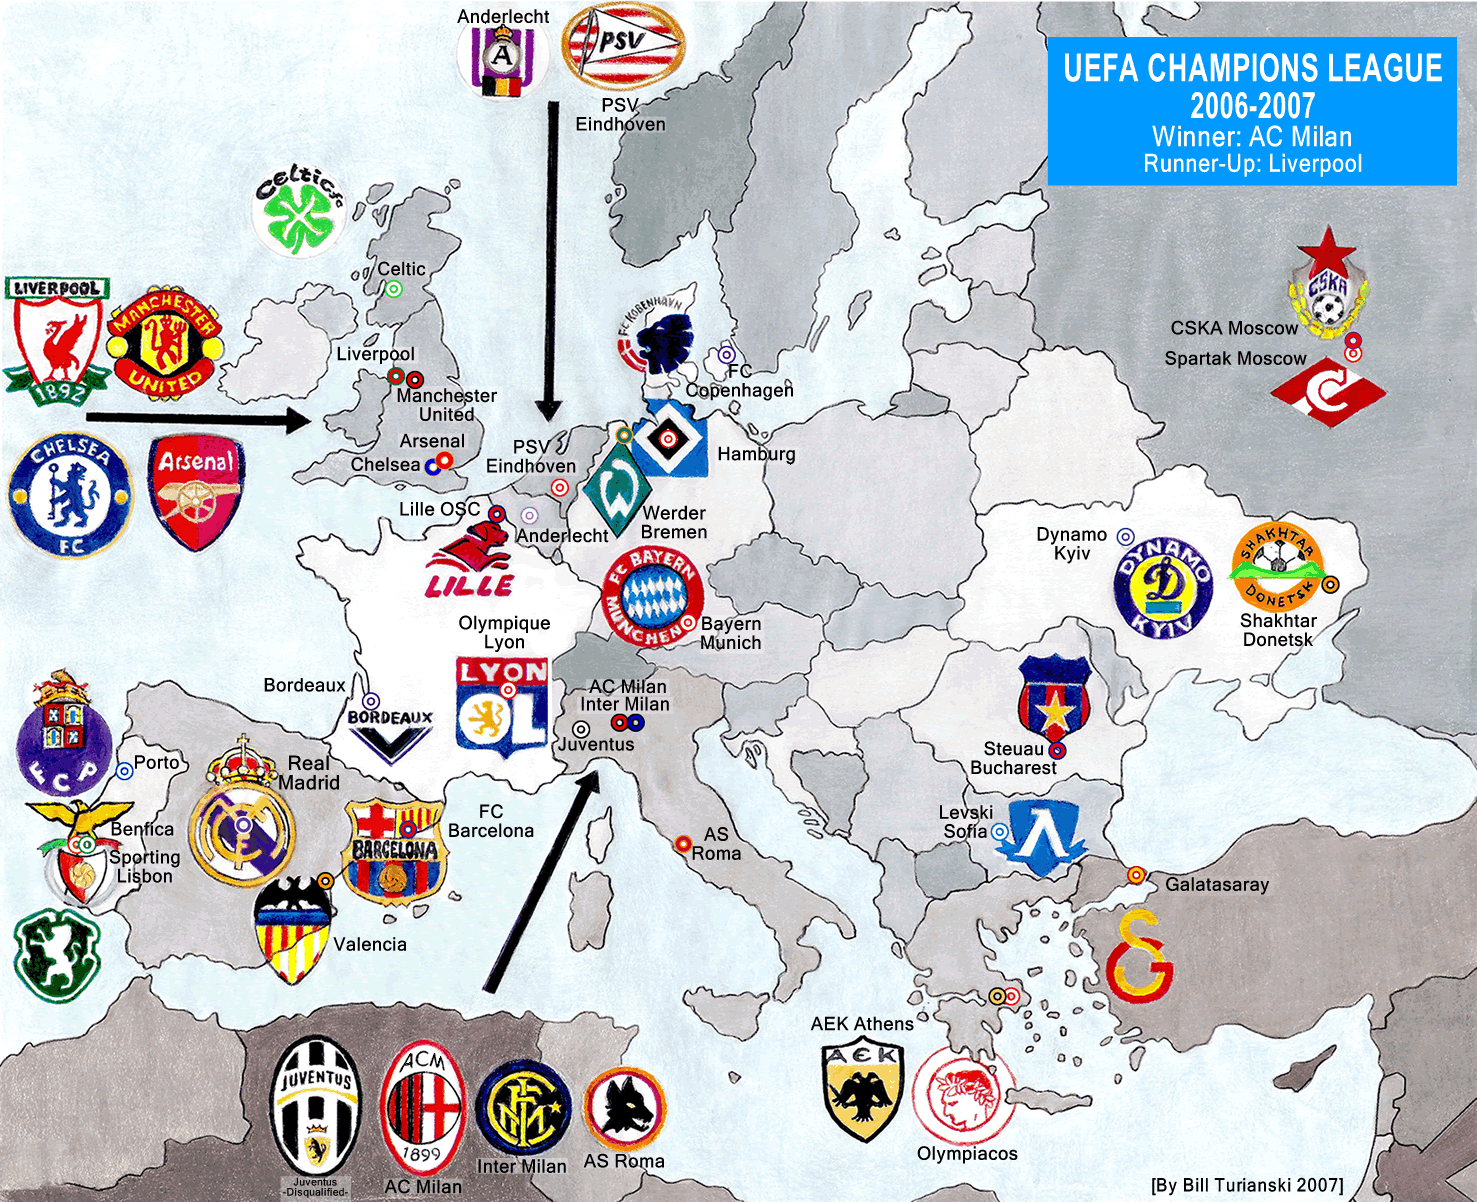
Champions League, 2006-2007 Map.

Filed under: Hand Drawn Maps,UEFA Champions League — admin @ 11:42 pm

cleague_segment.gif

September 16, 2007

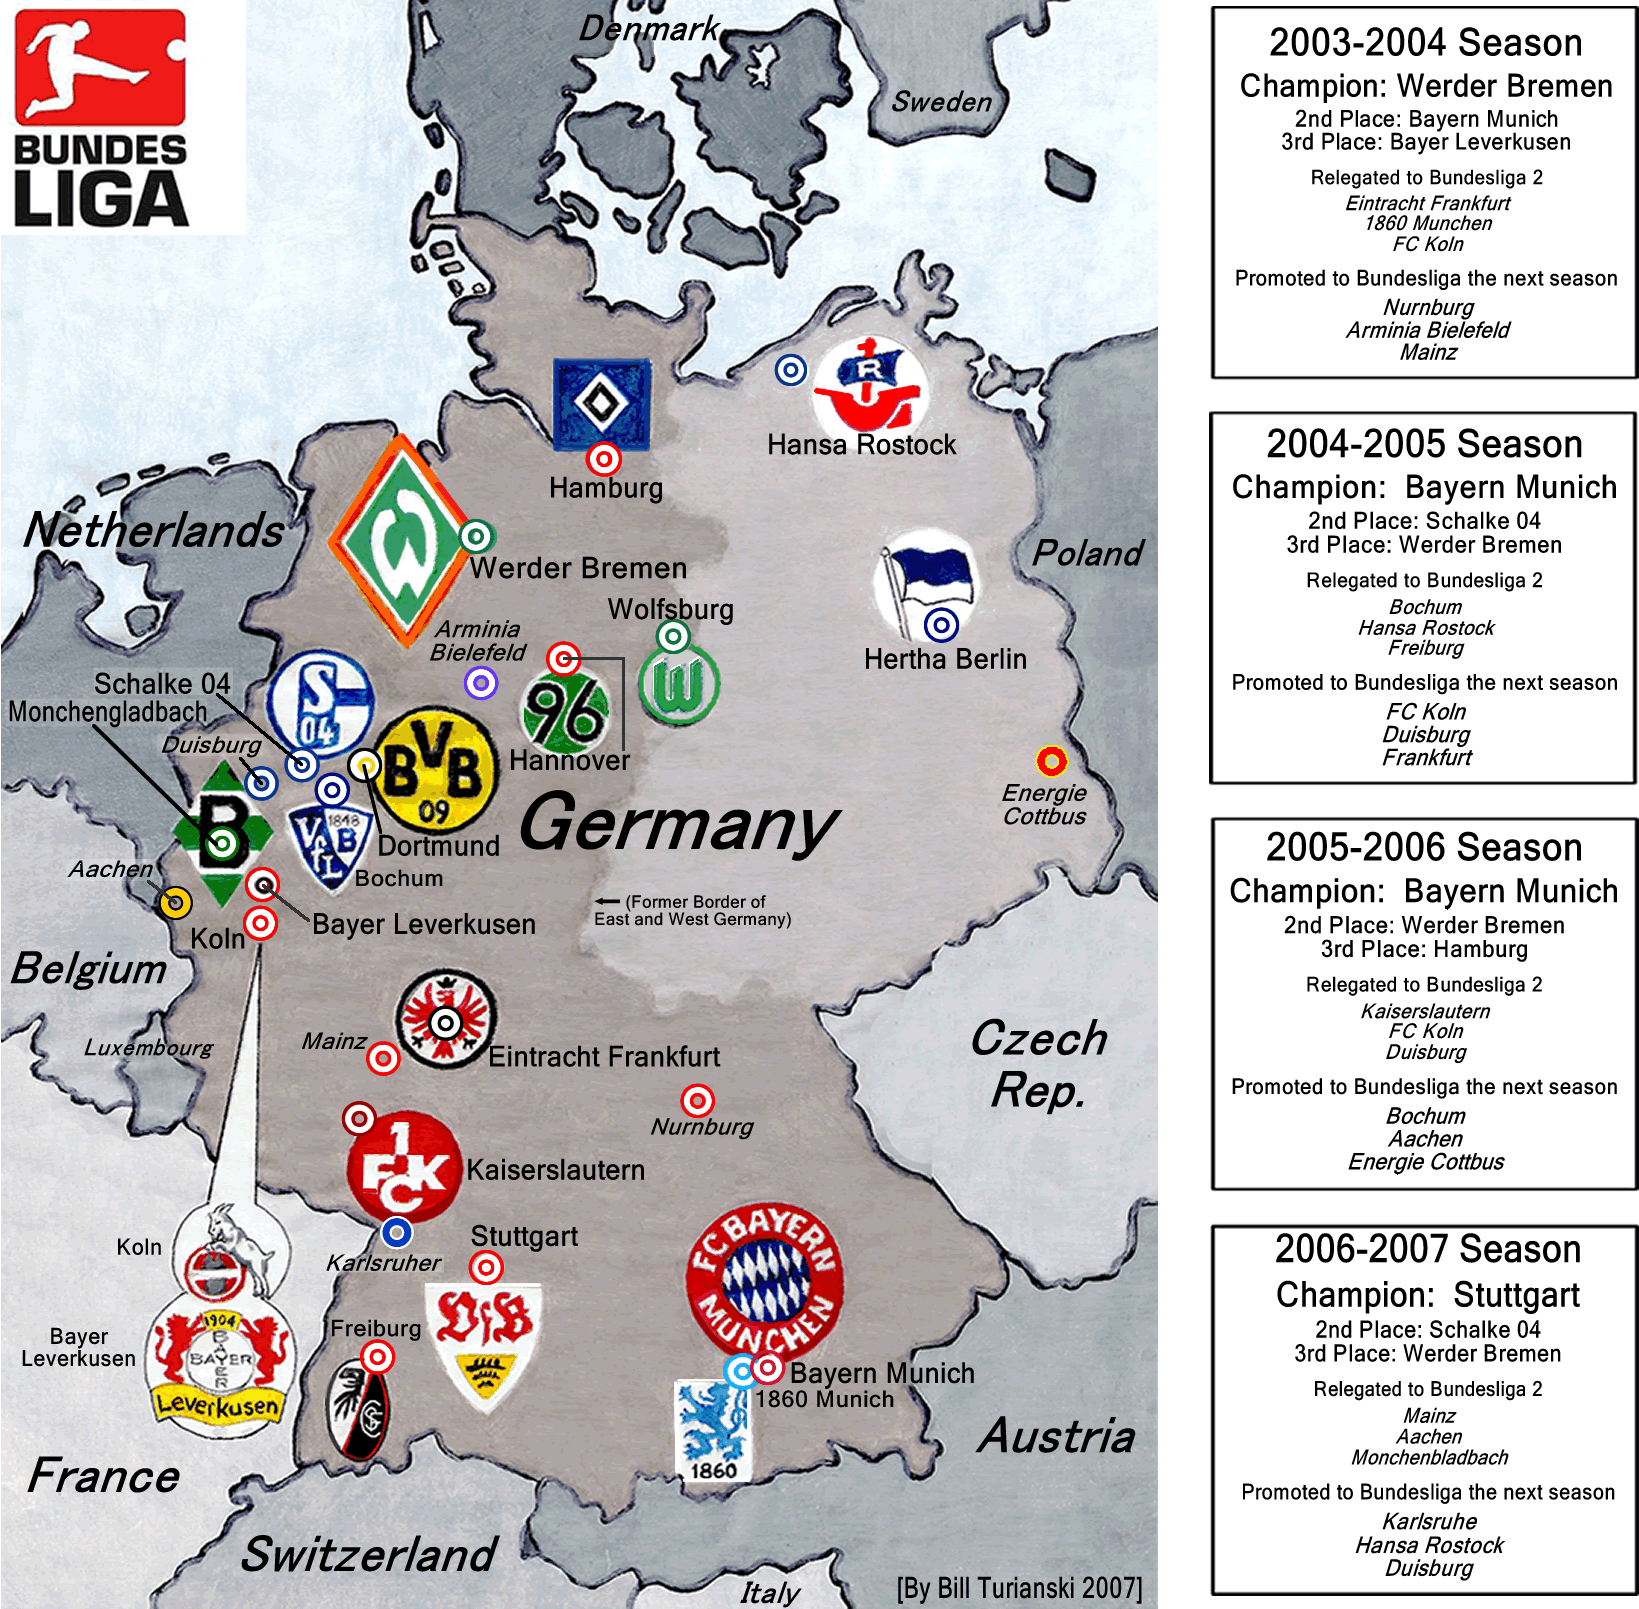
German Football-Bundesliga Map, 2003-2007.

Filed under: Germany,Hand Drawn Maps — admin @ 12:13 pm

german_segment2.gif


Please note:
My latest Bundesliga map-&-post can be found here, category: Germany.]

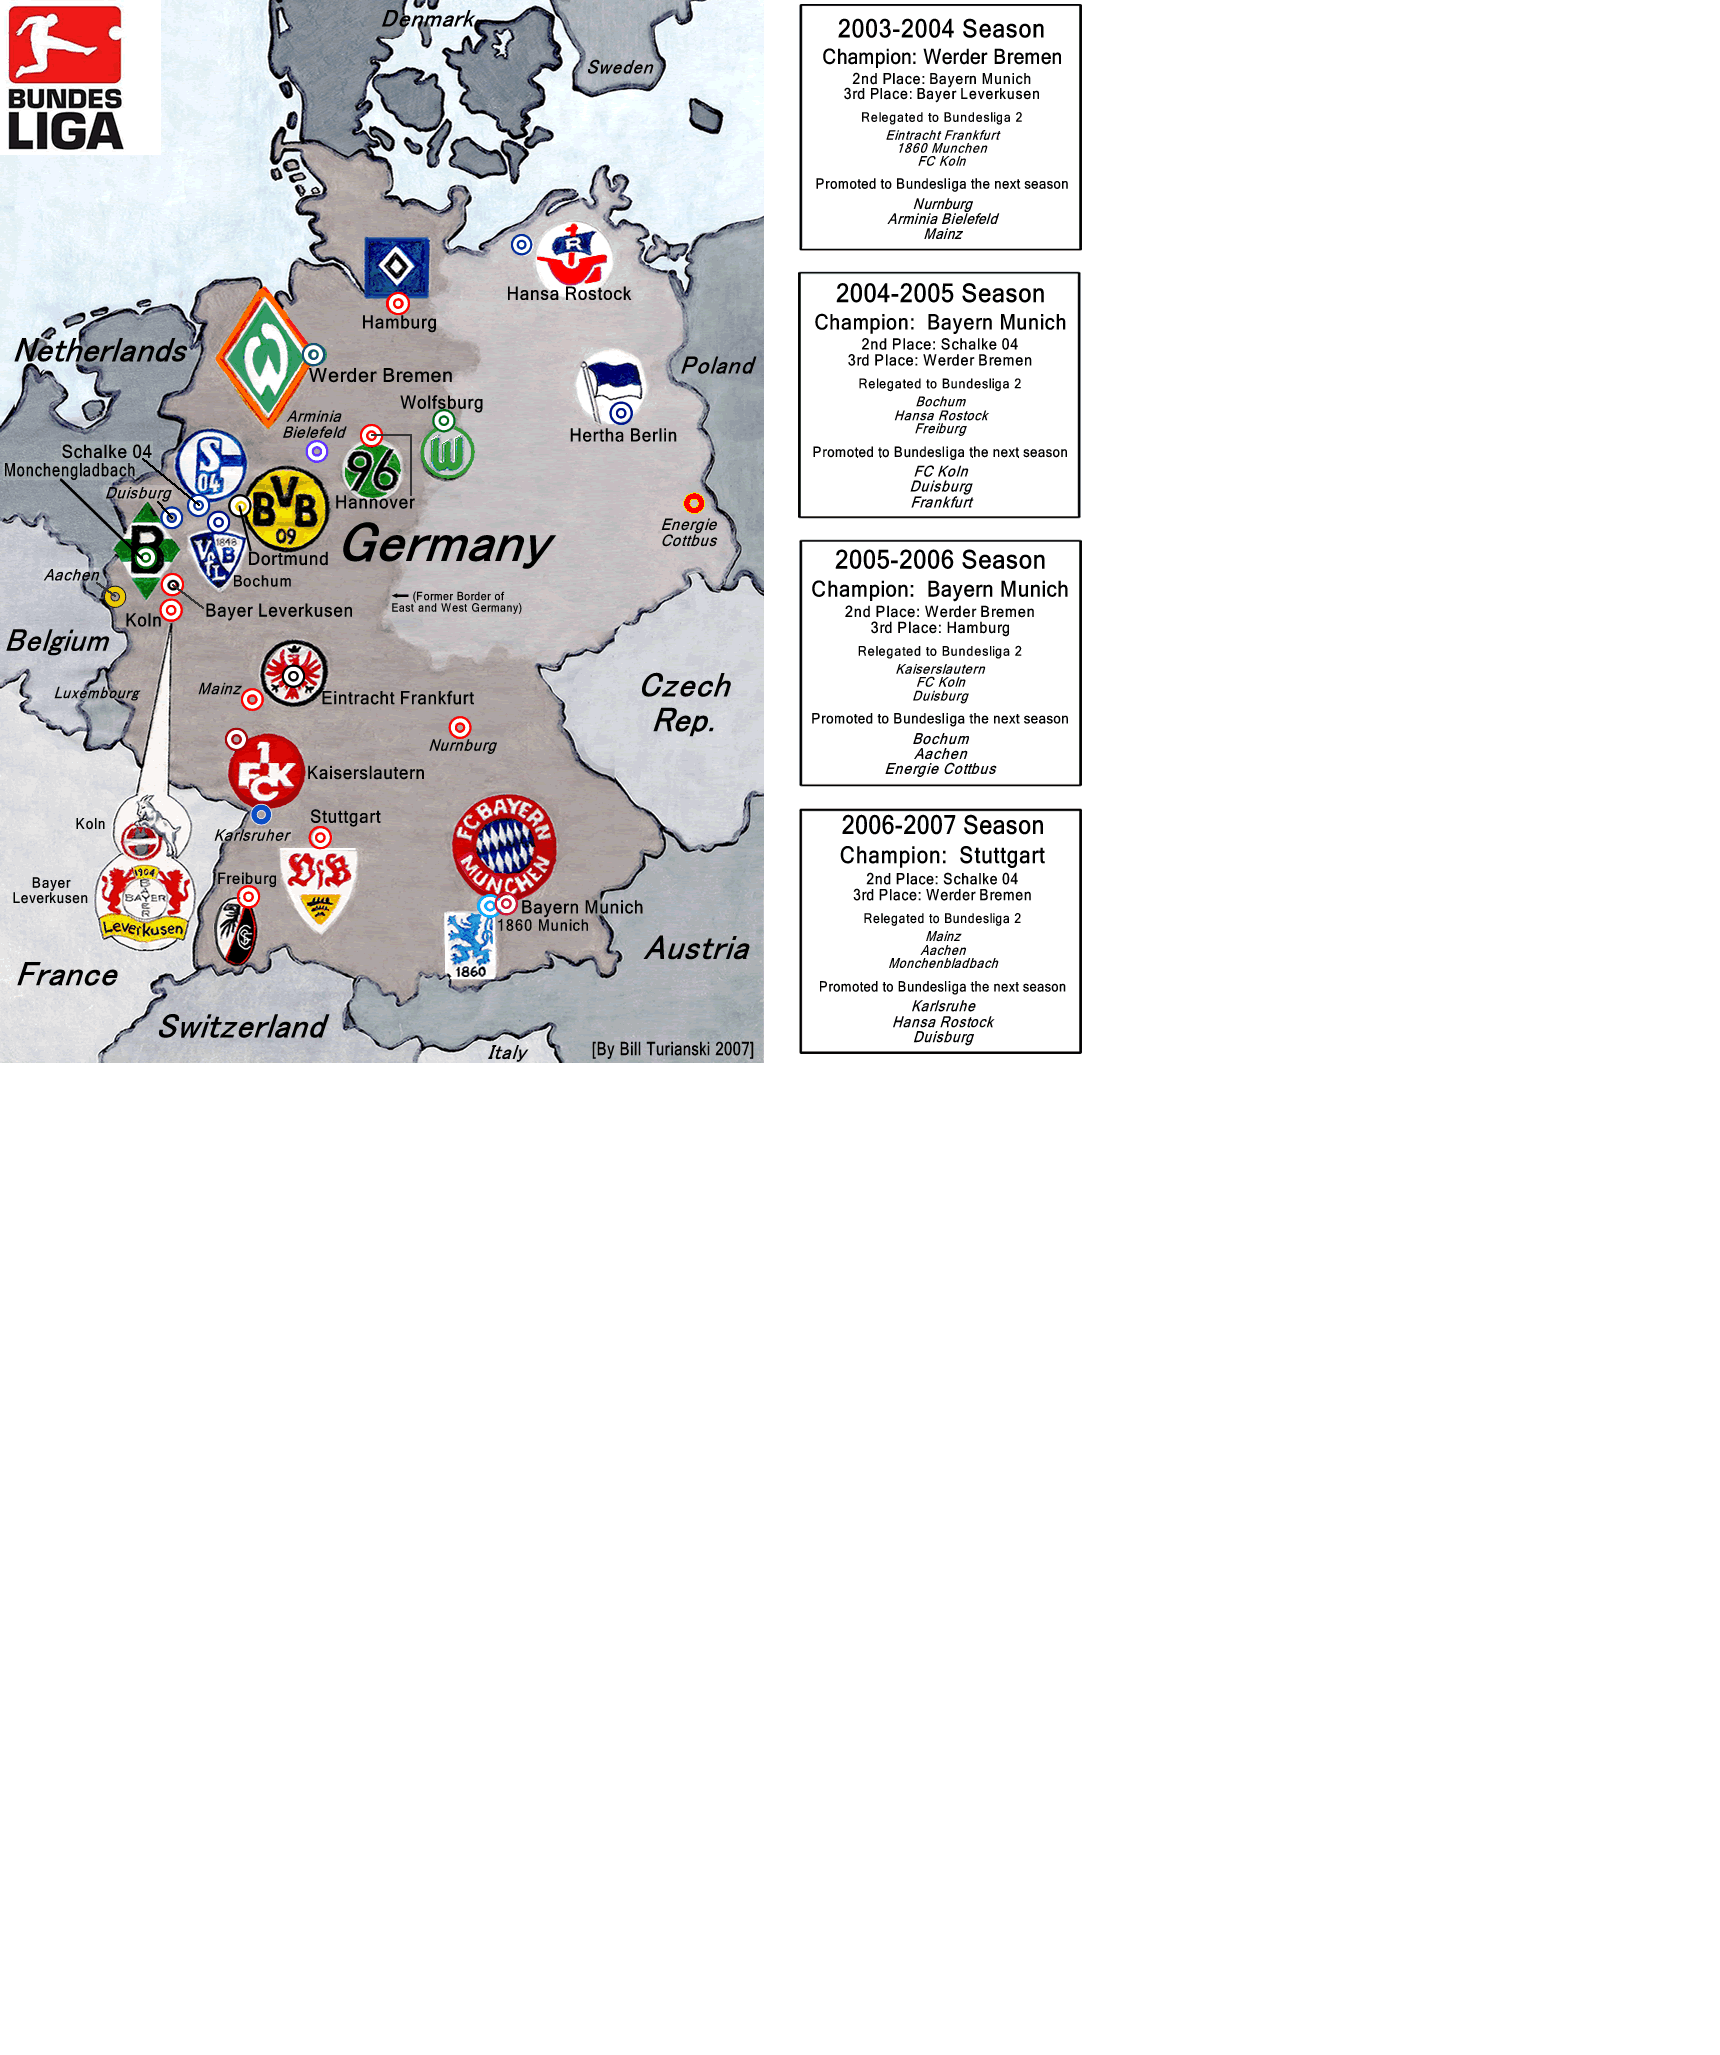
I hand-drew this map in early 2004. I have updated it to spring 2007 by adding all the teams who have been promoted, from Bundesliga 2, since then. Thumbnail lists of the last four Bundesliga seasons (2003-04, 2004-05, 2005-06, 2006-07) are included.

September 15, 2007

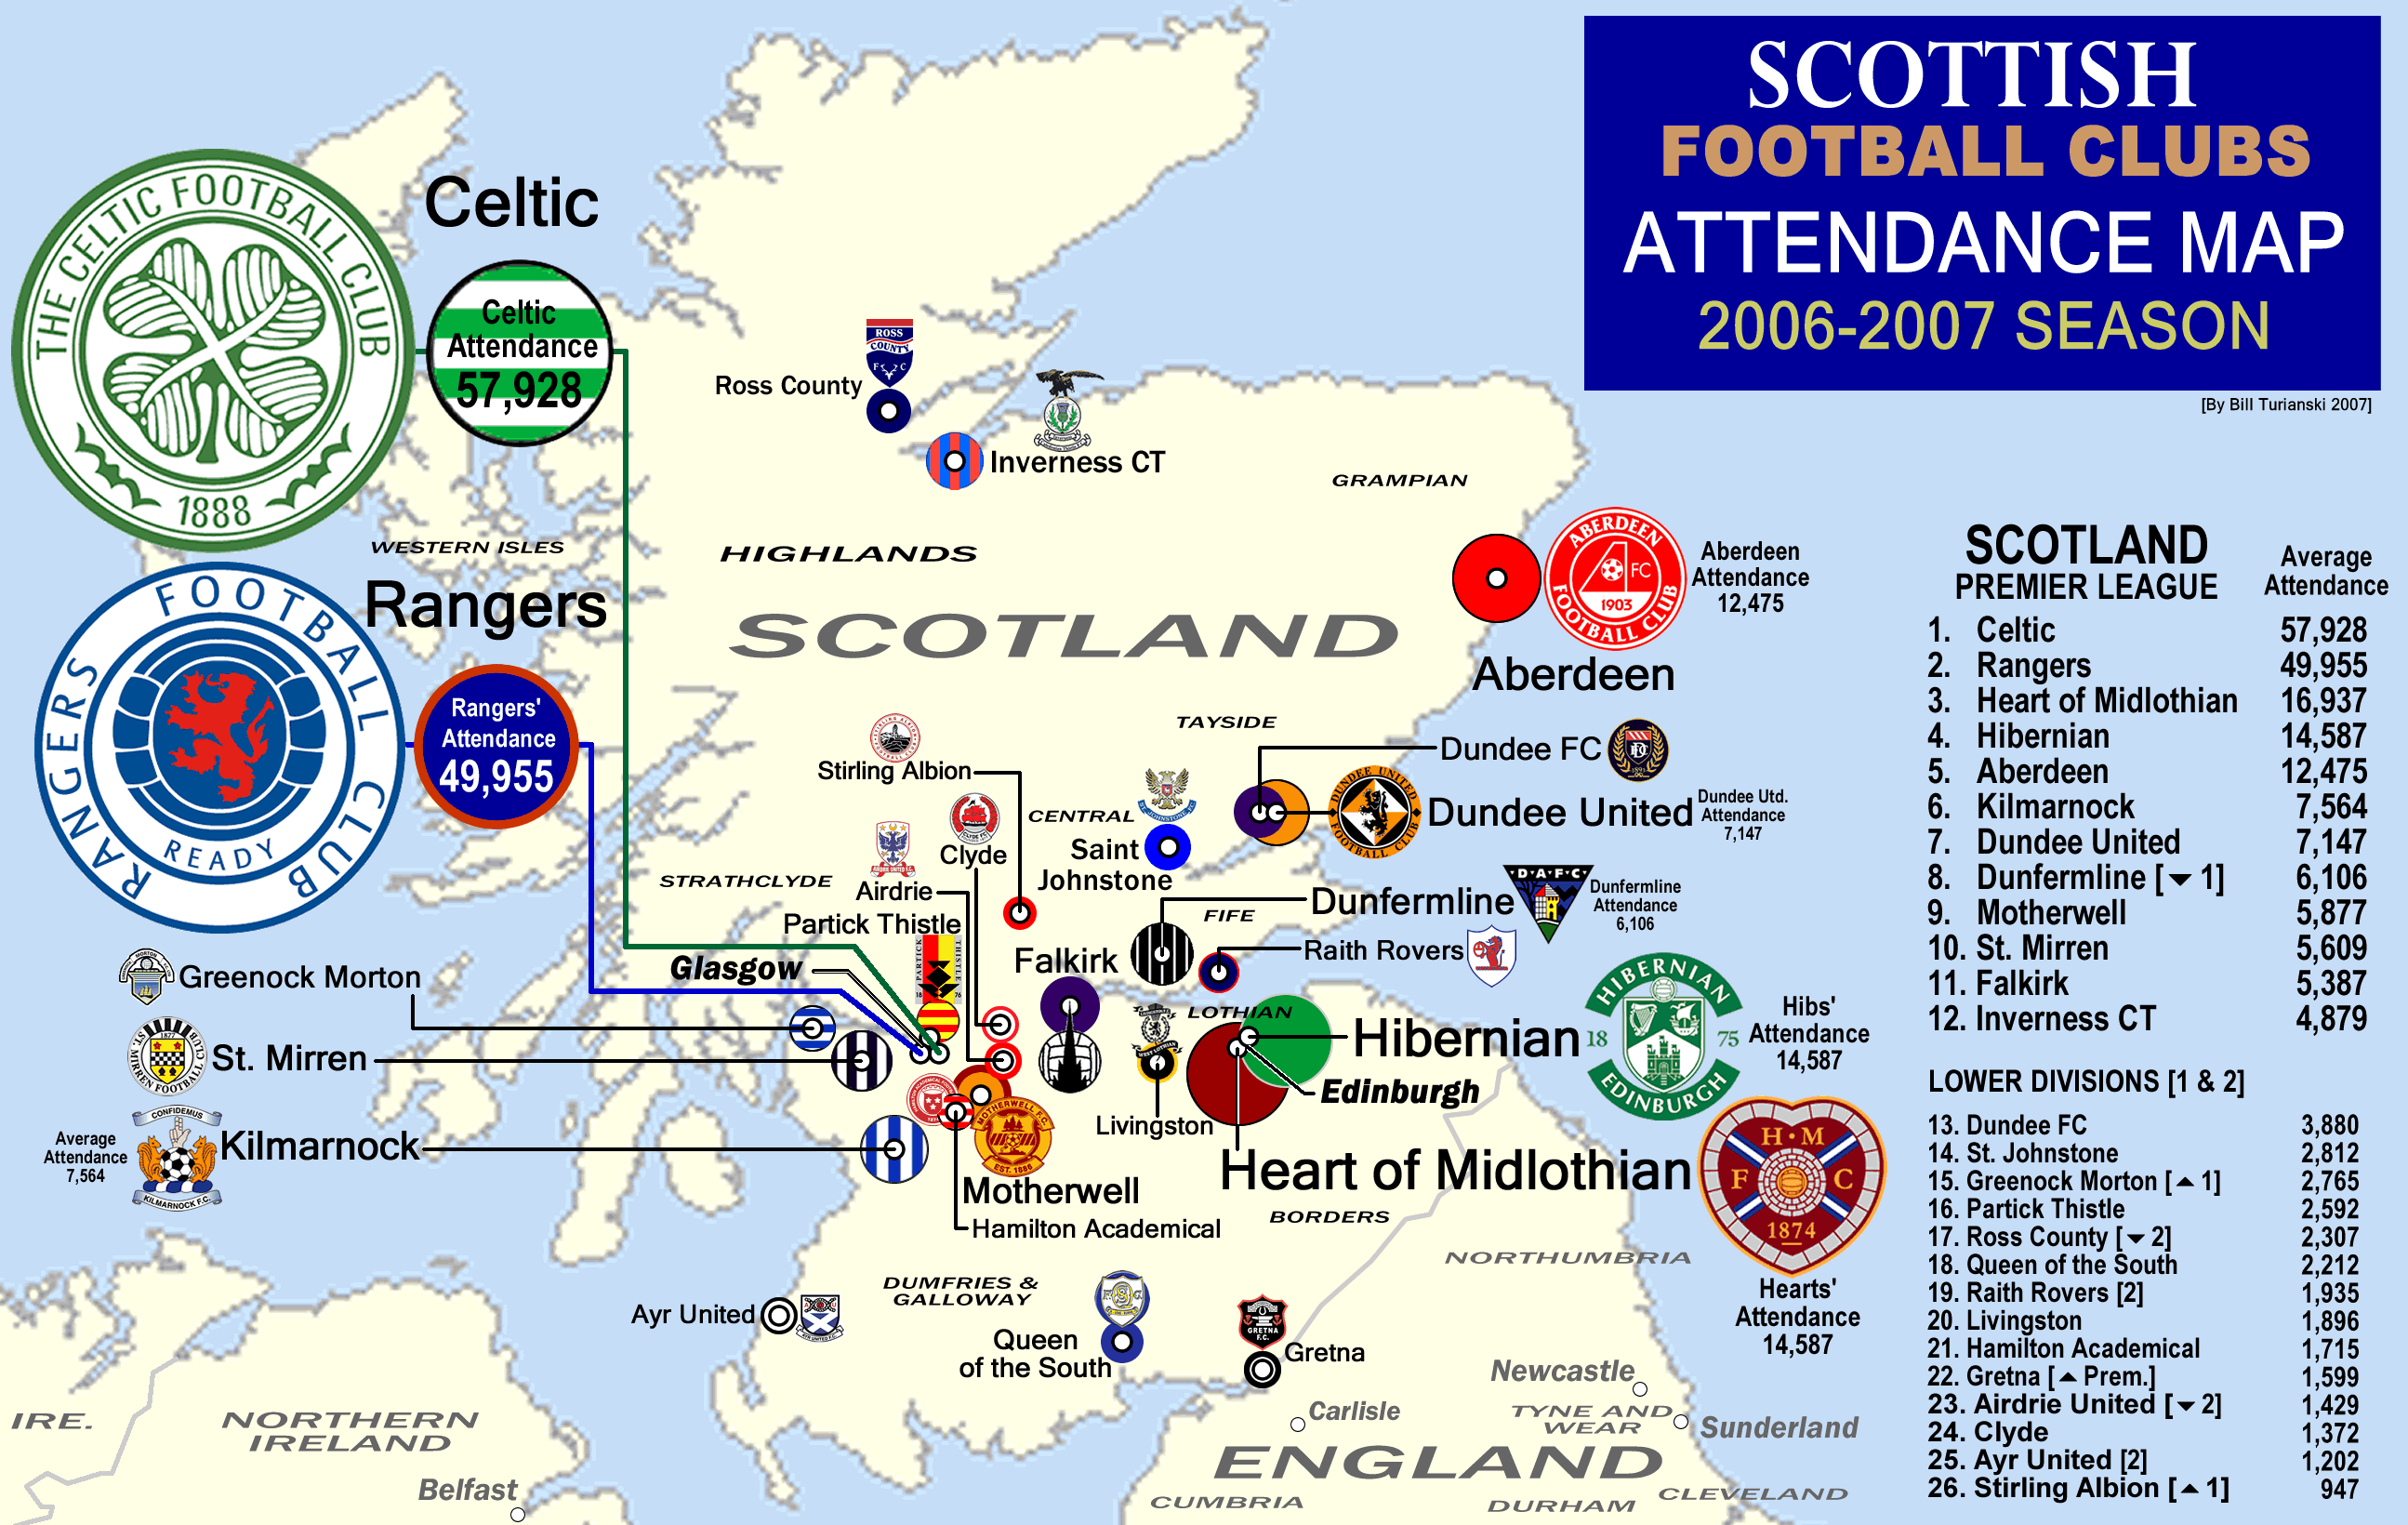
Scottish Football Clubs. Attendance map 2006-07.

Filed under: Scotland — admin @ 3:30 pm

scot_segment11.gif
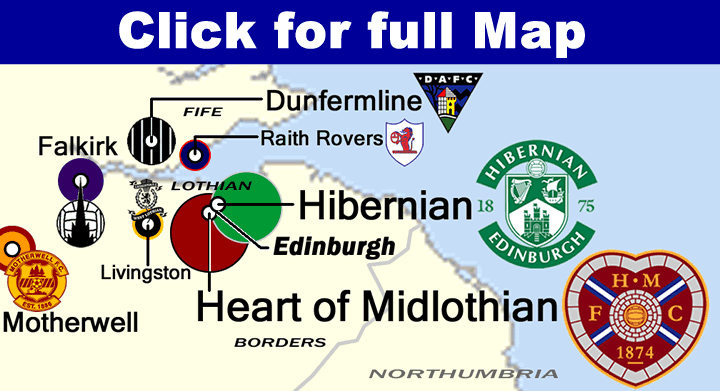
On this map, the team’s crest size is tied to how large their average attendance is.  The bigger the gate, the bigger the crest.  Of course, the “Old Firm” teams of Celtic FC and Rangers FC (both from Glasgow) dominate the map, like they dominate Scottish football.  After them, three teams have relatively healthy fan bases: Hearts and Hibs (both of Edinburgh), and Aberdeen.  They average between 12,000 and 17,000 per game.  Then there are 4 or 5 clubs with attendances between 5,000 and 8,000, like Kilmarnock and Motherwell.  After that, it’s all minnows (tiny clubs).
 

September 14, 2007

National League, est.1876. Origins map.

Filed under: Baseball,Hand Drawn Maps,Retro maps — admin @ 9:29 pm

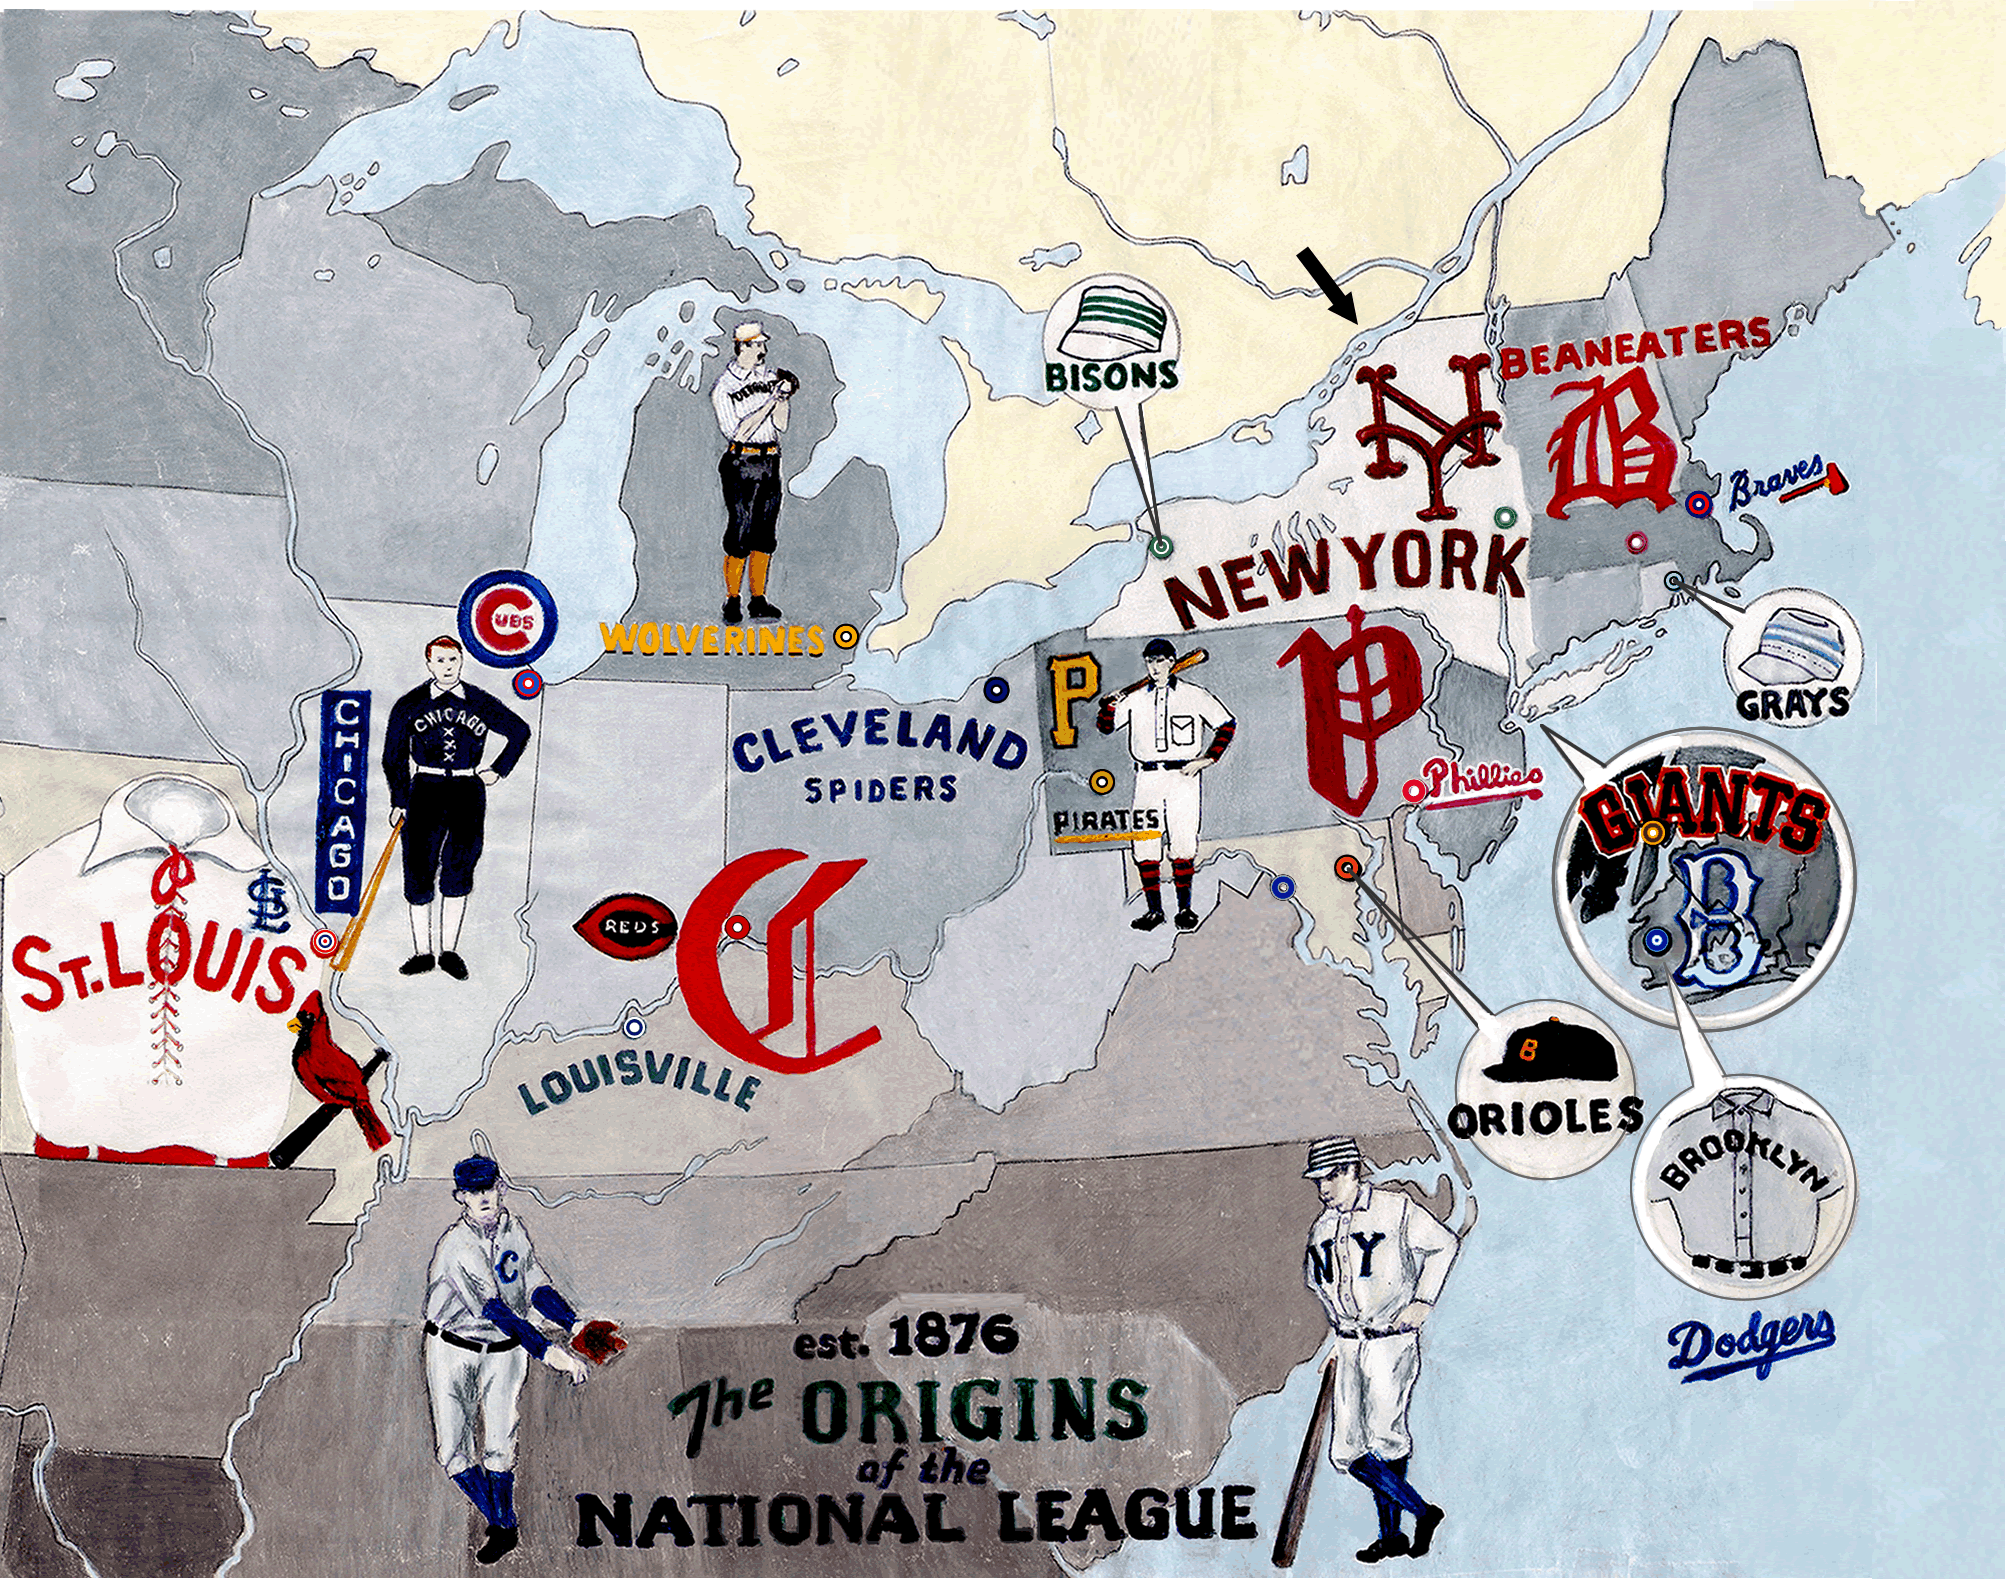
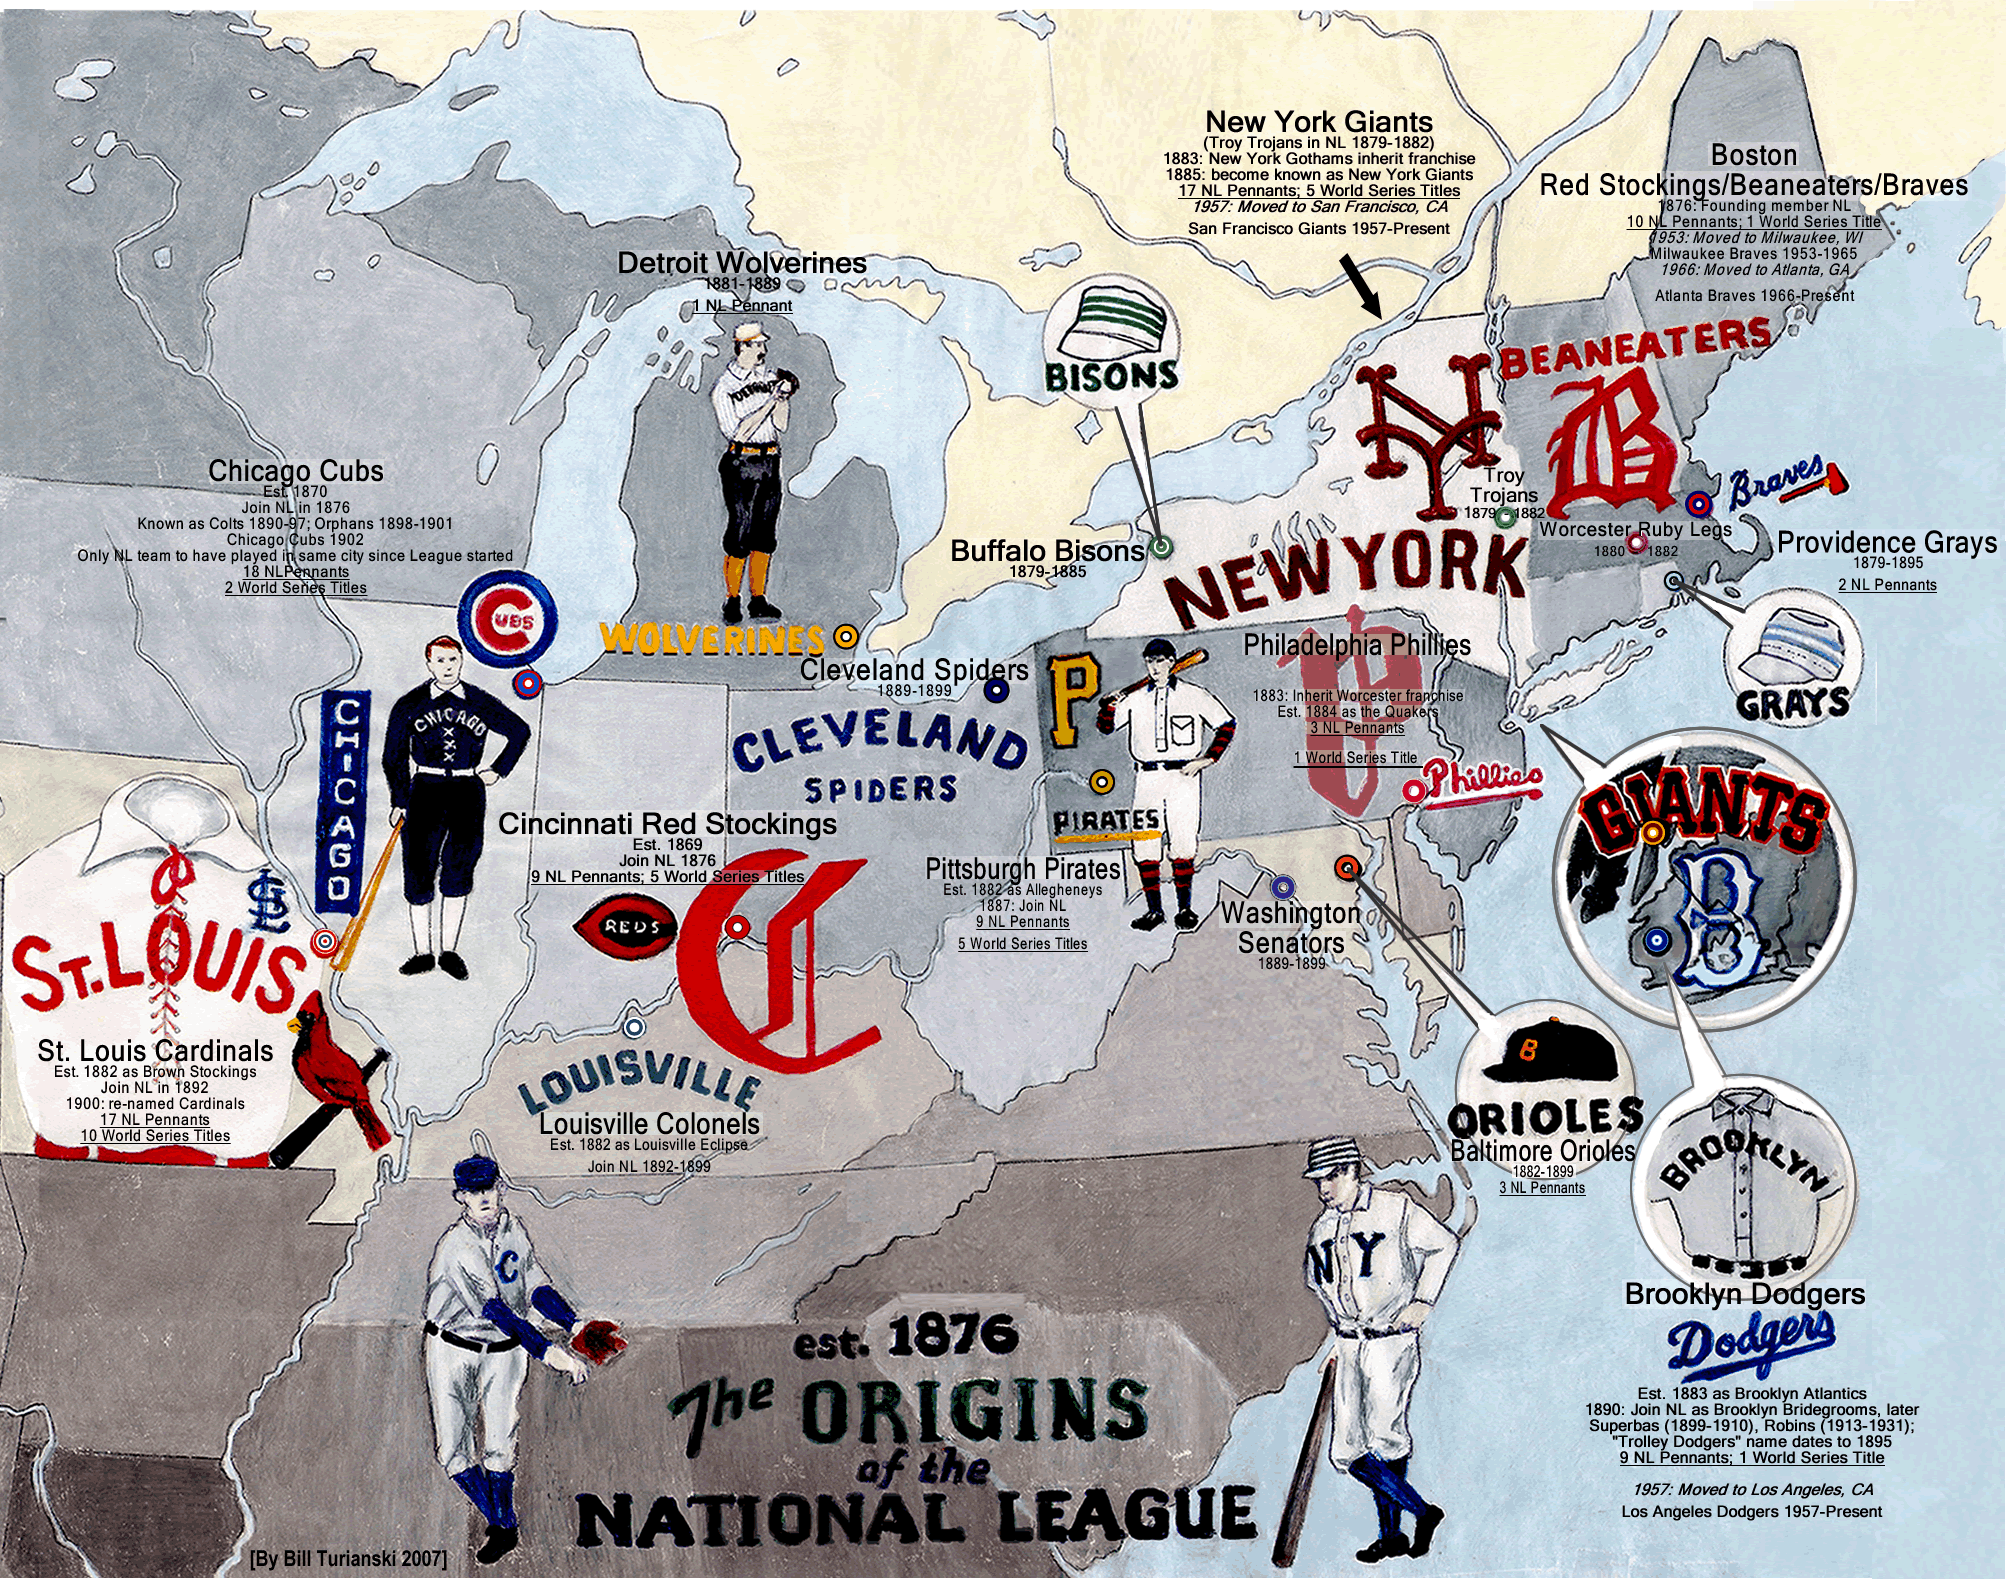
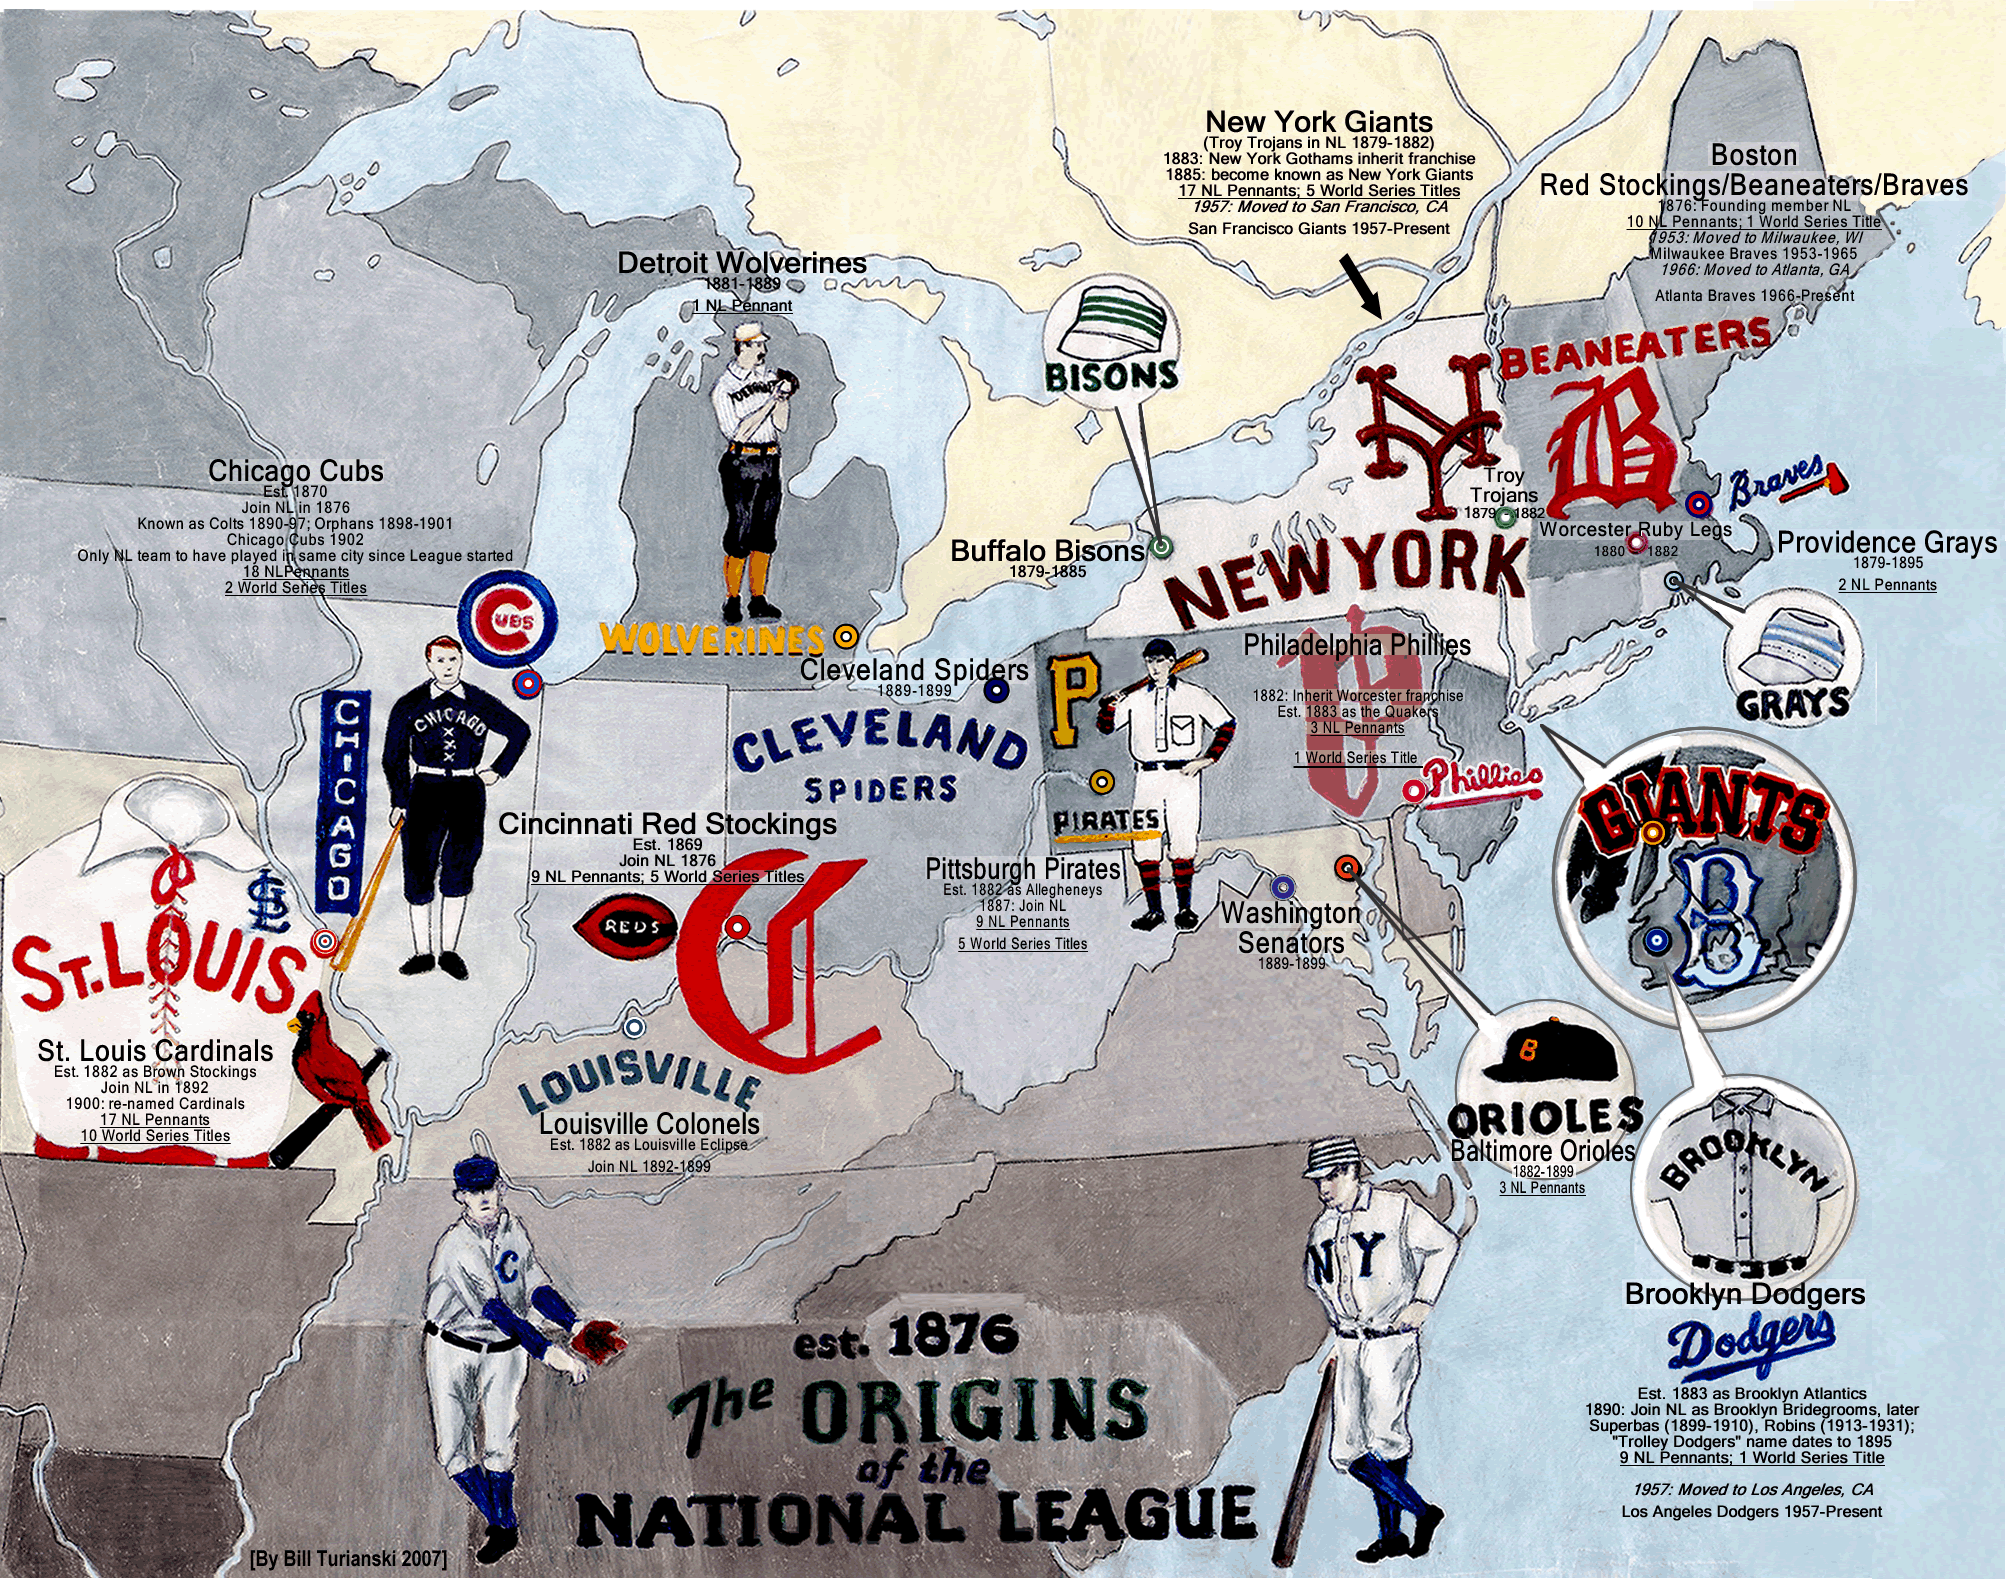
mlb_nlsegmen1t.gifThe National League was formed in 1876.  

This map shows all the NL ball clubs that were prominent during the late nineteenth century.

(1876 to 1900).

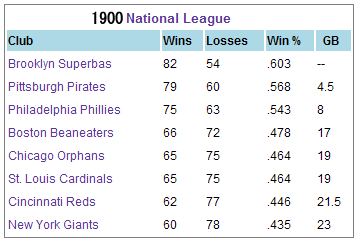
 The NL contracted from 12 to 8 clubs after the 1899 season.  The remaining 8 clubs all still exist today, although several are in different cities.  In fact, no National League club has folded since 1899.  

September 12, 2007

Spain: La Liga, 2007 Attendance Map.

Filed under: Spain — admin @ 9:45 am

spain_segment1.gif                                                


Note: to see my latest post on Spanish football, click on the following, category: Spain.

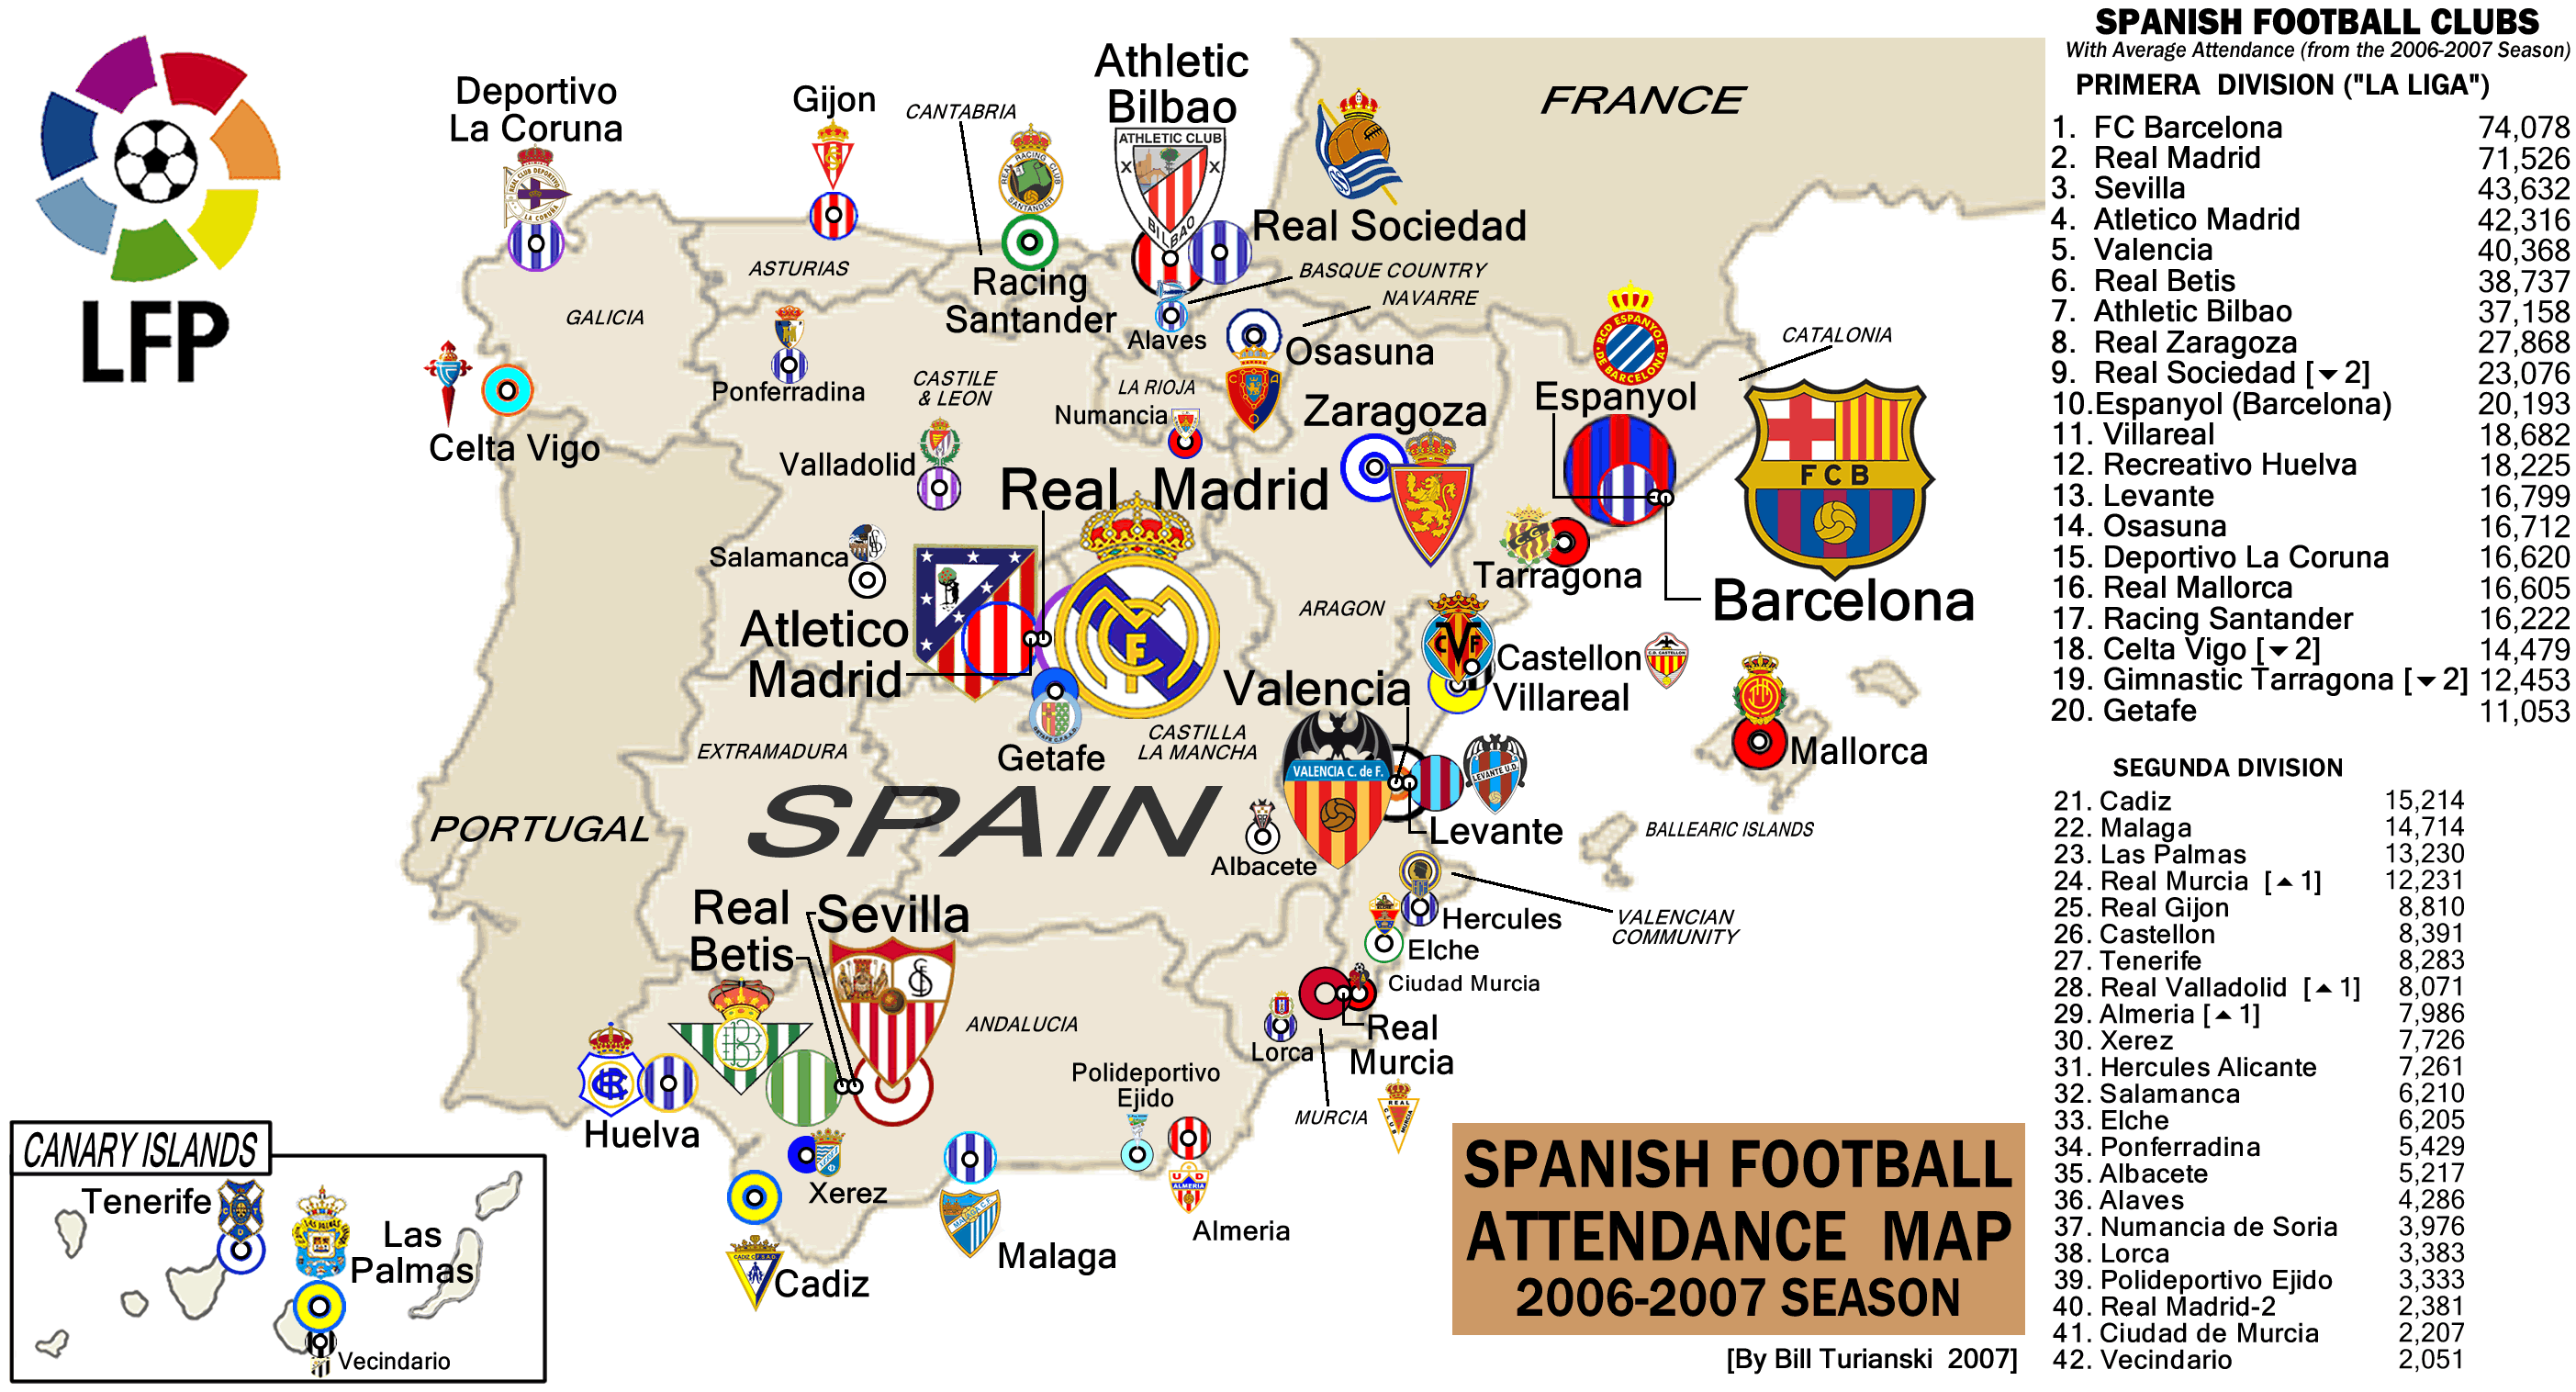
In the Spainish Liga Futbol Professional (or “La Liga”), there are usually a couple of smaller clubs that sneak into the top flight for a year or two before being sent back down.  Last season, it was Gimnastic Tarragona.   For the 2007-2008 season,  all three newly promoted clubs fit this category:  Real Valladolid, Real Murcia, and UD Almeria.  Real Murcia averaged a bit over 12,000 per game, while the other two were around 8,000. 

That makes for some pretty meager gate receipts, especially when compared to the 70,000 per game that FC Barcelona and Real Madrid draw.  One would think that these smaller sides have no hope of any kind of success in La Liga.   But look at how well Getafe CF has done.  Located in the unfashionable outskirts south of Madrid, in a small stadium ringed by expressways, this upstart club had never been in the top flight before promotion in 2004.  It was only formed in 1983,  out of the remnants of two small clubs.  But once they got to La Liga, they’ve thrived, with finishes of 13th, 9th and 9th.  In fact, they’ve earned a berth in the 2007-2008 UEFA Cup (the second-tier European competition) by being the runners-up in the Copa del Rey in 2007, losing to Sevilla 1-0.  This was accomplished while in the shadow of Real and Atletico Madrid, who between them drew 113,000 per game.  Getafe drew 11,000 per game.  Talk about plucky minnows.

Most every country in Europe has from two to four clubs that dominate the football league.  Spain is no different.  At this point it’s the big two of Barcelona and Real Madrid, with Valencia and Sevilla closing in.  But in Spain, the ”lesser” clubs can really do some damage—just look at who has won the Copa del Rey recently:  Espanyol (the poorly supported neighbor of Barcelona) in 2006, and 2000;  Real Betis (a perennial underachiever with good attendance and few trophies) in 2005; “cup specialists” Real Zaragoza in 2004, 2001,and 1994;  and complete nobodies Real Mallorca in 2003.

Villareal CF is another example of a Spanish club punching above their weight.   The town has just over 40,000 inhabitants, yet the “Yellow Submarines” ably handled the likes of Benfica, Manchester United and Inter Milan during the 2005-2006  European Champions League, making it to the semi-finals.  This from a club that had never been in the top flight before 1999.  CD Tenerife, from the remote Canary Islands, had a similar run, albeit in the UEFA Cup, in the mid-1990′s.  But Tenerife’s run ended in a crash and burn as they sank in the late 1990′s, through overspending and mass defections.

That is the great threat posed to medium size clubs: stretching ones’ self too thin by going for glory in Europe, while sliding down the table in the domestic competition.  It happens again and again, all over Europe.  Here’s hoping it doesn’t happen to Getafe this season, though a defection has already occurred: manager Bernd Schuster bought out his contract with Getafe, to become manager of Real Madrid.  One can’t criticize him for his ambition, but it remains to be seen if Getafe can succeed without him.
  

September 3, 2007

France Ligue 1 Attendance Map, 2006-07 season.

Filed under: France — admin @ 10:37 am

france_attendance_map2006_07chop.gif


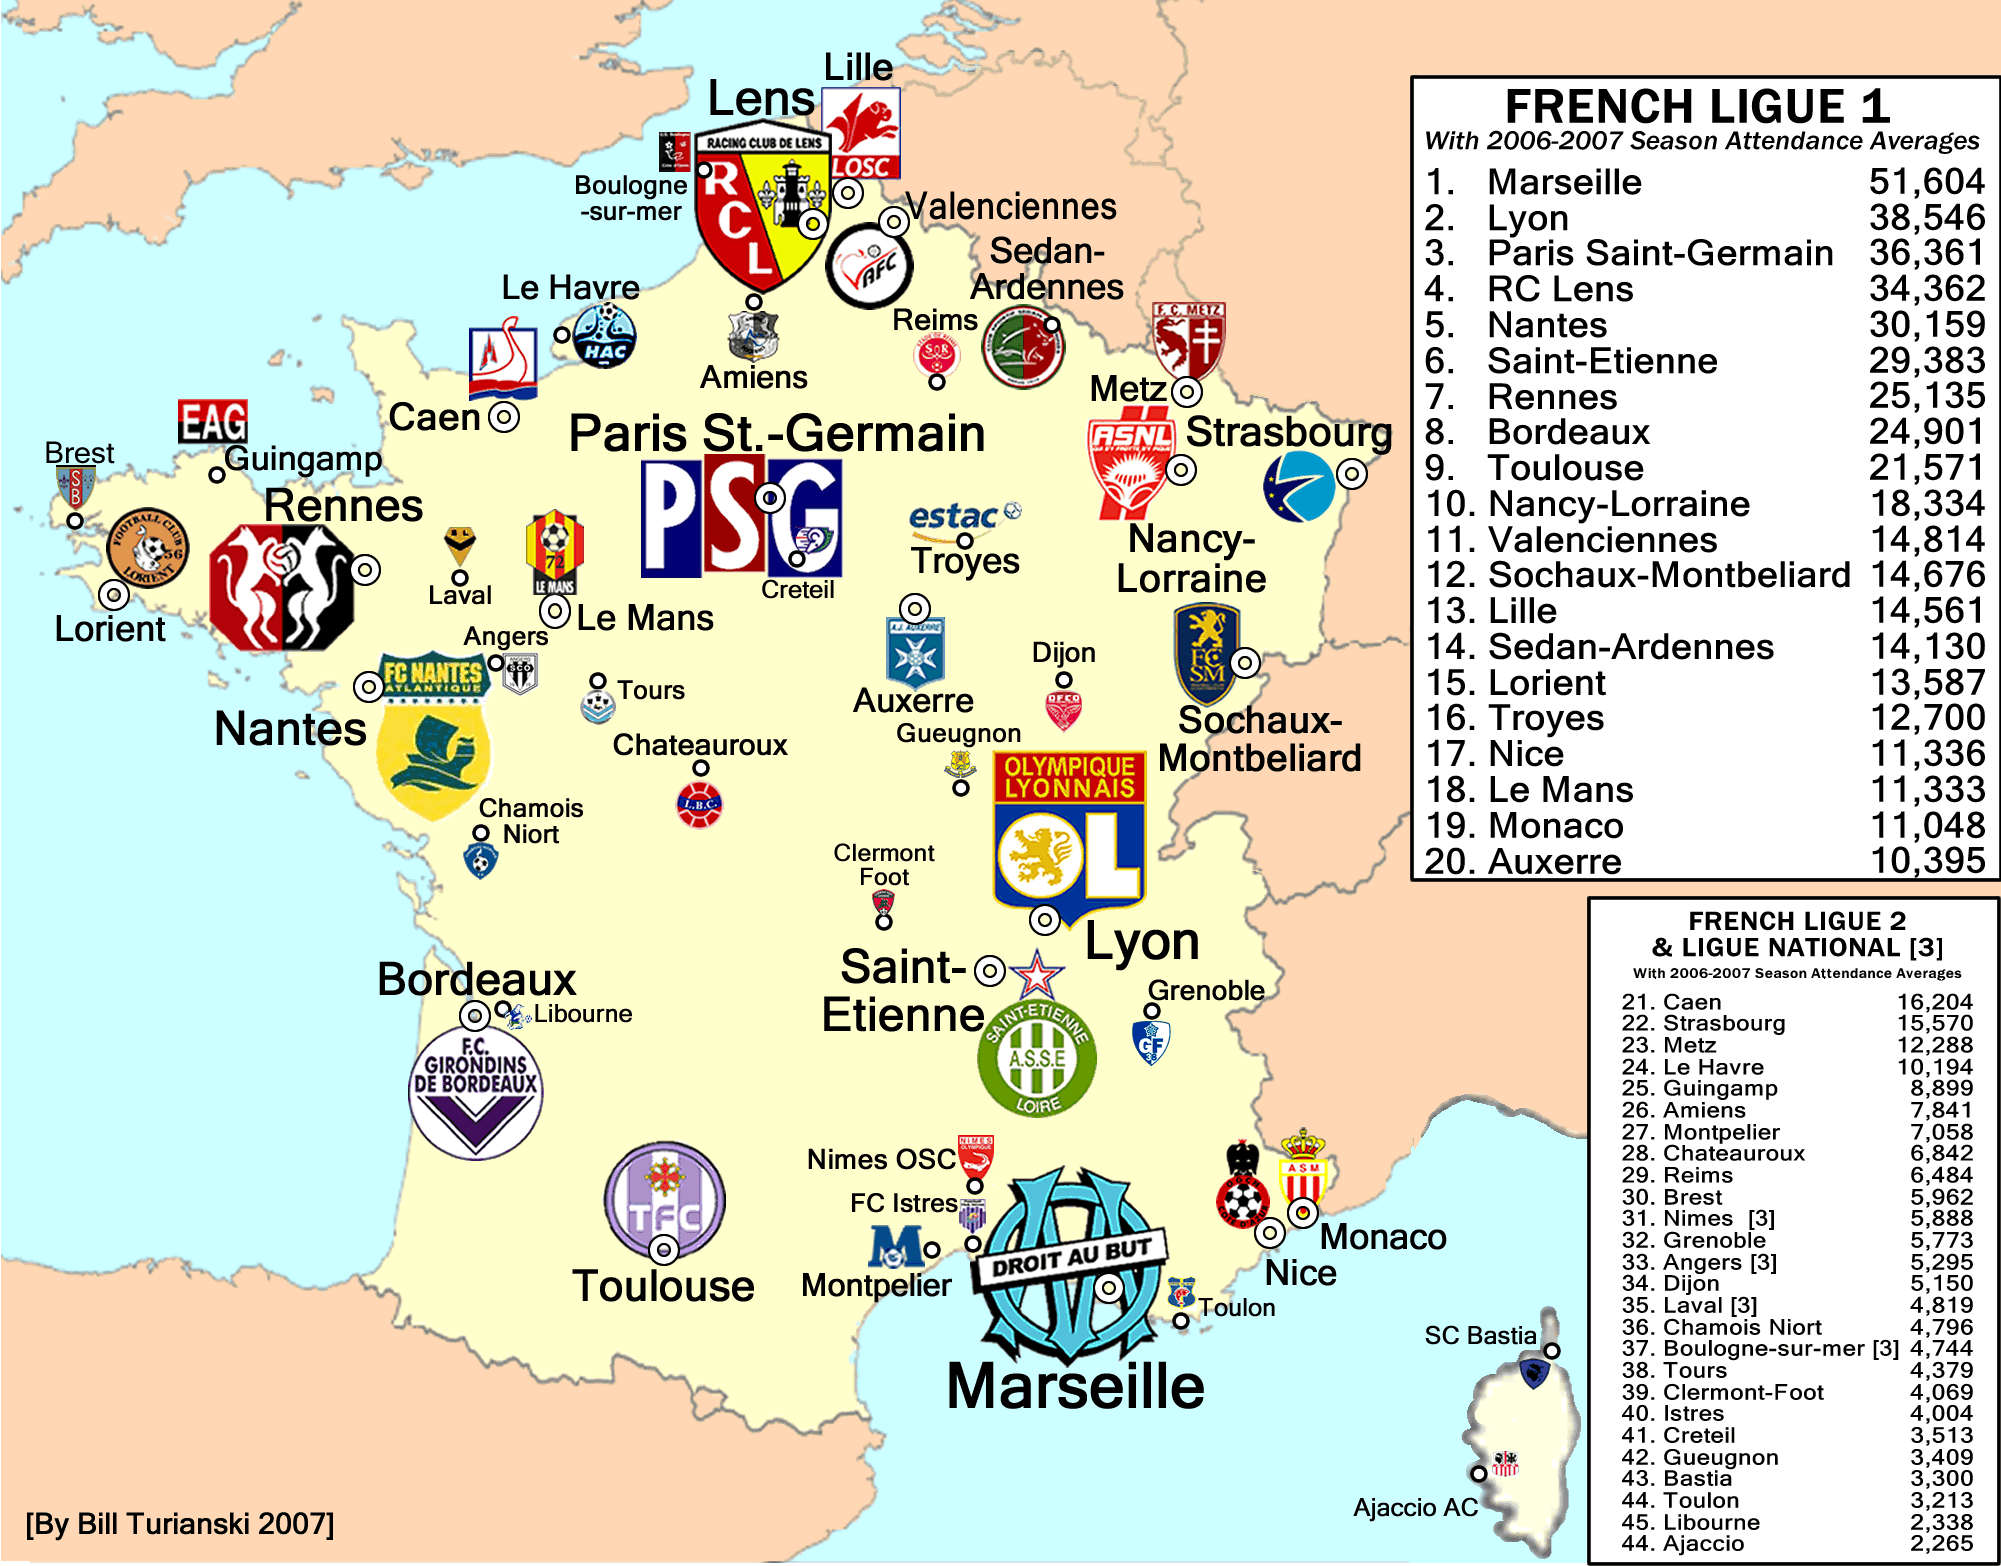
After years of drawing maps of sports leagues, I decided I wanted to better represent how “big” each team was.  By “big,” I mean successful and popular.  These two usually go hand in hand.  An ideal way of measuring this would be some complicated system tabulating championships,  cup wins,  years spent in the first division,  attendance figures, and merchandise sales.  But that would be a ridiculously vast undertaking.  To cut to the chase, I came up with this kind of map.

I decided to simply use average attendance figures to determine the pixel size of each team’s logo.  I think this system works well in visually establishing which teams are big, which are also-rans, and which are minnows.

Here, one can see the predominance of Olympique de Marseille, Paris Saint-Germain, and Olympique Lyonnais.  Also, one is able to see which smaller clubs are nearby the big clubs, while, at a glance, understanding their importance (or lack thereof). 

Another feature is that 2nd division clubs with solid followings are not ignored, as they so often are by the media.  One can see how two clubs, SM Caen and RC Strasbourg, drew better than 30% of the 1st division.  Incidentally, they both were promoted at the end of the season.

Of course there are anomalies, such as in the case of Lille LOSC.  Lille are awaiting finalization of plans for a new stadium, and are playing currently in a small, inadequate stadium with a capacity of around 18,000.  Nevertheless, they finished in 2nd place two seasons ago, and have played well in the Champions League for two straight seasons.  So by the dictates of my system, their logo is rather small sized, and does not reflect their recent success.  This will change when their ~33,000 seat stadium is completed.  It is targeted for a 2010 completion, but no one is holding their breath.

On the other hand,  Stade Rennais (aka Rennes) averages 25,000 per game, but has little silverware in the trophy case (last trophy: French Cup in 1971).  So on the map, their logo is rather large, but their accomplishments are  small.  This can be  explained by the fact that, as the prominent team of Brittany, they are assured of solid support, regardless of success.  The ultimate example of this is northeast England’s Newcastle United, the poster boys for popular futility.  Year in, year out, this club draws near or above 50,000 per game, but has not won anything meaningful since 1955.

In other words, my Attendance Maps don’t necessarily measure accomplishment, but they do measure the ability to sell tickets.  And nine times out of ten, success at the turnstile means success on the pitch.
August 26, 2007

French Ligue 1, 2004-05 through 2007-08 seasons.

Filed under: France,Hand Drawn Maps — admin @ 1:57 pm

french_ligue1chop2.gif

This map was drawn in the summer of 2004. 

It’s been updated by including the six clubs who have also been in the league since then.

Three clubs were relegated, then promoted again, in this 3-year period:  FC Metz,  RC Strasbourg, and SM Caen. 

In England, these types of teams are called yo-yo clubs.  West Bromwich Albion and Sunderland AFC are classic   examples of this; a few years ago, Bolton Wanderers and Manchester City FC also had this unwanted distinction.

I did a search, and it looks like the French also use the term…albeit as “yoyo.”

August 22, 2007

English Football League 2006-2007

Filed under: Hand Drawn Maps — admin @ 12:39 pm

english_football_league_attendances_and_league_history.gif  english_football_league_attendances_and_league_history2.gif46england_3.gif 


This map shows the location of all 92 teams in the English Football League, in the 2006-2007 season.  Logos of the teams in the top two divisions, plus a few larger teams in the 3rd division, are shown. The size of each team’s logo is in proportion to it’s average attendance.  A two-page chart showing teams’ attendances, and league history, is also included.  [To view this, click on the 2 gifs at the top]

The English Football League is split into 4 divisions.  The top division is called The Premier League.  It is considered, along with Spain’s La Liga, and the Italian Serie A, the best soccer league in the world.

Each season, the top 3 teams are promoted from the 2nd division to the Premier League.  Also, the bottom 3 teams are relegated from the Premier League to the 2nd division.

This promotion/relegation system is in place in all 4 divisions, and is crucial to the highly competitive nature of  English Football.  Big clubs cannot sit on their laurels, or they’ll find themselves sent down.  Recent examples of this are Leeds United FC and Nottingham Forest FC.  Both are very big clubs… ex-champions, in fact.  (Leeds in 1992, Nottingham in 1978.)  But through profligate spending, ill-advised moves, and ultimately,  poor play,  both are currently stuck in the 3rd division. 

On the other hand, plucky “minnows” (small clubs) like Colchester United FC and Scunthorpe United FC have punched above their weight, and now find themselves in the 2nd division.  This in spite of the fact that both teams play in small towns, and in stadiums with capacities of less than 9,500.  This in a division where half the clubs have average attendances above 20,000.

The whole relegation/promotion system dates back to the late 1800′s, during the earliest days of the League.  It has been adopted by most every soccer league in the world, with the notable exception of  leagues in the USA.  It is ironic that America, land of free-market capitalism,  has pro sports leagues that behave like communist states.

In America, once a team joins a pro sports league, it can  stay there no matter how continuously poor it’s performance is.  If the team is making a decent profit, but not performing well, what reason does management have for trying to improve ?  That’s expensive, and with no guarantee of success. They can sit back and be mediocre, making their safe profit.  This smacks of socialism in it’s most negative sense, where a person need not actually strive for competence, because he has no threat of being sacked. 

Meanwhile, Europe, land of the Social Democratic State, has sports leagues that are so competitive that they resemble a highly Darwinian form of cut-throat capitalism.

« Newer PostsOlder Posts »

Powered by WordPress