MLB: Paid-Attendance Map for 2025 season
…
…
By Bill Turianski on the 8th of April 2025; twitter.com/billsportsmaps.
Links…
-Official site…mlb.com.
-Teams, etc…Major League Baseball (en.wikipedia.org).
-Attendance figures (2025 home regular season tickets sold), baseball-reference.com/2026-misc.
…
The map…
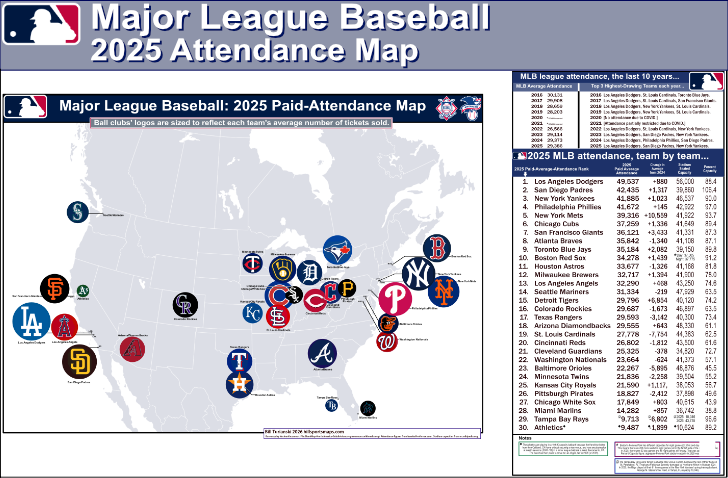
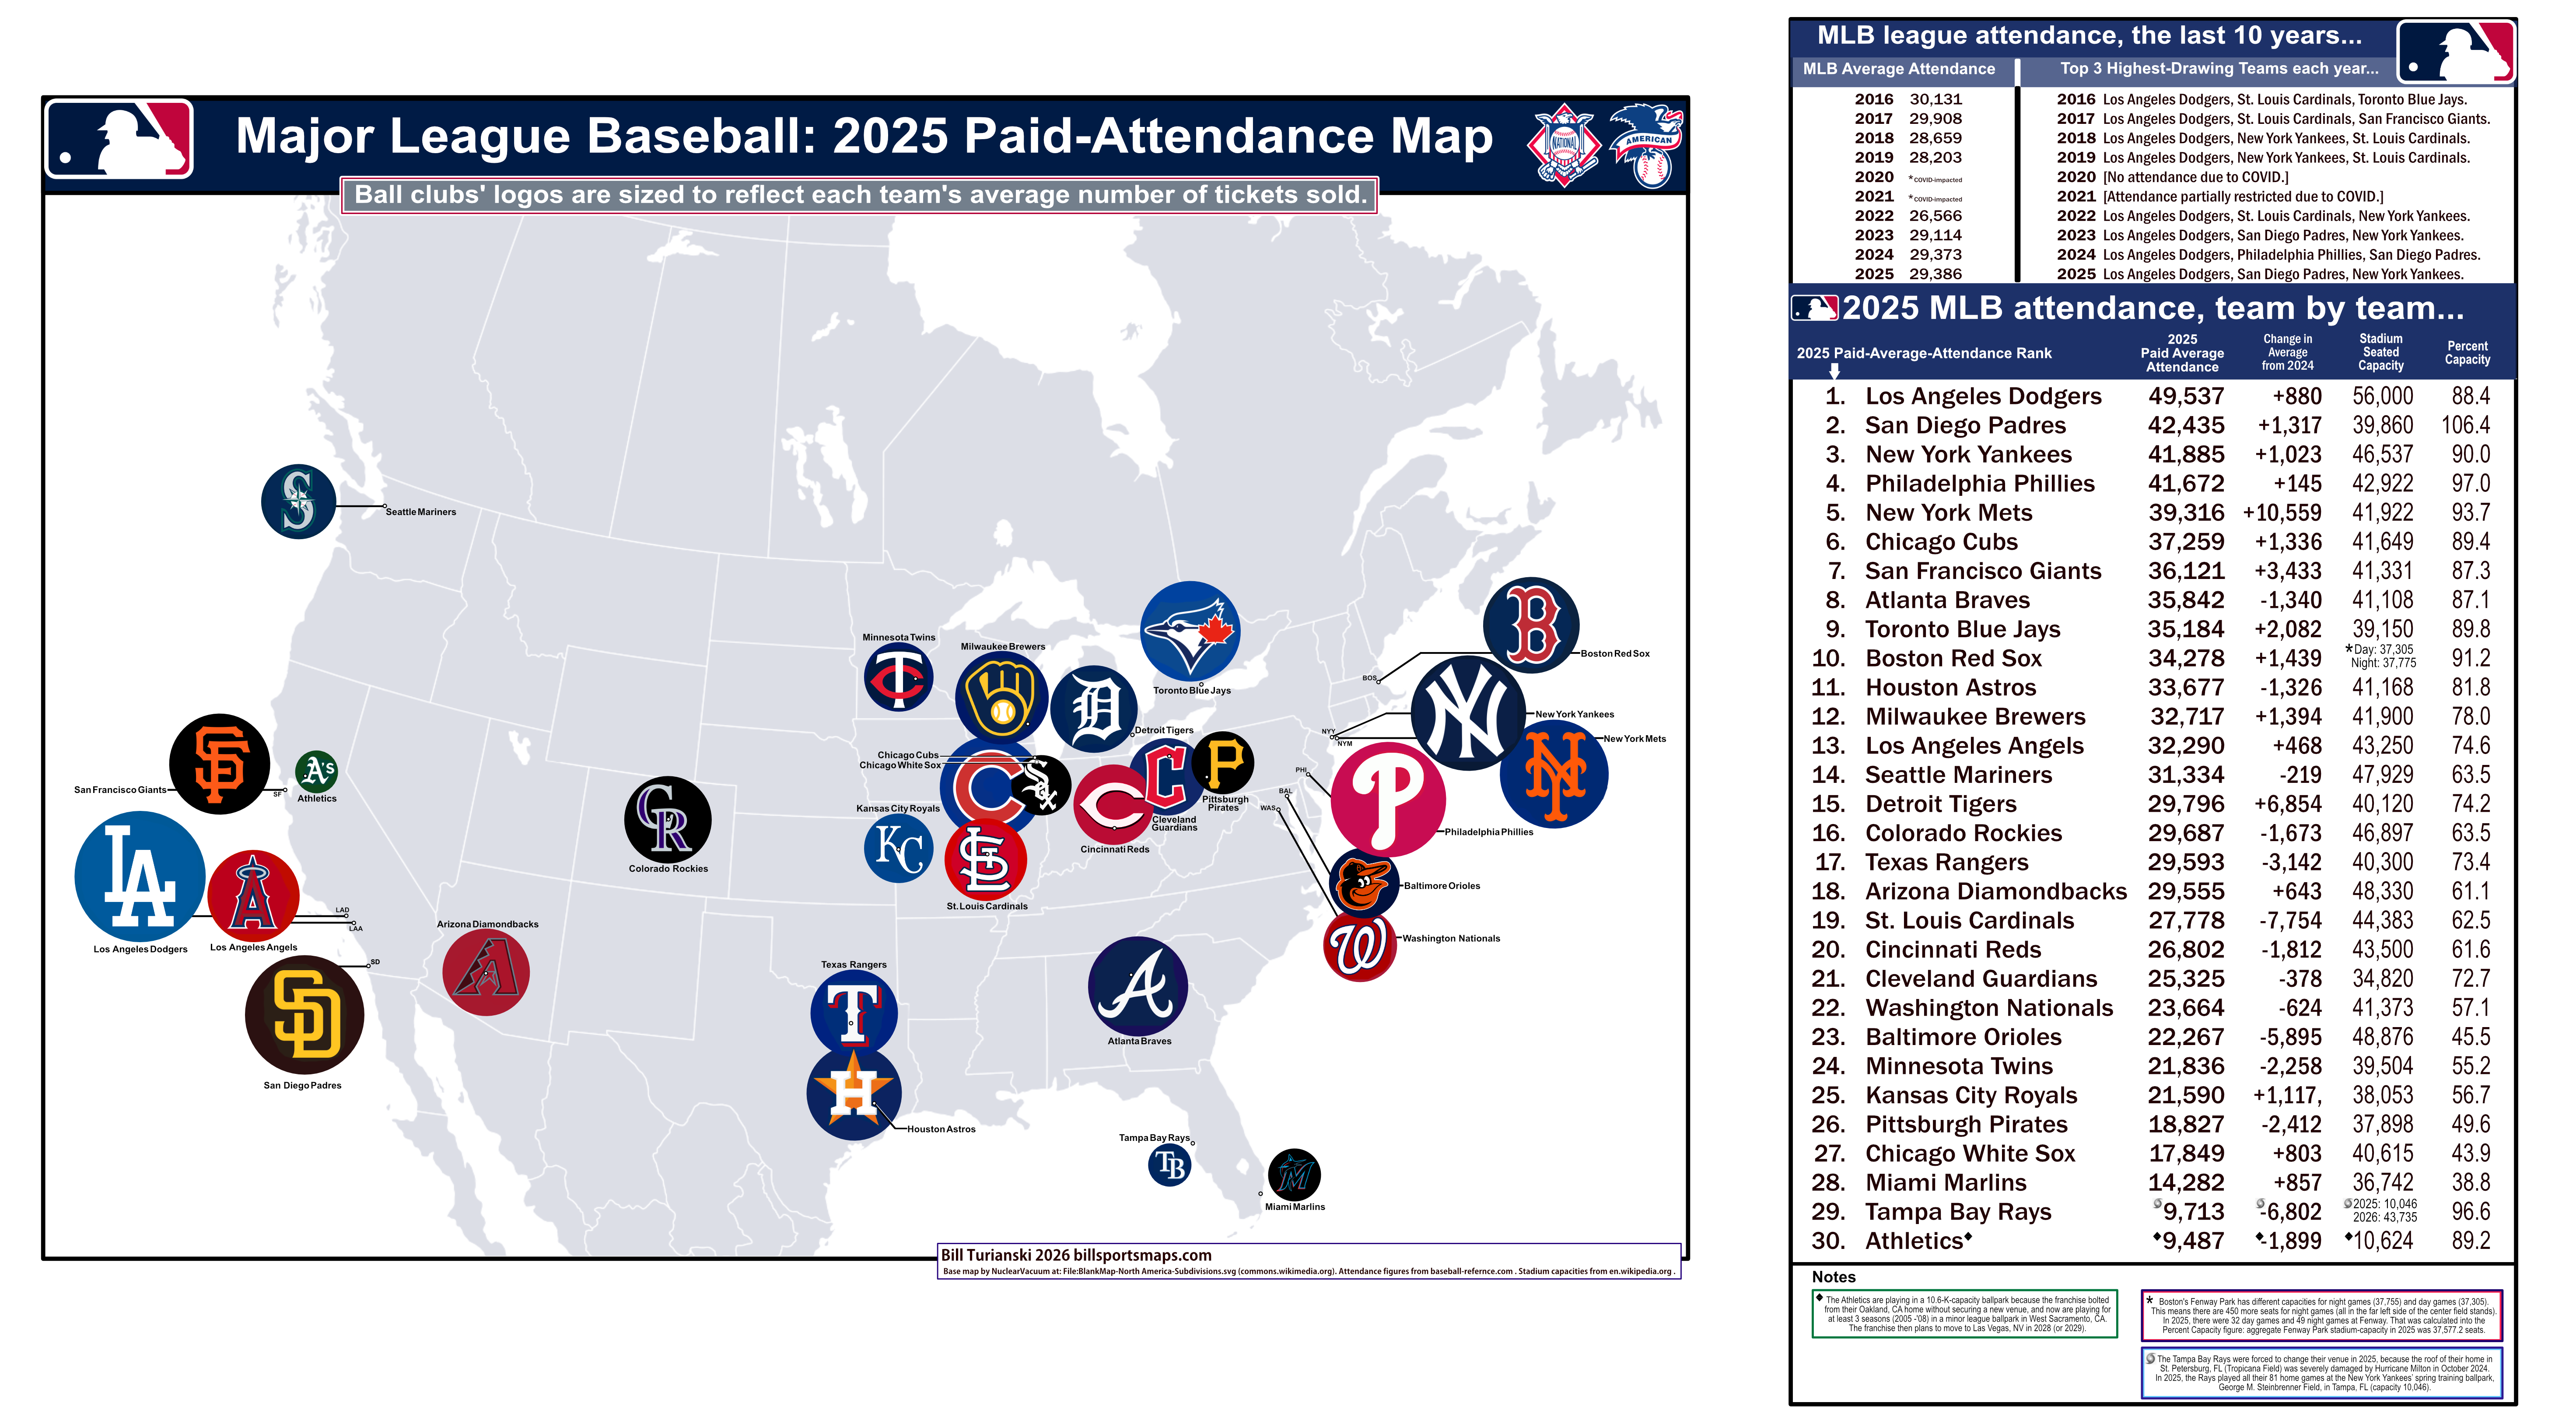
The map shows the 30 MLB teams. The larger the team’s average attendance, the larger their circle is on the map. The circles on the map contain each MLB teams’ 2025 home cap logo. That is, except with respect to Baltimore’s cap-logo, which is of their all-black road cap, because the Orioles wear their white-paneled cap at home, and I wanted to maintain a uniformity to all 30 of the circular-cap-logos on the map.
The circles-with-cap-logos were then sized to reflect crowd size, utilizing a constant gradient. If you are unsure about the term “paid-attendance”, my post on MLB paid-attendance from 2015 can clear that up for you {here, 2014 MLB paid-attendance map}.
The chart at the right-hand-side of the map page shows 5 things: 2025 Attendance-Rank, 2025 Average Paid-Attendance, Numerical Change in Average Paid-Attendance from Previous Season [2024], Venue Capacity [2025 season], 2025 Percent-Capacity.
At the top of the chart is a new list i put together, showing 2 things: MLB overall attendance for the last 10 years (2016-2025), and the top-3 highest drawing teams in each of those years.
…
 In 2025, MLB as a whole drew 29,386 per game, a slight increase over 2024, and a figure that would have been higher without the stadium situations of the Athletics and of the Tampa Bay Rays {see Notes, at the foot of the attendance chart at the bottom-right-hand-side of the map page}. Major League Baseball has still not gotten back to their most recent attendance peak in the 2016 season, when the league averaged 30,131. But every season since the COVID-impacted years of 2020 and 2021 have seen more fans at MLB ballparks. (In the 150 years that Major League Baseball has existed, there have been only 15 years when the league drew higher than 30-K-per-game, and all of those highest-drawing seasons occurred between 1993 and 2016 {source: baseball-reference.com/leagues/majors/misc}.)
…
…
Top 4 highest-drawing MLB teams in 2025
…
(All teams that drew above 40,000 per game.)…
 1. The Los Angeles Dodgers drew 49,537 per game, with an increase of 880 per game from 2024. In 2025, the Dodgers played to 88.4-percent-capacity at Dodger Stadium in Chavez Ravine. It needs to be pointed out that Dodger Stadium, the largest venue in the Major Leagues, is simply a beautiful, stunning, and fan-friendly ballpark. And the Dodgers have been consistently competitive for several decades now. So it is not a real surprise that the Dodgers have had the highest attendance in MLB now for 12 straight seasons (2013 to 2025, w/ the COVID-affected 2020 season excluded). And in 2025, the Dodgers repeated as World Series champions, winning their 9th title (and their 8th WS title in Los Angeles, following a 36-year title drought).
 2. The San Diego Padres drew 42,435 per game, with an increase of 1,317 per game. In 2025, the playoff-bound Padres were again able to draw in excess of their seated capacity (of 39.8-K). The Padres played to a rather impressive, league-leading 106.4-percent-capacity. How? Well their ballpark, Petco Park, is awesome, and the Padres are very competitive. And thanks to the vast lawn seating behind the center field fence at Petco Park, they can just pack them in there. It also helps that, Major-league-wise, the Padres are the only game in town. Because the city of San Diego, after losing their NFL team to LA a few years back, has now become the only city in the USA (and Canada) which only has an MLB team, but not an NFL or an NBA or an NHL team. So you can see why San Diego sports fans have so strongly gravitated to Petco Park.
 4. The New York Yankees drew 41,885 per game (at 90-percent-capacity). The Yankees drew their highest since 2018. But as the playoff-bound reigning AL champions (2024 AL pennant winners), and as the all-time most successful MLB ball club, in the biggest city in the country, the Yankees really should be drawing higher. I mean, OK, the Yankees had an attendance increase of 1,023 per game in 2025 – but as a team that had just made it to the World Series for the first time in 15 years, that 1.0-K-per-game attendance increase doesn’t seem like much {see the Phillies, next paragraph, who drew 9.5-K more following a recent WS appearance}. And last season the Yanks were still playing to 4,500 empty seats every game (and they drew 8-K per-game less than the Dodgers). At that overblown and fan-unfriendly monolith of a stadium in the Bronx.
 4. The Philadelphia Phillies drew 41,672 per game. For the second straight season the playoff-bound Phillies played to 97-percent-capacity at Citizens Bank Park. In 2022, the Phillies had drawn 28-K-per-game en route to an NL pennant and a World Series defeat to the Astros. The next season (2023), the playoff-bound Phils had a 9.5-K-per-game crowd increase (drawing 37.6-K-per-game). And the next season (2024), the playoff-bound Phils had a 3.9-K-per-game crowd increase (drawing 45.1-K-per-game). And last season, the playoff-bound Phillies had a 135-per-game attendance increase. So unless the Phillies stop their winning ways, it looks like they will continue to inch towards full-time/full-capacity crowds at Citizens Bank Park.
…
The 4 Largest Attendance Increases in MLB in 2025…
1. New York Mets, attendance up 10,559 per game. The Mets drew 39.3-K per game (which was 5th-best in 2025). And they set a record for attendance in their ballpark, Citi Field (which opened in 2009). In 2025, the Mets had the second-highest payroll in MLB. At the end of April, the Mets were 11 games above .500. And they had the best record in baseball by mid-June. But…the hapless, offense-heavy/mediocre-pitching/abysmal-defense Mets of 2025 had an epic late season collapse. In the end, the Mets barely broke .500, and on the final day of the season, they were eliminated from the playoffs {see second photo below}.

Photos above – Getty Images via sportsbusinessjournal.com; Lynne Sladky at psu.edu/story/mlb-new-york-mets-2025-collapse.
…
2. Detroit Tigers, attendance up 6,854 per game. The Tigers drew 29.7-K per game at Comerica Park (15th-best). This is the second straight season that Detroit has had a large attendance increase: in 2024, they saw a 3,000-per-game attendance increase {see my 2024 MLB map & post}. In 2025, although the Tigers made the playoffs (as the lowest [6th] seed), Detroit had totally choked down the stretch, giving up a 9½-game September lead in the AL Central (to Cleveland). But then in the post-season, the Tigers recovered, and beat Cleveland in the ALWCS, 2-1. But Detroit then fell to the Seattle Mariners in the ALDS, 3-2. In game 4 vs Seattle, there were 4,000 empty seats for a playoff game at Comerica Park {see second photo below}. Many blamed MLB, and its penchant for scheduling work-week postseason day-games on short notice. But Tigers fans’ disaffection following the team’s late-season collapse should also be factored in to account for the no-shows.
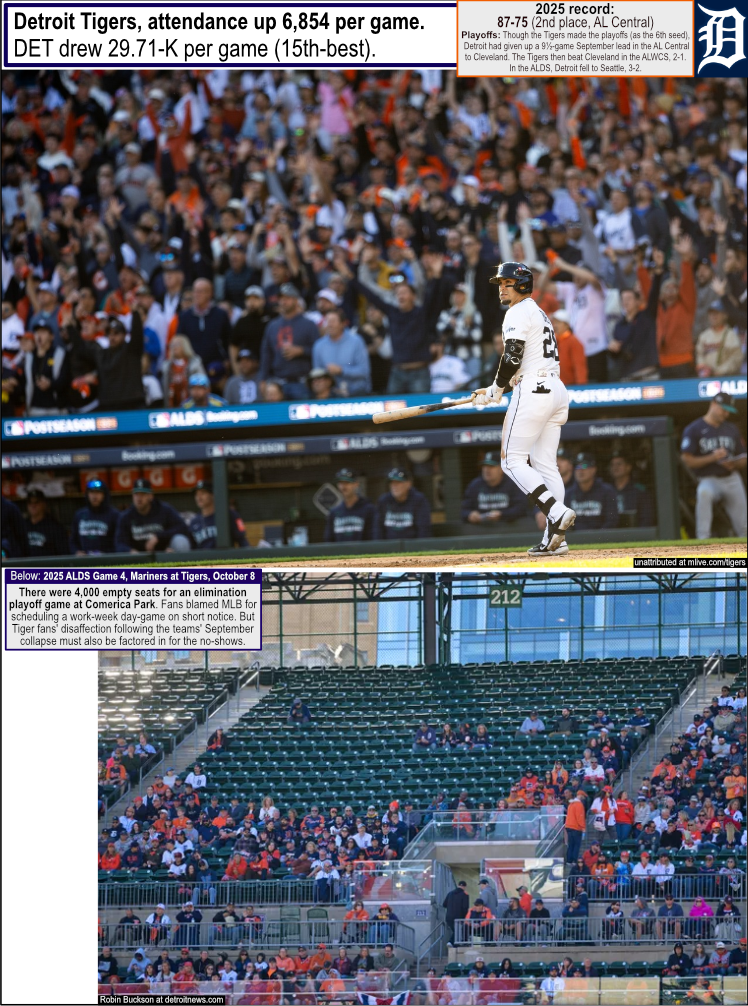
Photos above – unattributed at mlive.com/tigers/2025/10[/8]; Robin Buckson, The Detroit News at detroitnews.com/picture-gallery.
…
…
3. San Francisco Giants, attendance up 3,433 per game. The Giants drew 36.1-K per game (7th-best). In 2025, it was the 25th season of the Giants’ home Oracle Park, and there were several renovations in the ballpark that attracted more fans. Then the Giants started out very strong (winning 8 of their first 9 games). And by mid-June, the Giants were 11 games above .500, and they had just acquired slugger Raphael Devers, and they were regularly pulling in 40,000 on weekend games. It looked like the Giants were on course for the playoffs for the first time since 2021. But the Giants played below .500 ball for the rest of the season, and ended up finishing at 81-81.
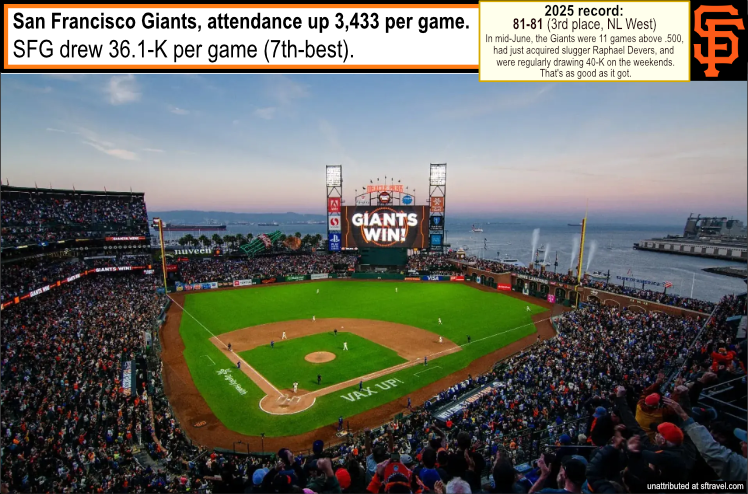
Photo above – unattributed at sftravel.com/article/your-guide-to-san-francisco-giants-baseball-oracle-park.
…
4.Toronto Blue Jays, attendance up 2,082 per game. After two straight playoff seasons (in 2022 and ’23) with solid 37-K-per-game attendance, Toronto’s sub-par 2024 season saw them lose 4,000-paying-customers per-game. In 2025, the Blue Jays reclaimed back half of that number, drawing 35.1-K (9th best). Why the attendance rebound? Because in 2025, the Blue Jays improved by 20 wins. They went 94-68, and beat out the Yankees for the AL East title, winning it on the last day of the season {see photo below}. In the playoffs, the Blue Jays were the #1-seed, with a 1st round bye. In the ALDS, they beat the Yankees, 3-1. Then in the ALCS they beat Seattle 4-3, winning the Toronto Blue Jays’ 3rd AL pennant. But in the 2025 World Series, the Blue Jays came close, but ultimately fell to the Los Angeles Dodgers in 7 games.
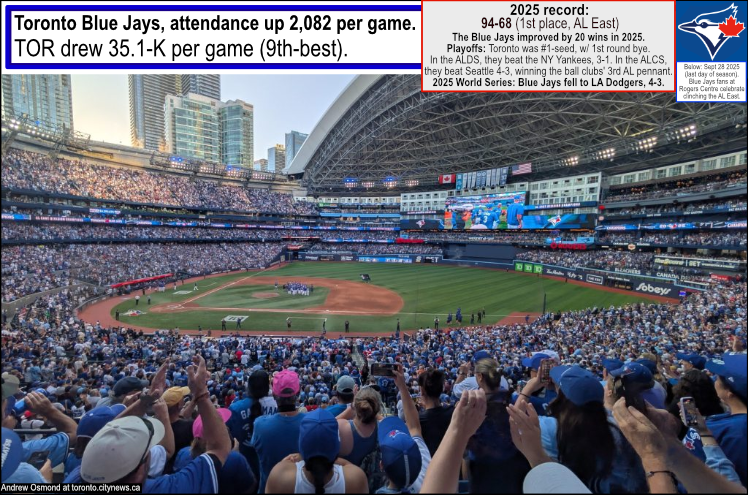
Photo above – Andrew Osmond, City News at toronto.citynews.ca
…
___
Thanks to NuclearVacuum for the blank map, File:BlankMap-North America-Subdivisions.svg (commons.wikimedia.org).
Thanks to Baseball-Reference.com for attendances, baseball-reference.com/leagues/majors/2025-misc.
Thanks to Chris Creamer’s Sports Logos.net, for several (~17) of the cap logo images, sportslogos.net.
Thanks to the contributors at en.wikipedia.org, en.wikipedia.org/wiki/Major_League_Baseball#Current_teams.


.svg)
.svg)