NFL, AFC South – Map, with short league-history side-bar & titles list
Photo of Vince Lombardi Trophy from mlive.com.
…
…
Logo and helmet history of the 4 teams (Texans, Colts, Jaguars, Titans), with titles won and stadiums played in…
…
Houston Texans logo & helmet history (2002-13) – click on image below
Houston Texans logo & helmet history (2002-12)
Helmet illustration above from Gridiron Uniform Database. Photo of Houston Texans helmet from sportsblink.com. Illustration of Texans’ uniforms by JohnnySeoul at en.wikipedia.org.
Texans’ helmets at MG’s Helmets, mghelmets.com/texans.
[Note: for Houston Oilers - scroll down to the Tennessee Titans' section further down in this post.]
The Houston Texans’ franchise, which is the 32nd and newest franchise in the NFL, originally had been provisionally awarded to the city of Los Angeles, CA in March 1999, when the NFL gave the city of LA a 6-month deadline to get their plans together. But LA, at that point in time, could not provide either an ownership group or a viable stadium deal – whereas Houston had both in place for 2 years. So in October 1999, the NFL instead awarded the 32nd team to Houston, at the cost of $700 million. Entrepreneur Bob McNair headed the group in Houston, and the other major player besides the NFL franchise itself (which was to be named the Houston Texans) was the Houston Livestock Show and Rodeo (HLS&R). The stadium plan called for a venue to replace the Astrodome, but not have a fixed-roof like the Astrodome, but be a retractable-roof stadium. And have grass, not the accursed astroturf (note: the Astrodome originally was intended, circa 1965, to have grass for its playing surface, but it died for lack of sunlight, hence the invention of astroturf).
Houston Texans’ stadium
The Texans play at Reliant Stadium in Houston, which opened in 2002 and was the first venue in the NFL to have a retractable roof. The city of Houston and Reliant Stadium hosted Super Bowl XXXVIII (38) in February 2004 (won by the Giants over the Panthers).
The genius of the Houston stadium partnership which produced the 71,054-capacity Reliant Stadium was that the two primary tenants did not have configuration-issues, like all the attempts, during the era of multi-purpose stadium building in the USA in the 1960s and 1970s and 1980s, of placing an NFL team and a Major League Baseball team in the same stadium. City planners back then thought they were pretty smart, building stadiums for both their MLB and NFL teams. What they didn’t really look into was the fact that these stadiums were doomed to be lousy venues for both sports. It basically ruined it for both teams. And it really ruined it for the fans, because all of those stadiums like Veterans Stadium in Philadelphia or Shea Stadium in NYC or the Astrodome were horrible venues – they were all hideous-looking, dreary giant concrete doughnuts, with stands were they shouldn’t be for both sports. A baseball field has such a radically different set of dimensions than does a football field. A baseball stadium needs a space that is a wide diamond shape which must flare out even further in three directions to form a giant-pie-slice-shape for the outfield. A football stadium only needs a space that is basically a giant rectangle. And rodeo works just fine in a giant rectangle. The Houston Livestock Show and Rodeo occurs each mid-March for a 20-day spell. The problem, and it was a big one, was that the turf there was shoddily assembled and downright dangerous, thanks to the whole cattle/rodeo show. They had to re-assemble the turf each year because of the whole livestock thing. From sod which never grew together to form actual turf. And players actually wrecked their careers because of the dangerous seams in the sod. They would catch their cleats in the seams of the sod and severely injure themselves. One lawsuit is still pending. So the venue switched to artificial turf in 2015.
Colors and helmet logo of the Houston Texans
The Houston Texans wear navy blue, red, and white. Well, actually they wear “Deep Steel Blue”, “Battle Red”, and “Liberty White”. Whatever. The Texans’ logo is an abstract depiction of a bull’s head, with a star for an eye (a reference to the Lone Star State of Texas). The logo was designed by someone who had a hand in the NFL-shield-logo redesign and the Cardinals helmet-logo redesign, Mark Verlander.
The Houston Texans have never made a Super Bowl appearance [no Super Bowl appearances in 11 seasons up to 2012]. They are one of only 4 teams in the NFL to have never reached a Super Bowl final. The other teams in this dubious category are the Detroit Lions (no Super Bowl appearances in all possible seasons [47 seasons up to 2012]), the Cleveland Browns (no Super Bowl appearances in 44 seasons up to 2012), and the Jacksonville Jaguars (no Super Bowl appearances in 18 seasons up to 2012).
…
Indianapolis Colts logo & helmet history (1953-2013) – click on image below
Indianapolis Colts logo & helmet history (1953-2013)
Helmet illustrations above from Gridiron Uniform Database. Baltimore Colts 1954-55, 1956, 1957 helmet illustrations from sportslogos.net//Baltimore_Colts. Baltimore Colts 1954-photo of helmet & Colts’ players’ helmet from helmethut.com/Colts54. Photo of Baltimore Colts alternate logo patch from ioffer.com/c/Football-NFL-1019564?page=6. Baltimore Colts circa 1982 alternate logo from ioffer.com/c/Football-NFL-1019564?page=6. 30 years in Indianapolis jersey-patch-logo from, forums.colts.com/topic/18526-indianapolis-30th-season-logo. Photo of Indianapolis Colts’ helmet from americansportscollectibles.com. Illustration of Colts’ uniforms by JohnnySeoul at en.wikipedia.org.
Colts’ helmets at MG’s Helmets, mghelmets.com/colts.
1950: 3 teams from the AAFC join the NFL, including the original Baltimore Colts (I) (NFL, 1950/defunct)
In 1950, 3 teams from the rival-league the All-America Football Conference (1946-49) were allowed to join the NFL – the San Francisco 49ers (AAFC, 1946-49/NFL, 1950-2013), the Cleveland Browns (AAFC, 1946-49/NFL, 1950-1995; 1999-2013), and the Baltimore Colts (I) (AAFC, 1947-49/NFL, 1950/defunct). The first NFL franchise in Baltimore, Maryland was the green-and-silver Baltimore Colts of 1950 {Baltimore Colts 1950 NFL uniforms (gridiron-uniforms.com/1950)}, who had began life as the Miami Seahawks, the weakest franchise in the relatively-well-capitalized AAFC. In the original green-and-silver Colts’ last year in the AAFC, they went 1-11, with crowds in the high-teens to low-20,000-per-game range. The green-and-silver Colts were by far the weakest of the three AAFC teams that the NFL let in, and the New York Yankees of the AAFC and the Buffalo Bills of the AAFC both had stronger teams and way more ticket-paying fans. But both these teams were not let in, because , in the New York AAFC team’s case, the NFL didn’t want to bring in any teams into cities which already had an NFL franchise; while in the Buffalo AAFC team’s case, several NFL owners felt that Buffalo was too small and too cold for an NFL team (ignoring the fact that Green Bay is way smaller and way colder). In their first and only NFL season, the green-and-silver Colts went 1-11 for the second straight year, drew only marginally better than they had in their last 2 seasons in the AAFC, and went bust, with the NFL buying back the franchise in January 1951.
Two years previous, circa late 1948, a different and similarly struggling NFL franchise – the Boston Yanks – were transferred to the league, and the owner was (for tax purposes) given a new franchise, which was the ill-fated New York Bulldogs of the 1949 NFL. The Bulldogs changed their name to the New York Yanks in 1950, did poorly and failed to get good crowds, and folded after the following season of 1951 {New York Yanks 1951 NFL Uniforms (gridiron-uniforms.com). The league took the team back, and the following season used its roster (comprised of 12 players) to help fill up the roster of yet another soon-to-be-doomed franchise – the Dallas Texans of the 1952 NFL [not to be confused with the Dallas Texans of the 1960-62 AFL (present-day Kansas City Chiefs)].
The ill-fated Dallas Texans of the 1952 NFL – the precursor to the Baltimore Colts (II)
The Dallas Texans of the 1952 NFL wore dark-blue-and-white-with-silver-trim {1952 Dallas Texans uniforms (gridiron-uniforms.com)}, and played only 4 games at the then-70,000-capacity Cotton Bowl in Dallas, Texas. The Dallas Texans of the 1952 NFL drew really poorly despite the fact that the state of Texas has, to this day, always otherwise supported, and supported very well, gridiron football teams. Why? Because the 1952 Dallas Texans were really bad, combined with another factor which kept people from attending their games – out-and-out racism within the Dallas community. Here is an excerpt from the Wikipedia page entitled ‘Cowboys – Steelers rivalry‘…”…The NFL owners voted 10-1 to award the assets of the Yanks to the Dallas group led by Giles Miller as opposed to the Baltimore group, which became the Dallas Texans. The lone holdout was Steelers founder and owner Art Rooney. Rooney, an Irish Catholic, was more tolerable to African Americans than the other owners (most of whom were Protestant and had their own discrimination towards Catholics) and was concerned about the racism that existed in the Southern United States at the time and the subsequent civil rights movement that would take place later in the decade. Rooney’s assumptions would be later proven correct: while the Texans struggled on the field, it also struggled at the gate partly because two of the team’s best players, George Taliaferro and Buddy Young, were both black, which made fans in Texas automatically turn away from the team simply because of prejudice.”…{end of excerpt}.
The 1952 Dallas Texans’ opening day crowd was only 17,000. That was their best attendance, and their low came in what would be the team’s last game in Dallas, versus the LA Rams (who had several black players) on Nov. 11, 1952, when they drew just 10,000. The league took the team over and had the Texans train in Hershey, PA, while the team’s last 2 home games were played in other locations – one at the Rubber Bowl in Akron, OH (where very few people attended, and the 1952 Texans got their sole victory over the Bears 24-23, because George Halas didn’t put his Bears starting team on until the 2nd half), and one at the Detroit Lions’ Briggs Stadium [Tiger Stadium] to end the season.
From the Pro Football Researchers’ site The Coffin Corner, here is an article about the Dallas Texans of 1952, ‘A DISGRACE‘ (from 1982, by Stan Grosshandler at profootballresearchers.org).
1953: the Baltimore Colts (II) (NFL, 1953-83) join the NFL as an expansion team. 31 years later, the Colts move, in the dead of night, to Indianapolis, in March 1984
So once again, for the fourth time in 10 years, the league had taken over yet another failed NFL franchise during the post-War era. The Dallas Texans failing in 1952 was the fourth failed franchise in the NFL in 9 years, after the Brooklyn football Dodgers failed in 1944, and after the original-green-and-silver Baltimore Colts failed in 1950, and after the New York Yanks failed in 1951. The following year, the NFL transferred the 1952 Dallas Texans’ roster – as well as its colors of dark-blue-and-white – to the second new NFL franchise in Baltimore, MD in 4 years – the Baltimore Colts (II) (NFL, 1953-1983/Indianapolis Colts, 1984-2013). The league does not acknowledge the link between the 1952 Dallas Texans and the 1953-to-present-day Colts’ franchise, despite the fact that both teams had the same colors of dark-blue-and-white and despite the fact that 12 players went from playing on the 1952 Dallas Texans to playing on the 1953 Baltimore Colts. Players like Art Donovan and Gino Marchetti (both Pro Football Hall of Famers), and George Taliaferro and Buddy Young. What’s more, all those 4 players also had played on the 1951 New York Yanks (two franchise-shifts earlier) as well. Oh, and the New York Yanks also wore dark blue and white.
The second NFL team in Baltimore was the blue-and-white Baltimore Colts (II) (NFL, 1953-83). The Baltimore Colts were a very solid team in the NFL for a 15-year span when, coached by Weeb Ewbank they won NFL titles in 1958 and 1959 (led by QB Johnny Unitas), then, for the 1970 NFL season, coached by Don McCafferty, the Colts were at the top of the football world in January 1971 when they won Super Bowl V (#5) over the Dallas Cowboys with a last-minute FG by kicker Jim O’Brien. Then the Baltimore Colts entered a protracted period of eventual decline before their owner, Robert Irsay, snuck his franchise out of town at 3 in the morning one cold March night in 1984, and covertly moved the team with a fleet of moving vans to Indianapolis, IN as the Indianapolis Colts (NFL, 1984-2013). Irsay was forced to do this because the Maryland legislature intended to seize the team. You see, the Colts’ venue, Memorial Stadium (which they shared with the MLB team the Baltimore Orioles), was in a crumbling state of disrepair, and Irsay was having a very hard time coming to a stadium agreement with Baltimore and with Maryland state officials. By this time (circa 1982-83) Indianapolis, Indiana was building a stadium – the Hoosier Dome – to attract an NFL team, and Irsay had visited the construction site in Indianapolis in February 1984. Here is what happened next, via an excerpt from the Wikipedia page entitled ‘Baltimore Colts relocation to Indianapolis‘…”Meanwhile in Baltimore, the situation worsened and the Maryland State Legislature inserted itself into the dispute — a move that would eventually force Irsay’s hand and result in the Colts’ final decision to depart. On March 27, 1984, the Maryland Senate passed legislation giving the city of Baltimore the right to seize ownership of the Colts by eminent domain. (An idea first floated in a memo written by Baltimore mayoral aide Mark Wasserman). Robert Irsay said that his move was “a direct result” of the eminent domain bill. [Colts' legal counsel Michael] Chernoff would say of the move by the Maryland legislature: “They not only threw down the gauntlet, but they put a gun to his head and cocked it and asked, ‘Want to see if it’s loaded?’ They forced him to make a decision that day.”…{end of excerpt}.
When Irsay found out on March 28th, 1984 that Baltimore now had the legal right to seize ownership of the Colts by eminent domain, Irsay contacted Indianapolis and 15 Mayflower moving vans were sent to Baltimore from the company’s headquarters in Indianapolis. Once they were loaded with every tackling dummy, paperclip, uniform, cleat and jock strap the Colts owned, all fifteen moving trucks took a different route to Indianapolis from Baltimore, as a diversion tactic, so the Maryland State Police could not enforce the eminent domain law that had just been signed. Once a truck got to Indiana, the Indiana State Police met each moving van and escorted it to Indianapolis. Thus went the Baltimore Colts to history’s dustbin. The bitter aftermath for Baltimore football fans can be told through this excerpt from ‘Indianapolis Colts‘ at en.wikipedia.org …”The move triggered a flurry of legal activity that ended when representatives of the city of Baltimore and the Colts organization reached a settlement in March 1986 in which all lawsuits regarding the relocation were dismissed, and the Colts agreed to endorse a new NFL team for Baltimore. Nonetheless, many of the prominent old-time Colts, many of whom had settled in the Baltimore area, were bitter and chose to cut all ties to the relocated Colts team. Most notable and vocal among them was Johnny Unitas, who recognized himself solely as a player for the Baltimore Colts until the day he died, with his estate defending that stand to this day.”…{end of excerpt}. There are very, very few Baltimore Colts fans in Maryland who remained Colts fans after the team moved to Indianapolis. So what did Baltimore do? The city schemed for another NFL team for over a dozen years until they found a potential candidate – and the city of Baltimore lured the Cleveland Browns (I) to move to Maryland and become the Baltimore Ravens (NFL, 1996-2013). The city of Baltimore might have lost the Colts logo, the Colts colors, and their Colts’ history, but the city of Baltimore now has 2 more Super Bowl titles to boast of. The city of Cleveland, once the NFL gave them a new Browns team in 1999, got back their much-beloved blank-orange helmets and their Browns’ history…and zero trips to the Super Bowl.
Colts’ Stadium in Baltimore
Memorial Stadium (1921-49 [first version]/ 1949-2002 [second version] was actually 2 different stadiums on the same site in a residential neighborhood in Baltimore called Venable Park. The original, built in 1921, was known as Baltimore Stadium, also known as Municipal Stadium, and also known as Venable Stadium. It was a horseshoe-shaped stadium (open-end-of-horseshoe facing south), with an earthen-mound exterior (like the Yale Bowl), and could seat 31,000. It hosted various college football games, and occasionally a big college game like the Army-Navy game. Midway through the summer of 1944, the minor league ball club the Baltimore Orioles of the International League had become homeless when their ballpark, Oriole Park, was destroyed by fire. The ball club began playing at Baltimore Municipal Stadium, went on a huge winning run, made it to the playoffs and won the 1944 Junior World Series over Louisville. The minor-league Baltimore Orioles at Municipal Stadium in late 1944 started drawing huge crowds, and their playoff games’ attendances was even higher than the attendances at the 1944 Major League Baseball World Series that October. The fact that Baltimore could produce such huge crowds – for minor league baseball, no less – caught the eye of the people running both Major League Baseball and the NFL, and Baltimore was now beginning to be considered a viable option for pro sports teams seeking to relocate. And in 1947, Baltimore got its first major league team since 1902 (when the Baltimore Orioles (II) of the American League had moved to New York City, NY to become the New York Highlanders [who later became the NY Yankees]). The problem was, that ‘major league team’ Baltimore got in 1947 was the weakest team in a rival-league to the NFL – the AAFC’s green-and-silver Baltimore Colts.
Below, photo of Municipal Stadium in Baltimore in 1947 / photo of the same venue as Memorial Stadium, during its expansion in 1953 [with the upper deck constructed).
Photo and Image credits above -
gridiron-uniforms.com/defunct.html. oldestlivingprofootball.com/apps/photos/photo?photoid=177342265. oldestlivingprofootball.com/apps/photos/photo?photoid=177342266. Helmets from gridiron-uniforms.com.
As the AAFC vied with the NFL through the late 1940s, and the green-and-silver Baltimore Colts (I) continued to play at Municipal Stadium, the city of Baltimore decided to completely rebuild their venue, starting in 1949. Memorial Stadium was completed the next year, 1950, and originally seated 31,000. Turning its orientation 180 degrees, the new stadium was a single, horseshoe-shaped deck, with the open end facing north, [a shape and an orientation just like what became the second-incarnation of the Colts' horseshoe logo eventually (see Colts' logos section further below)]. With the NFL absorbing 3 AAFC teams after the 1949 season, the green-helmeted-Colts (I), now in the NFL for their first and only NFL season, began playing at the newly re-built Memorial Stadium in 1950. But then the original Colts went bust a few months later. When the NFL gave Baltimore another try 3 seasons later, in 1953, the Colts (II) became the second pro team to play at Memorial Stadium. One year later, the city of Baltimore hit paydirt again when they lured one of the weakest franchises in baseball, the St. Louis Browns, east, to become the Baltimore Orioles (III) in 1954. With that baseball-franchise-move secured, the city of Baltimore expanded the venue, and an upper deck (roofless), was added (and completed the next year in 1954), making the capacity 47,800. By this time the blue-and-white expansion-team Baltimore Colts (II), coached by Weeb Ewbank, had had back-to-back 3-7 seasons in their first 2 seasons in 1953 and ’54. But after 2 more losing seasons, they had a winning record for the first time in 1957 when the Colts first began using Johnny Unitas as their starting QB.
Johnny Unitas – the first legendary QB of the Colts
Johnny Unitas, the son of Lithuanian immigrants, was a Pittsburgh-born graduate of Louisville University. At college, he played the dual role of QB and Safety for the Redbirds. Unitas had been a 9th round selection by his hometown team, the Pittsburgh Steelers, in 1955. But Unitas was cut by the Steelers in the ’55 preseason, with Steelers’ coach Walt Kiesling under the impression that Unitas was not smart enough to run an NFL offense, even though Kiesling (duh) never even let Unitas take one snap during the entire preseason. So Unitas worked in construction jobs in Pittsburgh in the latter half of 1955, to support his family, and he played semi-pro football for 6 bucks a game on the weekends.
In the following year of 1956, Unitas got a second chance, when Weeb Ewbank and the Baltimore Colts signed him, after a successful tryout. A few games into the season, backup-QB Unitas got his shot, when starting QB George Shaw got injured in the 4th game; the Colts finished 5-7. The next year, 1957, with Unitas the starting QB, the Colts went 7-5, and attendance for the Colts increased by 6.9 K, to 46 thousand per game. In 1958, the fans continued to flock to Baltimore’s Memorial Stadium, and the Colts saw an eye-popping 16.9-K-increase in crowd-size, to 53.6 K (93-percent-capacity), at the 57.5-K-venue [which they shared with MLB's Baltimore Orioles]. Baltimore had the third-best attendance in the NFL in 1958. In 1958, the Colts went 9-3, with Unitas leading the league in passing yardage and passing TDs, and with HB Lenny Moore gaining 1,536 yards from scrimmage, and WR Raymond Berry gaining 724 yards receiving. The Colts won the NFL Western Division by a game over the 8-4 Chicago Bears and the 8-4 LA Rams, meaning they would face the Eastern Division champs, the 9-3 New York Giants, who featured a tough defense led by LB Sam Hff, and a potent offense featuring QB Charlie Conerly, end Frank Gifford, and flanker Kyle Rote. The Giants had had to play an extra game – a tiebreaker – versus the Cleveland Browns, and New York had beaten Cleveland 10-0 a week before the final. Because of the sheer excitement the game caused, and because it was the first NFL championship game to be broadcast nationally on television (on NBC to an estimated audience of 10.8 million homes), and because of its pivotal timing in the late 1950s as the medium of television began to broadcast pro sports all across the country, the Colts versus the Giants in the 1958 NFL Championship became known as The Greatest Game Ever Played.
From youtube.com, uploaded by vslice02, ‘The Greatest Game Ever: 1958 NFL Championship – Sportscentury‘ [5:33 video] (youtube.com).
Photo and Image credits above -
Illustrations of Colts & Giants 1958 helmets from gridiron-uniforms.com.
Photo of Unitas passing, baltimorepostexaminer.com/baltimore-colts-vs-the-new-york-giants-my-memory-of-the-greatest-game.
Photo of Giants D about to stop Ameche on 4th-and-goal, from sportsblogmovement.wordpress.com/tales-of-depression-and-sorrow-the-new-york-giants
Ameche’s TD, photo from nytstore.com/alan-ameche-1958-nfl-championship.
The 1958 NFL title game was played at Yankee Stadium, in The Bronx, NY, to a gigantic crowd of 64,185. It was the first NFL game, play-off or otherwise, that went to sudden-death overtime, and it featured two hard-nosed teams with offenses that had the capability to move the ball down the field with lightning-quick efficiency. The Colts were coached by Weeb Ewbank, who had got his pro coaching start under Paul Brown at Cleveland. The Giants were coached by Arkansas graduate Jim Lee Howell, who coached the Giants from 1954 to 1960. Howell’s two main assistant coaches are both in the Pro Footballl Hall of Fame – the Giants’ defensive coach in 1958 was future Cowboys’ coach Tom Landry (whom Howell had converted from a Giants’ LB to defensive coordinator 2 years previous in 1956); the Giants’ offensive coach in 1958 was future Packers’ coach and football demi-god Vince Lombardi (whom Howell had hired from West Point, where Lombardi was Army’s offensive line coach 4 years previous in 1954).
The Giants/Colts 1958 title game had multiple big plays, swift scoring drives, and changes in momentum – the biggest when, in the 3rd quarter with the Colts leading 14-3, the Giants stopped Baltimore on a fourth-and-goal-to-go on the 1 yard-line, for a 4-yard-loss (see color photo above, where Unitas is about to hand off to Alan Ameche for that 4-yard-loss). Then the Giants went 95 yards for a TD in 4 plays. That drive was highlighted by a 86-yard pass play from deep within the Giants’ own territory: QB Charlie Conerly threw to WR Kyle Rote downfield left-to-right across the middle. Rote broke a tackle at mid-field, but then he fumbled when hit from behind at the Colts’ 25…Giants RB Alex Webster, who was trailing the play, recovered the fumble and ran it all the way to the 1-yard line. RB Mel Triplett then scored on a 1-yard TD run, and the Giants were back in it, now behind by only 4 points, at 14-10. The Giants then went ahead 17-14 early in the 4th quarter – Conerly’s 46-yard completion to TE Bob Schnelker set up his 15-yard TD pass to Frank Gifford. In the dying minutes of the 4th quarter, the Colts took over with 1:58 to go, at their own 14-yard line (after a Giants punt). Unitas then put together one of the most famous drives in football history. After two incomplete passes, Unitas made a clutch 11-yard completion to Lenny Moore on third down. After one more incompletion, he threw three straight passes to Raymond Berry, moving the ball 62 yards, to the Giants’ 13-yard line. A 20-yard FG by Steve Myhra with 7 seconds left sent the game into sudden-death overtime — the first overtime game in NFL history. In OT, the Giants won the toss but failed in their first possession. Then Unitas and Baltimore drove 80 yards on 13 plays on the tired New York defense, and the Colts scored on a 1 yard TD by Alan Ameche, to win the game 23-17.
The broadcast of the game by the NBC television network is credited with growing, almost overnight, the fan interest in the NFL. The 1958 NFL Championship Game marked the start of the popularity-surge for the NFL… a popularity-surge that has not abated to this day. As pro football historian Bob Carroll notes in his book When the Grass Was Real …’The next morning…for the first time in history, the National Football League was the number-one topic at watercoolers from sea to shining sea. Among the oohs over Johnny Unitas’s passes and the ahhs over Sam Huff’s tackles came many plaintive wonderings why “our town” didn’t have its own pro football team.’…{end of excerpt from page 12 of When the Grass Was Real, by Bob Carroll, published in 1993 by Simon & Schuster, available at amazon.com here}.
The 6-year-old Baltimore Colts were pro football champions. The following season, in 1959, Unitas and his two main targets – WR Lenny Moore and WR Raymond Berry – led the Colts as part of the league’s top-ranked offense, and to a second-straight championship, again beating the Giants, this time by the bit-more-lopsided score of 31-16. This game was played at Baltimore’s Memorial Stadium on Dec. 27, 1959, before a massive overflow crowd of 57,545 (which was about 10,000 more than official capacity of Memorial Stadium back then). The Colts scored 24 unanswered points in the 4th quarter. Unitas was voted the 1959 NFL MVP.
Unitas would go on leading the Colts all through the next decade and up to 1972, but his greatness was already established after those back-to-back NFL titles he helped the Colts win in 1958 and ’59. As his longtime Colts’ teammate Raymond Berry noted, what made Unitas great was ‘his uncanny instinct for calling the right play at the right time, his icy composure under fire, his fierce competitiveness, and his utter disregard for his own safety.’ {That quote is from this article, ‘Unitas surprised them all‘, by Bob Carter at espn.go.com/sportscentury.}.
Photo credit above – spokeo.com/Johnny+Unitas+1/Sep+19+1965+Other+Photos
The Colts remained very competitive all through the 1960s, but only won one more NFL Championship – in 1968, when a young Don Shula was coach. But that 1968 Colts team lost, famously (or infamously) to the AFL’s New York Jets in Super Bowl III (in January 1969). The Jets, led by QB Joe Namath, were huge underdogs who just happened to be coached by none other Weeb Ewbank (who had been fired as coach of the Colts in 1962).
When the AFL/NFL merger came about two seasons later (prior to the 1970 season), the Colts were one of 3 NFL teams (the other two being the Browns and the Steelers), that the league had change over to join the 10 AFL teams in the new American Football Conference, in order to balance both conferences (AFC & NFC) at 13 teams. That same season, the Colts were back in the Super Bowl, now representing the AFC. The 1970 Colts were an unspectacular but well-balanced veteran team, led by a 37-year Johnny Unitas, with the team’s main strength in defense. The 1970 Colts’ defense was spearheaded by Pro Bowl DT Bubba Smith. Behind him were 2 solid linebackers: Pro Bowler Mike Curtis, who had 5 interceptions, and hard-tackler-pass-blocker-and-kick-blocker Ted Hendricks (a Pro Football Hall of Famer). In the secondary, Pro Bowl safety Jerry Logan had 6 interceptions for 92 return yards and 2 TDs that season, and safety Rick Volk had 4 interceptions for 61 return yards.
Super Bowl 5 is not is not really talked about much, or remembered too fondly these days because of the large amount of bad plays in the game. Later on it was often referred to as the ‘Blunder Bowl’ or the ‘Stupor Bowl’ because of all the poor play, penalties, turnovers, and refereeing mistakes. The Colts and the Cowboys committed a Super Bowl record 11 combined turnovers in the game, and the Colts’ 7 turnovers are to this day the most ever given up by the winning team in a Super Bowl. It was the first ever-Super Bowl game played on artificial turf, at the Orange Bowl in Miami (on January 17, 1971). Attendance was 79,204.
The uniforms worn in Super Bowl V are an interesting side note, because the Cowboys (who have always worn white jerseys at home since 1964) were forced to wear their unlucky old dark-royal-blue jerseys in Super Bowl V. {See this, ‘REMEMBER THE BLUE JERSEY JINX?‘, by Rob Vetrano at lonestarstruck.com).
Here is what it says about that in the Wikipedia page ‘Super Bowl V‘, …{excerpt} ‘As the designated home team, Dallas was forced to wear its blue jerseys for the Super Bowl under rules in place at the time, which did not allow the home team its choice of jersey color, unlike the regular season and playoff games leading up to the Super Bowl. Dallas had not worn its blue jerseys at home since 1964, as Cowboys general manager Tex Schramm opted to have the team wear white at home in order to present fans with a consistent look. … The designated home team was first allowed its choice of jersey color for Super Bowl XIII, allowing the Cowboys to wear white vs. the Pittsburgh Steelers.’…{end of excerpt}.
Unitas started, but sustained a rib injury early in the second quarter, and back-up QB Earl Morrall stepped in. The Colts beat the Dallas Cowboys 16-13 on a last-minute FG by rookie placekicker Jim O’Brien. Cowboys linebacker Chuck Howley was given the MVP award – the only time a losing Super Bowl team had one of its players win the Super Bowl MVP. Howley said the award was meaningless to him.
Colts in the late 1970s and early 1980s
They sucked. In each of the Colts’ last 6 seasons in Baltimore, the team posted losing records including a 2-14 record in 1981, and an 0-8-1 record in the strike-shortened season of 1982. They were so bad that star Stanford University QB John Elway refused to sign with them after the Colts drafted him #1 in 1983. Elway could pull this off because he threatened to simply play pro baseball instead. So Elway, an eventual Hall of Fame QB, went to the Denver Broncos instead.
…
Colts’ stadiums in Indianapolis
The Colts – now named the Indianapolis Colts – moved into the brand-new Hoosier Dome in late August, 1984, four months after their clandestine departure from Baltimore. To say the Indianapolis Colts had a large fan base upon arriving in the Hoosier State would be an understatement. The public demand for tickets was so overwhelming that over 143,000 requests for Colts season tickets were made in just 2 weeks.
The Hoosier Dome was an air-pressure-supported dome stadium, like the Carrier Dome in Syracuse. The Hoosier Dome – primarily built to attract an NFL franchise – was part of the Indiana Convention Center, with the costs split between private and public money. The Hoosier Dome had an original capacity of 60 K, and its final capacity circa 2006-08 was 55.5 K. It had astroturf until 2004, then the field was laid with fieldturf. It was named the Hoosier Dome for eleven years, then naming-rights were sold and it became the RCA Dome (from 1994 up until the venue was demolished in 2008). The Colts played at the venue for 24 seasons (1984–2007). It was sort of bland and utilitarian, but it had served its purpose – namely, to attract, catch and hold an NFL team.
However, the Colts were a basement-dweller when they arrived in Indianapolis, and they remained so for 9 out of their first 10 seasons in Indianapolis. By the mid-1990s, though, the Colts, with RB Marshall Faulk, had turned into a playoff contender, and made it to the 1995 AFC championship game (where they lost to the Steelers). Robert Irsay died in January 1997 after years of declining health, and his son Jim Irsay stepped into the role of principal owner. Jim Irsay made a brilliant move right off the bat by hiring Bill Polian as the general manager. Polian was the architect behind the early 1990s Buffalo Bills (3 consecutive Super Bowl appearances during his tenure there), and Polian also built the expansion Carolina Panthers team (which had made it to the NFC championship game in their second season). The Colts would have the number 1 overall pick for 1998, and the Colts picked QB Peyton Manning (see 2 paragraphs below).
In 2008, the Colts moved in to another multi-purpose stadium in downtown Indianapolis, Lucas Oil Stadium, which also has fieldturf, and is also roofed, but it is a retractable roof. It is the only retractable roof in the US with two moving panels that meet in a peak above the center of the stadium. The structure is quite a step up from the concrete-and-teflon Hoosier Dome. Lucas Oil Stadium, at 62,421 seat-capacity, holds about 7 K more capacity than the Hoosier Dome had in its latter years. The stadiums’s exterior is gabled and faced with a reddish-brown brick, and is trimmed with Indiana Limestone. The venue hosted Super Bowl XLVI (46), which was a thrilling encounter between the NY Giants and the NE Patriots, won by the Giants 21-17. Like when Jacksonville, FL hosted the Super Bowl, Indianapolis did not have enough hotel room occupancy, so many attendees ended up avoiding the price-gouging by booking rooms in Chicago and then driving or taking buses down to Indy (180 miles away).
Peyton Manning – the second legendary QB of the Colts
Peyton Manning is the son of former Ole Miss and New Orleans Saints QB Archie Manning (and an elder brother of New York Giants QB Eli Manning). Peyton Manning graduated from Tennessee in 1997, was the #1 draft pick by the Colts in 1998 – and immediately stepped into the starting QB role. The Colts went 3-13 in 1998 in Manning’s rookie season. The following year, 1999, the Colts won ten more games and finished 13-3, but lost to the Titans in the 2nd round of the playoffs. Losing in the playoffs became a recurring nightmare for the high-scoring-but-defensively-porous Colts, as they also lost in the playoffs in 2000, in 2002, in 2003 (losing in the conference final to the Patriots), in 2004 (losing in the 2nd round again to the Patriots), and in 2005 (losing in the 2nd round to the Steelers). But in 2006, with total yardage leader Manning calling the plays and running their hurry-up offense, and with wide receivers Marvin Harrison and Reggie Wayne both gaining over 1,300 yards, Tony Dungy’s Colts finally made it to the Super Bowl. Super Bowl XLI (41) pitted the Colts (12-4) versus the Bears (13-3). It was on February 4, 2007, at Dolphin Stadium in Miami Gardens, Florida, and had an attendance of 74,512. It was the first Super Bowl played under rainy conditions. Indianapolis overcame a 14–6 1st quarter deficit to outscore Chicago 23–3 in the last 3 quarters. Peyton Manning completed 25 of 38 passes for 247 yards, with one TD pass and one interception. The Colts won 29–17, and Manning was voted Super Bowl MVP.
From USA Today, from Sept. 13, 2006, by Jim Corbett, ‘Gone in 40 seconds: Peyton Manning’s presnap routine‘ (usatoday30.usatoday.com).
Photo credit above -
usatoday.com.
Logos and helmets of the Colts
The first Baltimore Colts (the green-and-silver Colts that played 3 seasons in the AAFC, one season in the NFL, and then folded after the 1950 season), were named in honor of the horse racing industry in the state of Maryland and for the Preakness Stakes, which is one of the 3 Triple Crown thoroughbred horse races that occur each year (the Preakness Stakes is held in Baltimore at Pimlico Racetrack each May). The original Colts’ logo was a green colt with a football between its front legs leaping over an-H-shaped old-style goalpost {here is the 1950 Colts’ logo}. The second incarnation of the Colts in 1953 kept that logo, but in blue of course [the 1953 expansion Colts were named after the failed 1950 Colts, but there is no franchise-link other than the name and the aforementioned early colt-leaping-over-goalpost logo]. The 1953 expansion Colts wore, initially, a white helmet with a narrow dark-blue center stripe. They also wore a very bizarre stripe-detail for a few games in their first season, which you can see if you scroll back to the Colts’ helmet & logo history chart above, or if you click to this page at Gridiron Uniforms Database, {here (Baltimore Colts 1953 [uniforms])}. Two perpendicular blue stripes sort of made a cross at the top of the helmet (it was kind of a Phillips-screwdriver-like shape). As you might imagine, that odd design was soon scrapped. The Colts also wore plain dark blue helmets for a few games in their first year in ’53. Late the following season, 1954, the Colts’ second year, the Colts unveiled their soon-to-famous horseshoe logo. But it was a small white horseshoe on a dark-blue helmet, and the horseshoe logos were not in the center of each side of the helmet, but were, again bizarrely, at the back of the helmet behind the ear-holes and on either side of the center-stripe (see Colts’ 1954-55 helmet design below). The following year, 1955, the Colts again wore the blue-helmet-with-hidden-horseshoe. The following year, 1956, the Colts reversed the colors, so now the helmet was white and the horseshoe was blue. But the horseshoe, cryptically, still remained hidden on the back of the helmet. It was like the team was hiding their logo, afraid to show it off. Finally, in 1957 (the first year that Johnny Unitas was the starting QB, and the first year Baltimore had a winning record), the Colts unveiled their now-iconic white helmet with large blue horseshoes. Also in 1957, the Colts introduced their dual-shoulder-stripe look – also a look they have worn to this day – with the two arcing bands of the shoulder-stripes mirroring the horseshoe-logo’s arced shape. The story goes that the horseshoe’s open end is pointed up, so the good luck won’t drain out of the horseshoe. The Colts have never changed their logo or their helmet-design since, or the basic design of their jerseys – only slightly changing, three times, their shade of blue (there have been 4 different Colts’ blue through the years/ see second illustration below). And why should they mess with something so simple and direct? Sometimes the most beautiful and powerful logos are the simplest.
Below: the first horseshoe logo on a Colts helmet (1954)…
Photo credits above – helmethut.com.
Click on image below (the 4 shades of blue the Colts have worn)…
Colts’ blue: the 4 different shades of blue the Colts have worn (1953-2013)
Baltimore Colts: 1 Super Bowl title (1970).
Indianapolis Colts: 1 Super Bowl title (2006).
The Colts franchise is 2-2 in Super Bowl appearances -
In the 1968 season, the Baltimore Colts lost Super Bowl III (3) to the New York Jets by the score of 16-7.
In the 1970 season, the Baltimore Colts won Super Bowl V (5) over the Dallas Cowboys by the score of 16-13.
In the 2006 season, the Indianapolis Colts won Super Bowl XLI (41) over the Chicago Bears by the score of 29-17.
In the 2009 season, the Indianapolis Colts lost Super Bowl XLIV (44) to the New Orleans Saints by the score of 31-17.
…
Jacksonville Jaguars logo & helmet history (1995-2013) – click on image below
Jacksonville Jaguars logo & helmet history (1995-2012)
Helmet illustrations above from Gridiron Uniform Database. Photos of Jaguars’ dual-tone black-to-real helmet [2009-12] from bleacherreport.com/Gallery-top-NFL-helmets-rated. Illustration of Jaguars’ 2013 uniforms by Fma12 at http://en.wikipedia.org/wiki/File:Jaguars13_uniforms.png. Photo of Jaguars’ 2013 front-jersey patch logo from nikeinc.com. Photo of Jaguars’ 2013 spray-paint-accident helmet [gold-to-black color blend], from nationalsportsmemorabilia.com.
Jaguars’ helmets at MG’s Helmets, mghelmets.com/jaguars.
Jacksonville, Florida never has had a Division I college football team. This despite being situated right in the midst of the most fervent college football region in the country (the Deep South/South Atlantic Seaboard/North Florida region). What made it worse for Jacksonville football fans was the fact that their city was larger than almost all of the towns and cities that did have SEC or ACC or SWC football teams. So Jacksonville’s city leaders had been trying to get an NFL team since the 1960s. Jacksonville’s Gator Bowl Stadium had hosted the AFL All Star Game in 1967 and ’68, but after the AFL/NFL merger in 1970, Jacksonville was shut out. The best that Jacksonville could do in the 1970s and 1980s was have teams in failed rival-leagues – in the World Football League (WFL) with the Jacksonville Sharks (1974/folded before season ended); then the next year again in the WFL with the Jacksonville Express (1975/ folded along with the entire league in October 1975); and then a decade later in the United States Football League (USFL), with the Jacksonville Bulls (1984-85).
From ESPN, from Dec. 3, 2009, by John Zoni, ‘The apex of the World Football League‘ (sports.espn.go.com).
The ill-fated Jacksonville Sharks (1974/ folded mid-season) and the ill-fated Jacksonville Express (1975/ folded along with the entire WFL in October 1975)

Photo and Image credits above –
Photo of 1974 WFL game program from funwhileitlasted.net/2013/06/01/history-buffs-unveil-1974-world-football-league-trading-card-series.
Photo of Jacksonville Sharks’ pennant from ebay.com. Photo of WFL ball from sports.espn.go.com/espn/page2/story?page=zoni/091203. Photo of first Sharks’ WFL game from wfl.charlottehornetswfl.com/season_book_1974. Photo of 1975 Jacksonville Express media guide from funwhileitlasted.net/1975-jacksonville-express. Photo of Express button-pin from stores.ebay.com. Photo of 1975 Express helmet from helmethut.com/WFL/WFLExpress. Logos from sportslogos.net/WFL/logos.
…
The Jacksonville Bulls of the United States Football League (USFL) (1984 & 1985) [2 full seasons]
The Jacksonville Bulls played in the final two seasons of the USFL, in 1984 and 1985. In 1984, they went 6-12, averaging 46,730 per game at the Gator Bowl – the best attendance in the USFL that season. The Bulls had the USFL single game attendance record – 73,227 for their game at the 80,000-capacity Gator Bowl versus the New York Generals, on March 4, 1984 [the USFL played a spring/early summer schedule]. In 1985, with the addition of 1983 Heisman Trophy winner Mike Rozier (who graduated from Nebraska, had played for the USFL’s Pittsburgh Maulers in 1984, and later played as a 2-time Pro Bowler for the Houston Oilers and the Atlanta Falcons), the Bulls improved to 9-9 in the final year of the USFL, and the Jacksonville Bulls drew well again at 44,325 per game. The USFL played 3 full seasons (1983-85), but closed up shop in early 1986, when their antitrust lawsuit against the NFL resulted in them winning the suit but only being awarded the sum of $3. {‘USFL‘ page at en.wikipedia.org)}. The Jacksonville Bulls’ large support made a strong case for Jacksonville getting an NFL expansion team. That happened 7-and-a-half years later, when, in November 1993, a month after awarding Charlotte, North Carolina the 29th NFL franchise (Carolina Panthers, NFL 1995-2013), the league awarded Jacksonville, Florida the 30th NFL franchise (Jacksonville Jaguars, NFL 1995-2013).
From Our Sports Central site, ‘Jacksonville Bulls‘ (oursportscentral.com).
Photo and Image credits above – Bulls’ wordmark logo (helmet logo), sportslogos.net/teams/United_States_Football_League. Photo of RB Mike Rozier w/ Bulls from fs64sports.blogspot.com/1985-bulls-score-two-tds-in-4th-quarter. Photo of Bulls’ helmet-logo-patch from ebay.com. Photo of back of Bulls’ helmet from boards.sportslogos.net/topic/80445-the-usfl-with-davidsons-revo-template/page-2. Photo of Bulls running out to a crowd of 72,000 at the Gator Bowl [March, 1984] from oursportscentral.com/usfl/bulls.
The biggest problem with Jacksonville getting an NFL team was the size of the city. It was big in one respect – area. Jacksonville’s city-limits sprawl to 747 square miles, which is more than twice the area of the most-populous city in the US, New York City (NYC is 302.6 square miles large by area). Jacksonville, whose city-population is around 836,000 {2012 estimate}, is the largest city by area in the country (except for 4 municipalities in Alaska). Jacksonville might be the 12th-largest city when measured by population within-city-limits, but it is the 40th largest metropolitan area in the country. That giant area that is officially the city limits of Jacksonville bloats their city-population figure. And as most everyone knows (but not this guy), it is a city’s metro-area population, and not a city’s city-population, that counts when you are talking about whether a city can support a major league team. Jacksonville’s metro-area population is 1.3 million {see this, ‘List of Metropolitan Statistical Areas‘. As well as being not that large, Jacksonville’s metropolitan-area is pretty thinly populated, too, and of all the major league cities in America (ie, cities with an NFL, MLB, NBA, and/or an NHL team), only Oklahoma City has a smaller population-density. Of the 43 American cities with a major league team, 7 are smaller in metro-area population than Jacksonville. Green Bay, Salt Lake City, Buffalo, Raleigh, New Orleans, Oklahoma City, and Memphis have smaller metro-area populations than Jacksonville.
So let’s look at the 3 NFL teams from cities with a smaller metro-area population than Jacksonville – Green Bay, Buffalo, and New Orleans. Green Bay, Wisconsin, with a metro-area population of around 311,000, gets a lifetime pass on this. The beloved Green Bay Packers are the last of the small-market teams that comprised much of the early NFL. The Packers have fans everywhere, and Green Bay sells out every game (and besides, it has Milwaukee, Wisconsin in its market). New Orleans, currently the 47th-largest city in the US by metro-area population, was about the 15th-largest city in the country when the NFL made the Saints the 16th NFL franchise in 1966, and besides, despite the drastic de-populating of the New Orleans area over the last couple of decades, the Saints still draw very well (at 99.9 percent-capacity last year, averaging 72,888 per game in one of the largest venues in the league, the Superdome). Buffalo, currently the 49th-largest metro-area in the USA, is the one NFL team that on the face of it, one could compare to Jacksonville in terms of barely-enough-population-for-an-NFL-team. But unlike Jacksonville, Buffalo has one medium-sized city 60 miles to the east (Rochester, NY, which is the 51st-largest metro-area in the US with about one million in its metro-area), another medium-sized city an hours’ drive to the north (Hamilton, Ontario, Canada, which has over a million in its metro-area), and a giant city about 2 hours’ drive to the north (Toronto, Ontario, Canada, which has over 7 million in its metro-area). Jacksonville has no cities at all like Toronto close by. Jacksonville does have Orlando, FL (with around 2.2 million) about 2 hours’ drive from the south, and Savannah, GA (with around 360,000) about 2 hours’ drive from the north, then there is the Space Coast/Daytona Beach, FL area (about 600,000). So Jacksonville only has about 4 or 5 million people within 2 hours’ drive, while Buffalo has over 10 million within two hours’ drive.
…
From the New York Times, from December 1, 1993, by Frank Litsky, ‘PRO FOOTBALL; N.F.L. Expansion Surprise: Jacksonville Jaguars‘ (nytimes.com).
Look at this map below, and check out Jacksonville’s fan base. On the map, the Jaguars’ fan base is about the size of the state of Connecticut, and is the second smallest fan base by area (ahead of only the New York Jets in Queens County, NY), and is the smallest NFL fan base when you translate their territory into demographic terms. I say that because Greater Jacksonville has around 1.3 million people, and the adjacent counties which comprise the rest of the Jaguars’ fan-base are sparsely populated, making the Jaguars’ fan-base population about 1.7 million (and that is being generous); while Queens County, NY (ie, the Jets’ fan-base) has a population of 2.2 million, plus there are many Jets supporters throughout Long Island as well as throughout the rest of the metro-NYC area. {Source of map, with the data accumulation for the map explained: ‘NFL Fans on Facebook [a map by Sean Taylor'}.
facebook.com/notes/facebook-data-science/nfl-fans-on-facebook
...
Jaguars' Stadiums, in Jacksonville and in London, England
The Gator Bowl Stadium had opened in 1928, as a 7,600-capacity stadium known as the Fairfield Stadium, for the city's 3 high school football teams back then. After World War II, the Fairfield Stadium started hosting the then-new annual college postseason bowl game called the Gator Bowl, and 2 years later in 1948, its capacity was raised to 18,000 and the venue was renamed the Gator Bowl Stadium. The next year, 1949, its capacity was doubled to 36,000. In 1957, the Gator Bowl Stadium was again expanded and renovated, now with the capacity of 62,000. In 1974 it was expanded to a 72,000-capacity. By the mid-1970s, the attendance at the annual Gator Bowl each January regularly reached 60,000–70,000. The only other primary tenant was the annual Florida Gators/Georgia Bulldogs game - which since 1933 has been held in Jacksonville and since 1946 has been held at the Gator Bowl Stadium, with only three exceptions: in 1943, when Florida did not field a football team due to World War II, and then in 1994 and 1995, when the contest was held at the respective schools' campus stadiums due to the reconstruction of the venue for the debut of the Jacksonville Jaguars in 1995. The structure was almost entirely razed in 1994, as part of the re-build. Jacksonville essentially built a new stadium. The new stadium was renamed Jacksonville Municipal Stadium (then it was known as Alltel Stadium from 1997 through 2006, and has been known as EverBank Field since August 2010). When the stadium re-opened in 1995, almost none of the original infrastructure remained from the pre-1994 days, except for the west upper deck (which was added in 1982) and the ramping system.
The city of Jacksonville and Alltel Stadium (as it was known then) hosted Super Bowl XXXIX (39), which was played in February 2005 (and was won by the Patriots over the Eagles). Jacksonville did not have near enough hotel capacity for the influx of attendees, so 5 ocean liners were commissioned to cruise up the St. Johns River and dock in the city to provide more hotel room capacity. This only underscores how small a city Jacksonville really is. Especially when you consider that Jacksonville is a warm weather coastal city, but it still does not draw a significant amount of tourist trade.
EverBank Field has a capacity of 76,867, but because of declining ticket sales in recent years, since 2005 that capacity has been reduced by about 9,500 - with massive tarpaulins covering whole swathes of the upper deck (see photo below), for most home games - like they do at poor-drawing MLB stadiums in St. Petersburg, FL (for Tampa Bay Rays games) and in Oakland, CA (for Oakland A's games).
Photo credit above -
Photo unattributed at sheltonmedia.blogspot.com
There was no threat of declining attendance all through the Jaguars' first decade. The Jaguars started out so strong, making the playoffs in their second season in 1996, where they advanced with 2 playoff wins all the way to the 1996 AFC Conference final. Then the Jags also made the playoffs in the next 3 seasons (1997, '98, and '99). But the team fell into mediocrity by the early-2000s, and by 2004 they saw serious attendance declines so the following season (2005), they reduced the stadium capacity by almost 10,000 (to 67,246), and started using those embarrassing tarps to cover the upper decks. By 2009, the Jaguars were only drawing around 50,000 per game and had 7 of 8 of their home games blacked out in their home-television-market that year. Then the team slashed ticket prices. Jacksonville now makes some of the lowest profit on tickets per home game in the league, and their average ticket price in 2013 was third-lowest {see this, '2013 NFL Tickets: Team by Team Average Prices' (blog.tiqiq.com)}. In the last 3 years attendance has rebounded to around 62 to 64,000 per game, and around 92 to 96 percent-capacity (but don't forget that capacity has been reduced by 9,500, so the Jaguars aren't really playing to 94 percent-capacity, they are really playing to around 83 percent-capacity) (see recent Jaguars' attendance data in the caption below).
Photo credits above -
jacksonville.com. tibsnews.com/jacksonville-jaguars-in-40-million-redevelopment. jaguars.com/news/article-JaguarsNews/Jaguars-announce-four-London-home-games. Photo of distant exterior of Wembley by Rob at landscapesofengland.co.uk and at flicker.com.
Now, starting in 2013, for the next 4 seasons, Jacksonville will be playing one home game per season in London, England. The owner of the Jaguars, Shad Khan (who made his fortune in SUV and truck OEM parts [original equipment manufacturer parts]), has secured one Jacksonville Jaguars’ home game per season to be played at Wembley Stadium (II) in north-west London, which has hosted at least one NFL game annually since 2007. {see this, ‘Jags to play 4 London home games‘ (espn.go.com from 21 Aug. 2013)}. That doesn’t sound like an owner who has much confidence in his team’s fan base. Khan also recently bought an English first division football club – a Premier League club called Fulham FC, who are based in West London, less than 10 miles from where Jacksonville will be playing one game for each of the next 4 years. Fulham FC is a solid but unassuming club with a 25,000-capacity stadium that basically cannot be expanded much more (being situated in a residential neighborhood right up against the River Thames), and the club does well just to remain in the first division. If you connect the dots you can see that Khan’s NFL franchise will perhaps not be called the Jacksonville Jaguars in the near future. Maybe they will be called the Los Angeles Jaguars. Or maybe they will be called the London Jaguars. At the press conference announcing the Jaguars’ 4 London games, as it says in the article linked to above …’Goodell reaffirmed his commitment to expanding to multiple games in England and eventually establishing a franchise there’. Here is what a Jaguars fan said in response to a Florida Times-Union article about the Jaguars’ 4-games-in-London deal …’I am skeptical of the London maneuver for different reasons. It has very little potential to actually help Jacksonville. It may help the Jaguars, but not the City. Even if Brits become Jags fan, and actually fly all the way to the States to catch a game (which is far fetched), does anybody actually think they are going to spend the bulk of their money in Jacksonville? They are probably going to stay in Ponte Vedra or St. Augustine. And besides the actual game, they will be visiting Rat World in Orlando or traveling up to Savannah. Furthermore, 1 to 2 games a year being played in London is a slap in the face to loyal Jags fans. What’s good for the Jags isn’t always good for Jacksonville.’…(that comment was from BEARSHARK at jacksonville.com/jaguars/2013-06-19/story/jaguars-owner-shad-khan-stresses-commitment-london-game).
[Note: it has been brought to my attention that Shad Khan intends to financially support the coming waterfront re-development in Jacksonville, which of course, severely undercuts my premise that Khan may intend to move the Jaguars franchise out of Jacksonville/ see comments #2 & #3 at the bottom of this post, and thanks to commenter Rick for that.]
In case you are wondering, the air distance from Jacksonville, Florida to London, England is 4,266 miles (6,866 km.).
The colors and helmet logos of the Jacksonville Jaguars
The Jaguars colors are teal, black, and yellow-gold. Their first helmet was black, with a snarling, teal-tongued Jaguar head, and a black facemask. In 2009, the team first started tinkering with dual-tone color effects. Here is what it says at ‘Jacksonville Jaguars/uniforms‘ at the team’s page on Wikipedia…’The final change made to the Jaguars’ uniforms in 2009 was to the helmet. The new helmet and facemask are black just like the old ones, but when light hits the new ones a certain way, both the helmet and face mask will sparkle with a shiny teal appearance. These are the first helmets in professional football which change color with different angles of light. The logo and number decals also incorporate this effect.’…{end of excerpt}.
{You can see Jaguars (and Vikings and Dolphins) uniform changes for 2013 at the following link at Gridiron Uniform Database, from Aug. 2013, by Bill Schaefer, ‘New for 2013‘ (nfluniforms.blogspot.com)}.
Now in 2013, along with an updated snarling-teal-tongued-jaguar’s-head logo, the Jaguars have unveiled their second dual-tone helmet. This one looks like the equipment manager had an accident with a can of black spray paint. The new Jaguars’ helmet is basically black in front and gold in back (with a black facemask) – with black color around the forehead and the helmet’s ear-flaps, and with the color shifting from matte-black to a brief section of a brownish color (around the logo at the center of each side of the helmet), then shifting to a metallic gold on the whole of the back of the helmet. Also in 2013, the teal in the Jaguars’ color scheme has been moved to a trim color, with the primary color now essentially being black (and with more gold than in the past). De-emphasizing the teal in their color scheme was probably a good decision, because teal as a major league sports team’s color is a played-out concept that most self-respecting sports fans want no part of these days – teal has basically jumped the shark. As to the new helmet, well, some people might like the new Jaguars helmet design. I decided to wait and see how they looked in a game on television, and now that I have seen the Jaguars’ new helmet in action, I can tell you what I think…I think the Jaguars’ new dual-tone helmet looks ridiculous, and with the extra-busy stripe detailing on the Jaguars’ new pants, the least-supported team in the NFL only looks more ridiculous.
The Jacksonville Jaguars have never made a Super Bowl appearance [no Super Bowl appearances in 18 seasons up to 2012]. They are one of only 4 teams in the NFL to have never reached a Super Bowl final. The other teams in this dubious category are the Detroit Lions (no Super Bowl appearances in all possible seasons [47 seasons up to 2012]), the Cleveland Browns (no Super Bowl appearances in 44 seasons up to 2012), and the Houston Texans (no Super Bowl appearances in 11 seasons up to 2012).
…
Tennessee Titans logo & helmet history (1960-2013) – click on image below
Tennessee Titans logo & helmet history (1960-2012)
Titans/Oiler’ 50th anniversary patch from ioffer.com/i/houston-oilers-t-titans-50th-anniversary-afl-2009-patch. Illustration of Titans’ uniforms by JohnnySeoul at en.wikipedia.org. Helmet illustrations above from Gridiron Uniform Database. Photo of Titans’ helmet from americansportscollectibles.com/TEN-Titans-Helmets.
Oilers/Titans’ helmets at MG’s Helmets, mghelmets.com/titans.
From titansonline.com, from 2009, ‘Franchise Celebrates 50th Season‘.
From titansonline.com/history, ‘Houston Oilers logo history‘ (titansonline.com)’.
Here is a photo of a 1960 Oilers’ game program from grayflannelsuit.net [note: there are many other old AFL programs you can see at that site {at index at bottom of page there}].
The Houston Oilers – a team owned by an actual Texas oilman
The original NFL franchise in Houston, Texas was the Houston Oilers, who were a charter member of the AFL in 1960, and became an NFL team following the AFL/NFL merger in 1970, then moved to Nashville, Tennessee after the 1996 season, becoming the Tennessee Oilers in 1997 and then the Tennessee Titans in 1999. The 90-year-old Bud Adams was and still is the owner of the Houston Oilers/Tennessee Titans’ franchise. Adams in his heyday was an outsize personality who was essentially a cartoon-version of a Texas oilman-come-to-life (ie, giant office with wet bar and water fountain, giant 10-gallon hats, and bluster to spare), who had a tendency to micro-manage his franchise. In early 1959, Adams had unsuccessfully tried to buy the NFL team the Chicago Cardinals. Another Texas oilman who also wanted to own an NFL franchise then came into the picture, AFL founder Lamar Hunt. Hunt, heir to the massive H.L. Hunt oil fortune, had also wanted to buy an NFL franchise, but found that, circa 1958, no NFL teams were up for sale, and that the ultra-conservative NFL had absolutely no interest in expansion (back then). So Lamar Hunt simply formed another pro football league. Lamar Hunt put together ownership groups in 6 cities (and eventually in 8 cities) and launched the American Football League (IV) in 1959, to begin play in 1960. Hunt himself became owner of the AFL charter member the Dallas Texans (the future Kansas City Chiefs). Here is an excerpt from the Wikipedia page on the ‘History of the Houston Oilers‘…”Adams was an influential member of the eight original AFL owners, since he, Dallas Texans/Kansas City Chiefs founder Lamar Hunt and Buffalo Bills founder Ralph Wilson were more financially stable than the other five (all three would go on to own their franchises for over forty years, whereas the others pulled out by the 1980s).”…{end of excerpt}.
Early success for the Oilers after a crucial court case was decided in their favor
The Oilers were the first dominant team in the AFL of the 1960s, appearing in the first 3 AFL title games and winning the first 2 of them. Under coach Lou Rymkus, the Houston Oilers won the 1960 American Football League Championship Game, 24-16 over the Los Angeles Chargers before 32,183 at Jeppesen Stadium in Houston on Jan.1, 1961. The game was originally scheduled to be played at the then-101,000-capacity Los Angeles Coliseum, but the AFL league office hastily changed the venue to Houston so there would not be an embarrassing 60-thousand-empty-seats scenario. The following season, now coached by Wally Lemm, Houston again beat the Chargers, this time by the score of 10-3 (the Chargers had moved from LA down to San Diego by then, and the 1961 AFL final was played at the then-34K-capacity Balboa Stadium in San Diego, CA before a crowd of 29,556).
In both of the first two AFL title games, Houston halfback Billy Cannon was the game’s MVP. Cannon, as an LSU halfback out of Philadelphia, Mississippi, had been the 1959 Heisman Trophy winner. The bidding war to sign Cannon between the AFL and the NFL in early 1960 ended in a court case which the new league (and thus the Oilers) won. Here is Bud Adams’ recounting of how he signed Cannon from under the nose of the Rams and the NFL…{excerpt from page 24 of When the Grass Was Real, by Bob Carroll}…’ ‘I could just tell something was up because I couldn’t get [Cannon] on the telephone, couldn’t find him or anything. So I called Alvin Roy, who ran a health club in Baton Rouge where Cannon lifted weights. I knew Alvin had to know where Billy was. He said he hadn’t seen Billy, so I said, “Look, if you see him, will you just tell him that I’ll pay double whatever they paid him”. It wasn’t but fifteen minutes later that [Cannon] called me back. He had signed with the Rams, but I didn’t figure they’d blow the whistle on it, because he still had the Sugar Bowl to play. So we signed him under the goalposts after the Sugar Bowl’…{end of excerpt}.
The judge, in the suit that the Rams and the NFL had brought against the Oilers and the AFL, sided with the Oilers, reasoning that it would have been unfair to Cannon otherwise, and that the Rams had taken advantage of the naive Cannon and had not allowed him the knowledge of a better offer. Burn. Signing Billy Cannon gave the AFL instant credibility, and it was the first signing the new league made that put them on the map. It also didn’t hurt that Cannon was the real deal, and helped bring Bud Adams’ franchise the only two titles the team has ever won, to this day. Also prominent for the Oilers in their first few seasons was legendary QB/placekicker George Blanda. Blanda had been in the NFL since 1949, and would play up to 1975 (Blanda played until he was 48 years old, with 26 seasons in pro gridiron football, the all-time record; he retired as an Oakland Raider in January, 1976).
QB George Blanda, the ageless wonder who came out of retirement with the Oilers to become the unlikely king of the Touchdown Pass
George Blanda, the son of a Slovak-born Pittsburgh-area coal miner, had been QB and placekicker at Kentucky back when Bear Bryant was the coach of the Wildcats. Graduating in 1948, Blanda was a 12th round pick by the Chicago Bears in 1949. With the Bears he also saw some duty as a back-up linebacker in addition to his placekicking and back-up quarterback role. In 1952 Blanda threw his first TD passes – 8. The next year, 1953, now the starting QB, he threw 14 TD passes. But by 1958, his QB role had diminished to just 7 pass plays for the whole season, and he discovered that George Halas did not intend for him to continue his dual-role as quarterback and placekicker, but to only be the kicker for the Bears in 1959. Blanda would have none of that, so he retired. But a year later in 1960, with the appearance of a new rival league, a 33-year-old Blanda opted to come out of retirement and try his luck in the upstart AFL. With this development, some of the more hide-bound members of the pro football media then called Blanda an ‘NFL reject’. I guess George Blanda had the last laugh on that one {George Blanda at profootballhof.com}. Blanda was the starting QB/placekicker of the title-winning Oilers in 1960, and in ’61 the Oilers were AFL champions again as Blanda passed for 3,300 yards and a then-record-setting 36 TDs and was voted the 1961 AFL MVP (Dan Marino bested Blanda’s [and YA Tittle's] touchdown-pass record with 48 TD passes in 1984; then Peyton Manning of the Colts set the record with 49 TD passes in 2004; then Tom Brady of the Patriots set the current record with 50 TD passes in 2007). Also in 1961, Oilers’ flanker Charlie Hennigan set a record with 1,736 yards receiving (a pro-football record that stood for 34 years). George Blanda later said: “I think the AFL was capable of beating the NFL in a Super Bowl game as far back as 1960 or ’61. I just regret we didn’t get the chance to prove it.”
The Houston Oilers made the play-offs in 5 of the 10 AFL seasons, and were tied for the second-most AFL titles (tied with the Buffalo Bills with 2 AFL titles, and behind the Dallas Texans/Kansas City Chiefs franchise with 3 AFL titles). But because their heyday was in the AFL’s early years, when the new and somewhat disorganized league had a rather weak media presence, today the championship-winning Houston Oilers’ teams of 1960 and 1961 are largely forgotten by NFL fans. By the time the AFL/NFL merger took place (prior to the 1970 season), the Oilers were on their way to becoming a basement-dweller.
Photo-credits above – George Blanda, unattributed at dubsism.wordpress.com/list-of-the-30-greatest-quarterbacks. Billy Cannon, unattributed at fanbase.com. Photo of Charlie Hennigan trading card from remembertheafl.com/AFLHallofFamePhotos.htm#CharlieHennigan
Colors and helmet logos of the Oilers/Titans franchise
The original Houston Oilers wore light blue jerseys and light blue helmets with a plain-but-striking oil-derrick logo in white, with a thin white-center-stripe. Their pale blue was accompanied by red and white trim colors (red trim was added to the helmet-stripes in 1964). But why light blue? Because Bud Adams really liked that shade of blue. Silver, in the form of a silver helmet and silver pants, was added to the Oilers’ color scheme for the years 1966 to 1971 (6 seasons), and on the silver Oiler helmet the oil derrick was royal-blue-and-red. Then the Oilers dropped the silver, made the oil derrick white-with-red-trim, and switched back to light blue helmets for 3 seasons – 1972, ’73, and ’74. This spell coincided with the franchise’s low point, when the hapless powder-blue-helmeted Oiler teams of ’72 and ’73 both went 1-13. When ex-Chargers’ coach Sid Gilllman came in in 1974, the team improved to 7-7, and the next year, when the Oilers switched to white helmets in 1975, and went 10-4, they were already on their way to becoming the play-off-bound force they became in the late 1970s, when, coached by the gentlemanly U.A. ‘Bum’ Phillips and powered by the rock-solid running back Earl Campbell, the Oilers came up just short of a Super Bowl trip and lost in the AFC Conference Final for 2 straight seasons to eventual Super Bowl champions the Pittsburgh Steelers (in the 1978 and 1979 seasons).
That soon-to-be-iconic white helmet-with-red-and-blue-oil-derrick was what the Oilers wore from 1975 all the way to 1998. This white helmet originally had the stripe-detail and the derrick’s core-color as Oiler light blue, with grey facemasks – and that was for the first 6 years (1975 to ’80) of this helmet design. Then, the stripe-detail and the derrick’s core-color as a slightly darker blue (a pale royal blue a bit darker than the Oiler-light-blue of the team jerseys), and with red facemasks, from 1979 to 1998. This was the Oilers’ helmet for the final 22 seasons of the team’s spell in Houston (up to 1996), and the first 2 seasons the franchise was in Tennessee and still called the Oilers (1997-98).
When Adams moved his franchise to Tennessee in 1997, he kept the color scheme and the oil-derrick-logo for the 2 years the team was called the Tennessee Oilers (1997, in Memphis, TN; and 1998, in Nashville, TN). Then when the franchise changed their name to the Tennessee Titans in 1999, and the team finally moved into their purpose-built new stadium (see 2 paragraphs below), dark blue was added to the light blue/red/white color scheme, with the Titans’ uniforms being mainly light blue and navy blue (including navy blue pants). The franchise stayed with a white helmet, but with a totally new logo and a navy blue facemask. The Titan’s helmet also featured a flared pair of navy blue center-stripes which tapered out as they moved back from the forehead. The red in the Titans’ new color scheme only showed up in the detail of their new logo on their helmet.
The Titans’ official logo and helmet logo is an airborne circular-shield, featuring a cross-guard-bearing-sword-shaped ‘T’ and 3 stars (a nod to the 3-star-in-circle device on the flag of Tennessee) – the shield has a trail of flames, similar to a comet [in Greek mythology, the titan Prometheus was the bringer of fire to man via a blazing stone hurled from the heavens to Earth].
Oilers’ stadiums in Houston
The Oilers first venue was the well-remembered and cozy Jeppesen Stadium in Houston {Jeppesen Stadium at football.ballparks.com}. Jeppesen Stadium had a capacity then of 35,000 [the venue was the home of the Houston Cougars' NCAA football team from 1946–1950 and 1998–2012; the Oilers also hosted 2 AFL title games there in 1960 {see previous section} and in 1962 {see this about the longest pro football game ever, the '1962 American Football League Championship Game'}; also the MLS team the Houston Dynamo played soccer at Jeppesen Stadium from 2006 to 2011; the venue was demolished in 2012]. The Oilers played 5 seasons at Jeppesen Stadium, then in 1965 Bud Adams tried to negotiate a tenants’ lease with the owners of the then-newly-built Astrodome. The Houston Sports Authority, which owned both the MLB team the Houston Astros and the Astrodome, initially wanted more than Adams was willing to pay for rent, so Adams had his Oilers play for 3 seasons (1965-67) at another college football venue in the city, Rice Stadium (of Rice University), home of the Rice Owls – which had a gargantuan capacity of 70,000 back then [note: Rice Stadium hosted Super Bowl VII in January 1974]. Adams and the HSA/Astrodome owners finally reached an agreement after the 1967 season, and so the Houston Oilers moved into the Astrodome in 1968. The team would play there for the rest of the franchise’s years in Houston (for 29 seasons, until 1996). So in 1968, the AFL’s Houston Oilers became the first pro football team in the US to play in a domed stadium.
Oilers/Titans’ stadiums in the state of Tennessee
Bud Adams moved his franchise because he said the city of Houston wouldn’t work with him to find a suitable football-only replacement venue for the run-down Astrodome. But the problem was, Nashville wouldn’t have a new stadium ready for 2 more years, and the only other options in the state all had drawbacks…Nashville, TN’s Vanderbilt University wouldn’t let beer be served at their small-for-the-NFL, 40,000-capacity venue, so that was out. The Tennessee Volunteers’ huge 100,000-plus-capacity stadium, Neyland Stadium in Knoxville, TN was just too big, and Knoxville was too far off-the-beaten-track. The final option, which the franchise took for 1997 – the then-62,340-capacity Liberty Bowl Memorial Stadium in Memphis, TN – turned out to be a terrible choice. First of all, at that time (ca. 1997), major road-work was being done on the main highway route from Nashville to Memphis, turning the regularly-2-hour-drive to a 5-hour-traffic-snarl nightmare, so very few Nashville-residents traveled to Memphis to see the Tennessee Oilers play in ’97. And meanwhile, Memphis residents, so mad at the NFL for all the years that the league refused to take seriously Memphis’ attempts to secure an NFL franchise, effectively boycotted Tennessee Oilers’ home games in Memphis. The stadium was less than half-full for 7 of the 8 Tennessee Oilers’ games the franchise played in Memphis (at around 27,000 or less), and the 1997 season-ending home game versus Pittsburgh ended in abject humiliation for Adams as tens of thousands of Steelers fans bussed down or drove down (or flew down) from the north end of the Appalachians and turned the Liberty Bowl into a de-facto Steelers’ home game, with an estimated three-quarters of the 57,000 in attendance there being Pittsburgh fans (Pittsburgh won, of course). Adams was so embarrassed by this case of poetic justice for his carpet-bagging franchise that he swallowed his pride and had the Oilers play 1998 at the dry, and too-small-for-the-NFL 40K-capacity Vanderbilt Stadium in Nashville.
The city of Nashville and Davidson County, TN would be the owners of the new stadium in downtown Nashville that the newly-renamed Tennessee Titans moved into in August, 1999. Now known as LP Field, the venue began as the 67,700-capacity Adelphia Coliseum, until that bent corporation went broke (eventually going belly-up with its boss, John Rigas, in jail). Then the venue was called The Coliseum for 4 years as they tried to scare up some more naming-rights money, which they did in 2006, which was also the year the last slight stadium-expansion took place. What’s LP? It is a manufacturing company specializing in wood-particle-board, based in Nashville, which was formerly called Louisiana-Pacific. Since 2006, the stadium has had a capacity of 69,143.
Music City miracle
My therapist told me it might be good for me to get closure on this incident & the mental-complex it has caused me as a Bills fan, if I talked about it, so I made the illustration below. Just kidding – us Bills fans can’t afford therapists! Anyway, hats off to Titans’ head coach Jeff Fisher, and to the 1999 Titans’ coaching staff, and to the 1999 Titans players – for coming up with this play, for practicing it every week that season, and for flawlessly executing the play…making for one of the most sublime moments in NFL history. Sigh.
Youtube video – ‘Music City Miracle-Actual TV Broadcast‘, uploaded by Chris Lee at youtube.com.
Image credits above –
‘Music City Miracle-Actual TV Broadcast‘, uploaded by Chris Lee at youtube.com.
Helmet illustrations from gridiron-uniforms.com.
Graphic art: ‘Music City Miracle’ by Hmize, can be purchased at http://society6.com/hmize/Music-City-Miracle_Print.
The Houston Oiers won 2 AFL titles (1960, 1961).
The Titans/Oilers’ franchise is 0-1 in Super Bowl appearances (lost in the 1999 season to the Rams).
___
Thanks to Helmets, Helmets, Helmets site at http://www.misterhabs.com/helmets.htm, for the illustrations of the helmets on the map page.
Thanks to Sportslogos.net, for several of the logos and for dates of logos, sportslogos.net/NFL.
Thanks to the contributors to the pages at en.wikipedia.org, ‘AFC South‘ (en.wikipedia.org).
Thanks to pro football historian Bob Carroll, for his excellent history of pro football in the 1960s, When the Grass Was Real, published in 1993 by Simon & Schuster, and available at amazon.com here}.
Special thanks to Tim Brulia, Bill Schaefer and Rob Holecko of The Gridiron Uniform Database, for giving billsportsmaps.com the permission to use the football uniforms illustrations {GUD}.


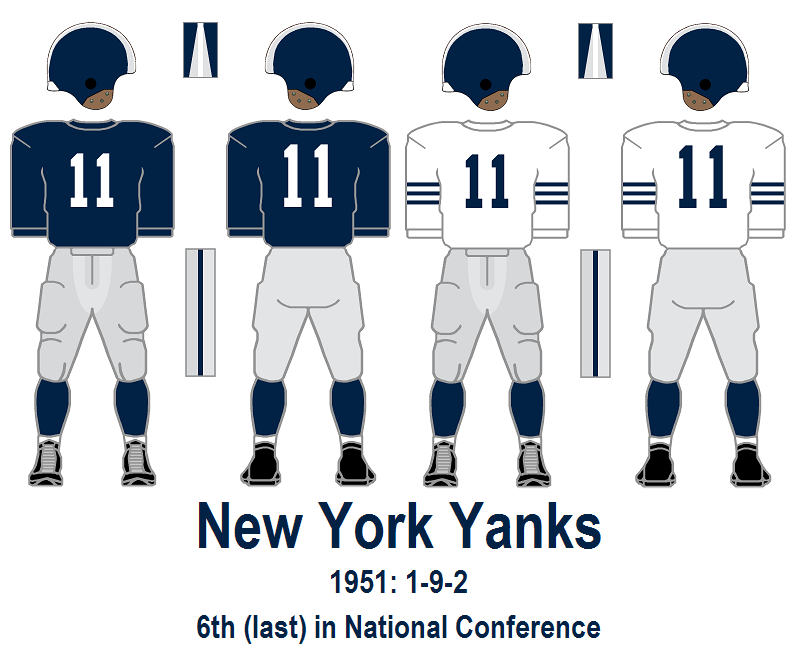
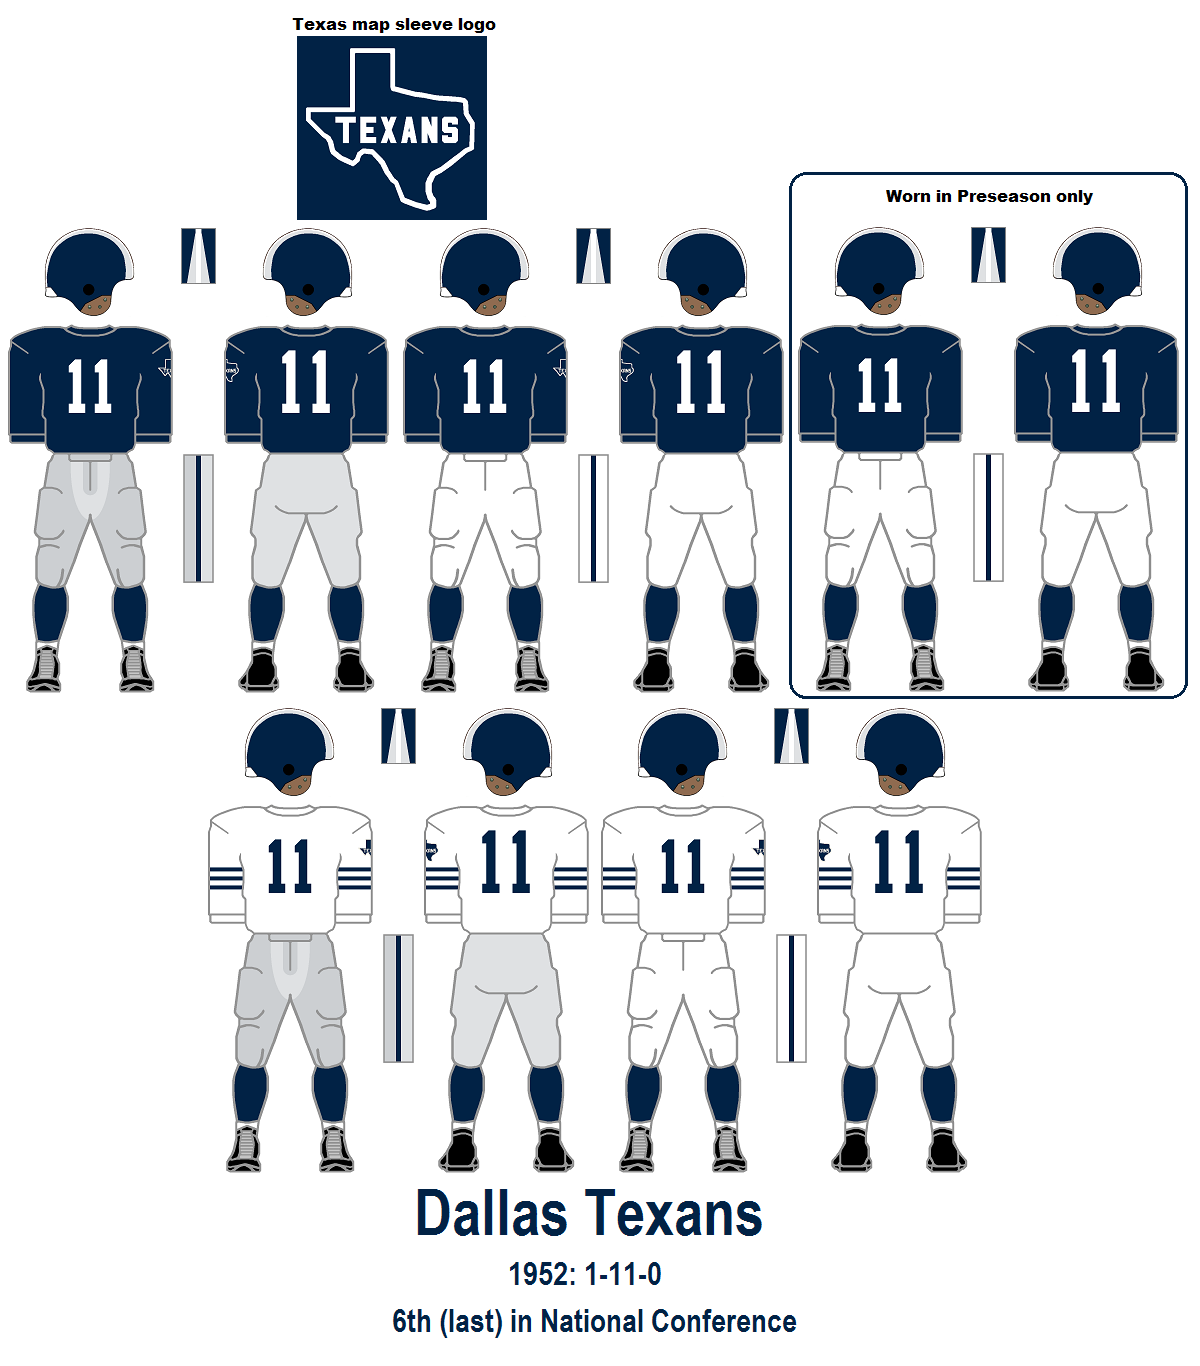
.png)