
By Bill Turianski on 6 July 2016; twitter.com/billsportsmaps.
Links…
-Nordic nations (Sweden, Norway, Denmark, Finland, Iceland, Faroe Islands) [aka greater Scandinavia]…Nordic countries (en.wikipedia.org).
-Best attendances in Nordic leagues in 2015…Den nordiska publikligan (ecst.se/fotboll).
-Sweden’s top flight…2016 Allsvenskan
; ALLSVENSKAN [2016] (soccerway.com).
-Denmark’s top flight…2015–16 Danish Superliga
; SUPERLIGA [2016-17] (soccerway.com).
-Norway’s top flight…2016 Tippeligaen
; ELITESERIEN [2016 Tippeligaen] (soccerway.com).
-Finland’s top flight…2016 Veikkausliiga
; VEIKKAUSLIIGA [2016] (soccerway.com).
…
Below: Alfheim Stadion, home of Tromsø IL (of Tromsø, Norway).
Norway’s Tromsø IL are the northern-most first division football club in the world.

Photo and Image credits above -
Map of Scandinavia/Finland by NormanEinstein at File:Norwegian Sea blank map.png (commons.wikimedia.org).Aerial shot of Tromsø with Alfheim Stadion, photo by groundhopping.se/[Tromsø]. Aerial shot of Tromsø at night, photo by Action Images via dailymail.co.uk. Shot of Alfheim Stadion with pile of snow in foreground, photo by AFP/Getty Images via dailymail.co.uk.
…
-
Nordic countries (Sweden, Norway, Denmark, Finland):
Highest-drawing football clubs in 2016: all clubs which drew over 2,000 per game (65 clubs).
On the map page…
1). On the top-left-hand side are thumbnail descriptions of the 4 Nordic leagues whose teams are featured on the map. Noted are each of those 4 leagues’ current [2016] UEFA co-efficients (ie, league-ratings versus the rest of Europeans leagues within UEFA). One thing that a newcomer to Nordic football would need to know is the fact that 3 of the 4 primary Nordic leagues (Sweden, Norway, Finland) play a summer schedule (~April to November), while one league – Denmark’s Superliga – plays the standard schedule (ie, like most of the rest of Europe/ ~August to May).
1a). Right below that are 4 lists, showing the all-time title lists for each of the 4 countries, with the crests shown of the most-titled clubs from each of the 4 countries.
{Sources for title lists…
Sweden, https://en.wikipedia.org/wiki/List_of_Swedish_football_champions#Total_titles_won_by_club;
Denmark, https://en.wikipedia.org/wiki/List_of_Danish_football_champions#Total_titles_won;
Norway, en.wikipedia.org/wiki/List_of_Norwegian_football_league_champions#By_club ;
Finland, https://en.wikipedia.org/wiki/List_of_Finnish_football_champions#Performance_by_club.}
2). In the middle of the map-page is a long chart which shows the 65 clubs whose teams are on the map, with the following details…
2a). League the team is in, the team’s 2015-or-2015/16-league-finish, and the team’s divisional-movement from 2014-to-2016 (if any).
2b). Attendance in 2015-or-2015/16 [home league average attendance], ranked.
2c). Club name, with city/region description if not noted in club nomenclature.
3). The map, which shows Scandinavia-(Norway/Sweden/Denmark)-plus-Finland. [As with respect to the other Nordic countries...sorry, but no Icelandic or Faroe Islands teams drew above 2-K-per-game last year.]
Stadium shares
There are 3 instances of stadium-shares…in Gothenburg at Gamla Ullevi (a 3-way-share between: GAIS, IFK Göteborg, and Örgryte IS), in Stockholm at Tele2 Arena (a 2-way-share between: Hammarby IF and Djurgården IF), and in Helsinki at Sonera Stadion (a 2-way-share between: HIFK and HJK).
Notes on map
I have tried to make all the club crests on the map approximately the same size. From the original blank map I added lakes in Sweden and Finland, plus I also added flanking-edge areas not in the original blank map (in the Baltic States/Eastern Europe and in NE Netherlands). I did this because I had to tilt the original map to orient it in a more North-South axis. That was necessary because the original map’s focal point was the Norwegian Sea, not the Scandinavian Peninsula, and so Scandinavia-and-Finland looked distorted – until I tilted the whole map about ~20 degrees. I added one extra detail…the mighty Øresund Bridge. The Øresund Bridge is actually a 12 kilometre/8.5 mile-long bridge-and-tunnel. Completed in July 2000, it connects Copenhagen in Denmark to Malmö in Sweden. The Øresund Bridge is a physical manifestation of how interconnected the Nordic countries are.
Average attendance by league (2015 or 2015-16)…
Sweden, Allsvenskan: 9,961 per game.
Denmark, Superliga: 7,184 per game.
Norway, Tippeligaen: 6,711 per game.
Finland, Veikkausliiga: 2,574 per game.
…
-
The 12 highest-drawing clubs in the Nordic countries in 2015 or 2015-16 – all clubs which drew above 10 K per game (2015 or 2015-16 season) -
(Hammarby IF, AIK Fotboll, Rosenborg BK, Malmö FF, FC København, Djurgården IF, IFK Göteborg, Brøndby IF, IFK Norrköping, Viking FK, SK Brann, Vålerenga IF)
Highest-drawing Nordic team – Hammarby IF (Stockholm, Sweden)…
After a five-season spell in the second tier, Hammarby IF won promotion back to the Swedish top flight (the Allsvenskan), on the last day of the 2014 season {see photos below}. The next year (2015), Hammarby set the all-time record for average attendance in Sweden (and in all the Nordic countries), pulling in an impressive 25,507 per game (they finished in 11th place in 2015). Now, granted, Hammarby are playing in a sparkling new all-mod-cons sports palace (the Tele2 Arena), and that fact will have added to their crowd sizes. But their gate figures are nevertheless very impressive for Scandinavia.
Hammarby IF might seem to be an unlikely team to be the highest-ever-drawing Nordic football club, because they have only won only one Swedish title (in 2001/ all-time Swedish medal table, here). But the club has vast support among the working class of southern Stockholm and beyond. There are no plastic Hammarby fans looking for the reflected glory of a big, title-winning team. They simply support Hammarby because the club is part of them – even if the history of Hammarby IF is replete with blown chances, near-title-win-choke-jobs, and a seemingly eternal struggle to simply remain in (or return to) the top flight. The other sizable Stockholm-based clubs – AIK and Djurgården – might be able to rack up the titles, but neither can match Hammarby when it comes to filling a stadium up with supporters.
-Here is a nice post from Reddit/soccer on Hammarby…Small teams in the spotlight #8: Hammarby IF (reddit.com/r/soccer post uploaded by slicslack on 2 June 2015).
-Here is the article that was recommended in the above link, at the ESPN FC site…The story of Hammarby’s long-awaited return to Sweden’s Allsvenskan (espnfc.com/blog, article by Michael Yokhin on 7 April 2015).

Photo credits above -
2015 Hammarby home jersey, photo by intersport.se/hammarby-fotboll-2015. View of central Stockholm, photo by Fotolia at travelguide.lufthansa.com/stockholm. Hammarby supporters during supportermarchen, the tradional walk from central Södermalm to the team’s home stadium, [which was at that point in time] Söderstadion , before the season’s first home game [photo from April 2013], photo by Arild Vågen at File:Supportermarschen 2013 09.jpg. Last game at Söderstadion/pitch invasion (June 2013), photo unattributed at aftonbladet.se. Aerial view of Tele2 Arena, with Ericsson Globe (aka Globen) adjacent, photo by [the main building contractors] Peab, at peab.se/tele2-arena. Street-view of Tele2 Arena from tpeinfill.com. Interior shot of Tele2 Arena, photo by groundhopping.se/Hammarby. Hammarby supporters’ pitch invasion upon winning promotion to the Allsvenskan [Oct. 2014], photo unattributed at i.ytimg.com/vi/bLFrjg-mfj0/maxresdefault.jpg via reddit.com/r/soccer post from 2 June 2015, here. Hammarby supporters’ pitch invasion upon winning promotion/photo 2, photo unattributed at i.imgur.com/h91zXjM.jpg via reddit.com/r/soccer post from 2 Nov. 2014, reddit.com/r/soccer/comments/2l2lft/hammarby_just_secured_promotion_to_allsvenskan. Hammarby fans in Tele2 Arena with flags and with scarves held up and with giant banner proclaiming ‘This Is Soderstadion’, photo by Anders Skoog via LG Skoog at runnersworld.se/blogs/lgskoog/mitt-87-e-rw-blogginlagg.htm.
…
2nd-highest-drawing Nordic team – AIK Fotboll (Solna, Greater Stockholm, Sweden)…

Photo credits above -
2016 AIK home jersey, photo by uksoccershop.com/AIK-Stockholm-Adidas-Home-Football-Shirt. Aerial view of Friends Arena [Sept. 2014], photo by Arild Vågen at File:Arenastaden September 2014.jpg. Night-time/exterior shot of Friends Arena unattributed at tripadvisor.se. Interior shot of Friends Arena with AIK supporters’ tifo, photo by bildbyran.se, via haik.se/fotboll/statistik/arena. AIK Ultras [2011], photo from jojjesplejs.com via europeanultras.com/phpbb2/viewtopic.php?f=3&t=20&start=70.
…
3rd-highest-drawing Nordic team – Rosenborg BK (Trondheim, Norway)…

Photo credits above -
Rosenborg 2016 home jersey, photo by aliexpress.com/Rosenborg-BK-Jersey. Aerial view of Trondheim, photo by Åge Hojem/Trondheim Havn at File:Overview of Trondheim 2008 03.jpg (commons.wikimedia.org). Tronheim in winter at twilight, photo by pitchmedia.com/photography/norway. Aerial view of Lerkendal Stadion, photo unattributed at pinterest.com. Rosenborg ultras with banners etc [photo from 2011 Rosenborg v Stabaek], photo unattributed at z6.invisionfree.com/UltrasTifosi. Alexander Søderlund being congratulated by teammates after scoring, image (screenshot) from youtube.com video uploaded by AllGoalsNorway at Rosenborg BK All Goals Tippeligaen 2015. Rosenborg players celebrating their 2015 title, photo unattributed at realfootytalk.com/2015/11/02/norwegian-tippeligaen-2015-round-29-review. Alexander Søderlund on a breakaway, photo by Rosenborg BK via vavel.com.
…
4th-highest-drawing Nordic team – Malmö FF (Malmö, Scania, Sweden…)
 -
-
2016 home jersey, photo by Malmö FF at mffshopen.jetshop.se/match/matchklader/matchtroja-hemma-2016-barn. Aerial view of Malmö with Øresund Bridge in background, photo by Johan Wessman, News Oresund at File:Aerial view of Malmö towards south taken from Malmö Live 20131023.jpg (commons.wikimedia.org). View of old city-center in , photo unattributed at besttraveltips.net. Aerial shot of Swedbank Stadin, photo unattributed at pinterest.com at s-media-cache-ak0.pinimg.com. MFF fans at Swedbank Stadion [2009], photo by mff-familjen.se via z6.invisionfree.com/UltrasTifosi/ar/t12159.htm.
…
5th-highest-drawing Nordic team – FC København [aka FC Copenhagen) (Copenhagen, Denmark)...

Photo and image credits above - FC Copenhagen 2016 home jersey, photo by uksoccershop.com/2016-FC-Copenhagen-Adidas-Home-Football-Shirt. Aerial view of Copenhagen, image by Getty Images at gettyimages.com/detail/video/view-of-copenhagen-city-copenhagen-denmark-stock-video-footage. View of Copenhagen, photo unattributed at ems2016.org/welcome-to-copenhagen. Aerial view of Parken Stadium, photo unattributed at footballtripper.com/telia-parken-copenhagen-stadium-aerial. FC København fans' giant banner, photo from z6.invisionfree.com/UltrasTifosi/index.php?showtopic=23016&st=44. Federico Santander, photo by Jan Christensen at gettyimages.com. Thomas Delaney, photo by Jan Christenson at gettyimages.com. Nicolai Jørgensen, photo by Jens Dresling at ekstrabladet.dk.
Kasper Kusk, photo by Lars Ronbog at gettyimages.co.uk. Mathias Jørgensen, photo by Lars Ronbog at gettyimags.co.uk. Youssef Toutouh, photo by Lars Ronbog at gettyimges.co.uk. Photo of players carrying manager Ståle Solbakken, photo by Lars Ronberg at gettyimages.com.
...
6th-highest drawing Nordic team - Djurgården (Stockholm, Sweden)...

Photo credits above -
2016 Djurgården IF home jersey, photo by difshop.se. View of central Stockholm in winter, photo unattributed at pinterest.com at s-media-cache-ak0.pinimg.com. Aerial shot of Tel2 Arena lit up with Djurgården colours, photo unattributed at fmsweden.se/topic/27379-fm15-sr-djurgardens-if-du-ar-allt-jag-har. Djurgården fans with flags, photo by unattributed at jarnkaminerna.se. Djurgården fans with smoke bombs and tifo [April 2015], photo by Helena Avermark at jarnkaminerna.se/bilder/2015-04-13-hammarby-if-djurgardens-if.
…
7th-highest-drawing Nordic team – IFK Göteborg (Gothenburg, Sweden)…

Photo credits above -
2016 IFK Göteborg home jersey, photo by IFK Göteborg at blavittshopen.web02.e37.se. Aerial view of Gothenburg, photo by Alamy via telegraph.co.uk/Swedish-city-embarks-on-6-hour-workday-experiment. View of central Gothenburg at night in winter, photo by Dick Gillberg at goteborgdaily.se/christmas-city-gothenburg-kicks-off. Aerial shot of Gamla Ullevi stadium, photo by powerphoto.nu/flygbilder-gamla-ullevi. Badges on a wall of the Gamal Ullevi stadium, showing the 3 clubs that call the stadium home: GAIS, IFK Göteborg, Örgryte IS, photo by groundhopping.se/IFKGoteborg. IFK Göteborg fans’ giant tifo banner, photo by IFK Göteborg at ifkgoteborg.se/For-supportrar/Tifofonden. Shot of IFK Göteborg fans with a myriad of flags and banners, photo by IFK Göteborg at ifkgoteborg.se/In-English/Welcome.
…
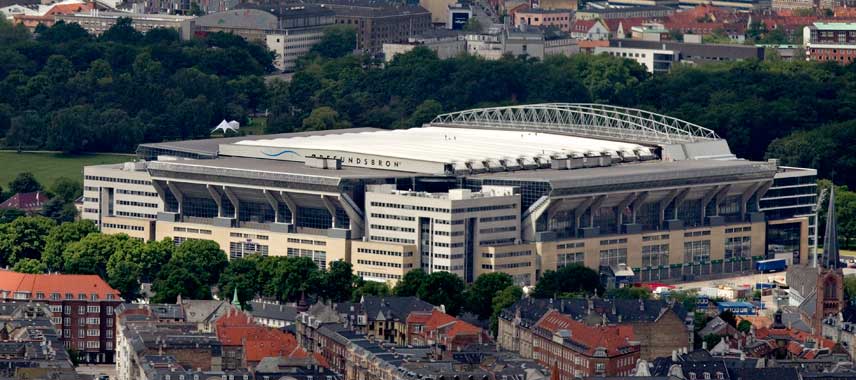
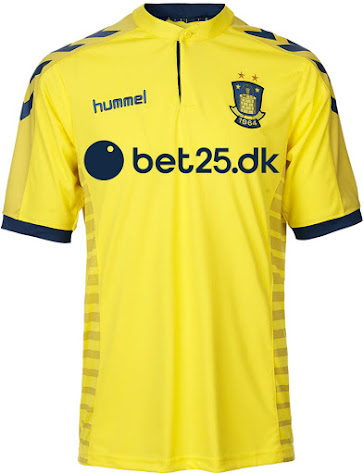
8th-highest-drawing Nordic team – Brøndby IF (Brondby, Greater Copenhagen, Denmark)…
From 27 Sept. 2015, VIDEO: Brondby supporters unveil gladiator-themed tifo at New Firm Derby (thescore.com)

Photo credits above -
2015-16 Brøndby home jersey, photo unattributed at 3.bp.blogspot.com. Aerial shot of Brøndby Stadium, image from Bet25/TDC: Nye services med WiFi på Brøndby Stadion | brondby.com (youtube,com video uploaded by Brøndby IF). Brøndby fans’ tifo at Brøndby Stadium [Sept. 2015], photo unattributed from z6.invisionfree.com/UltrasTifosi/ar/t33260.htm. [September 2015] 2 photos of…Brøndby fans’ giant banners depicting: Gladiator-in-coliseum-brandishing-severed-lion’s-head [the lion being their rivals' FC København's symbol], photo unattributed at dr.dk/sporten; 2nd photo, by Lars Ronbog/ Frontzone Sport/ Getty Images via thescore.com.
…
9th-best-drawing Nordic team – IFK Norrköping (Norrköping, Sweden)…
IFK Norrköping: 2015 Allsvenskan champions.
From UEFA.com/news, from 31 Oct. 2015, by Sujay Dutt, Norrköping defy the odds to lift Swedish title.

Photo credits above -
2016 IFK Norrköping home jersey, photo by IFK Norrköping at ifkshop.se/webshop. Aerial view of central Norrköping, photo by Göran Billeson at lansstyrelsen.se. Aerial shot of Östgötaporten, photo by M and F Foto at mfproject.com/norrkopingsidrottspark/gallery. Norrköping supporters with flags and scarves, image from video at fotbolldirekt.se/2015/09/06/video-peking-ultras-om-succeinsamling-for-flyktingar-samlat-in-55-00. 2015 top Allsvenskan scorer, IFK Norrköping FW Emir Kujović…1st photo by Nils Petter Nilsson/Ombrello/Getty Images Europe via zimbio.com; 2nd photo (celebrating with teammmates), photo unattributed at media2.sillyseason.se. Shot of Norrköping coach Jan Andersson celebrating with trophy, photo by Getty Images via uefa.com. Shot of Norrköping players celebrating with trophy, photo by Janerik Henriksson/TT at dn.se/sport/fotboll/norrkoping-ar-allsvenska-mastare-2015.
…
10th-best-drawing Nordic team – Viking FK (Stavanger, Norway)…

Photo and Image credits above -
2016 Viking FK home jersey, illustration by futhead.com. Panoramic view of Stavanger, photo unattributed at kayak.com/Stavanger-Hotels. Preikestolen (Pulpit Rock), which is 16 miles from Stavanger, photo by Terje Rakke/Nordic Life/Regionstavanger.com at visitnorway.com/stavanger-region. Aerial view of Viking Stadion by Viking FK, here. Viking fans with flags waving, photo by Lars Idar Waage at dagsavisen.no/stavanger.
…
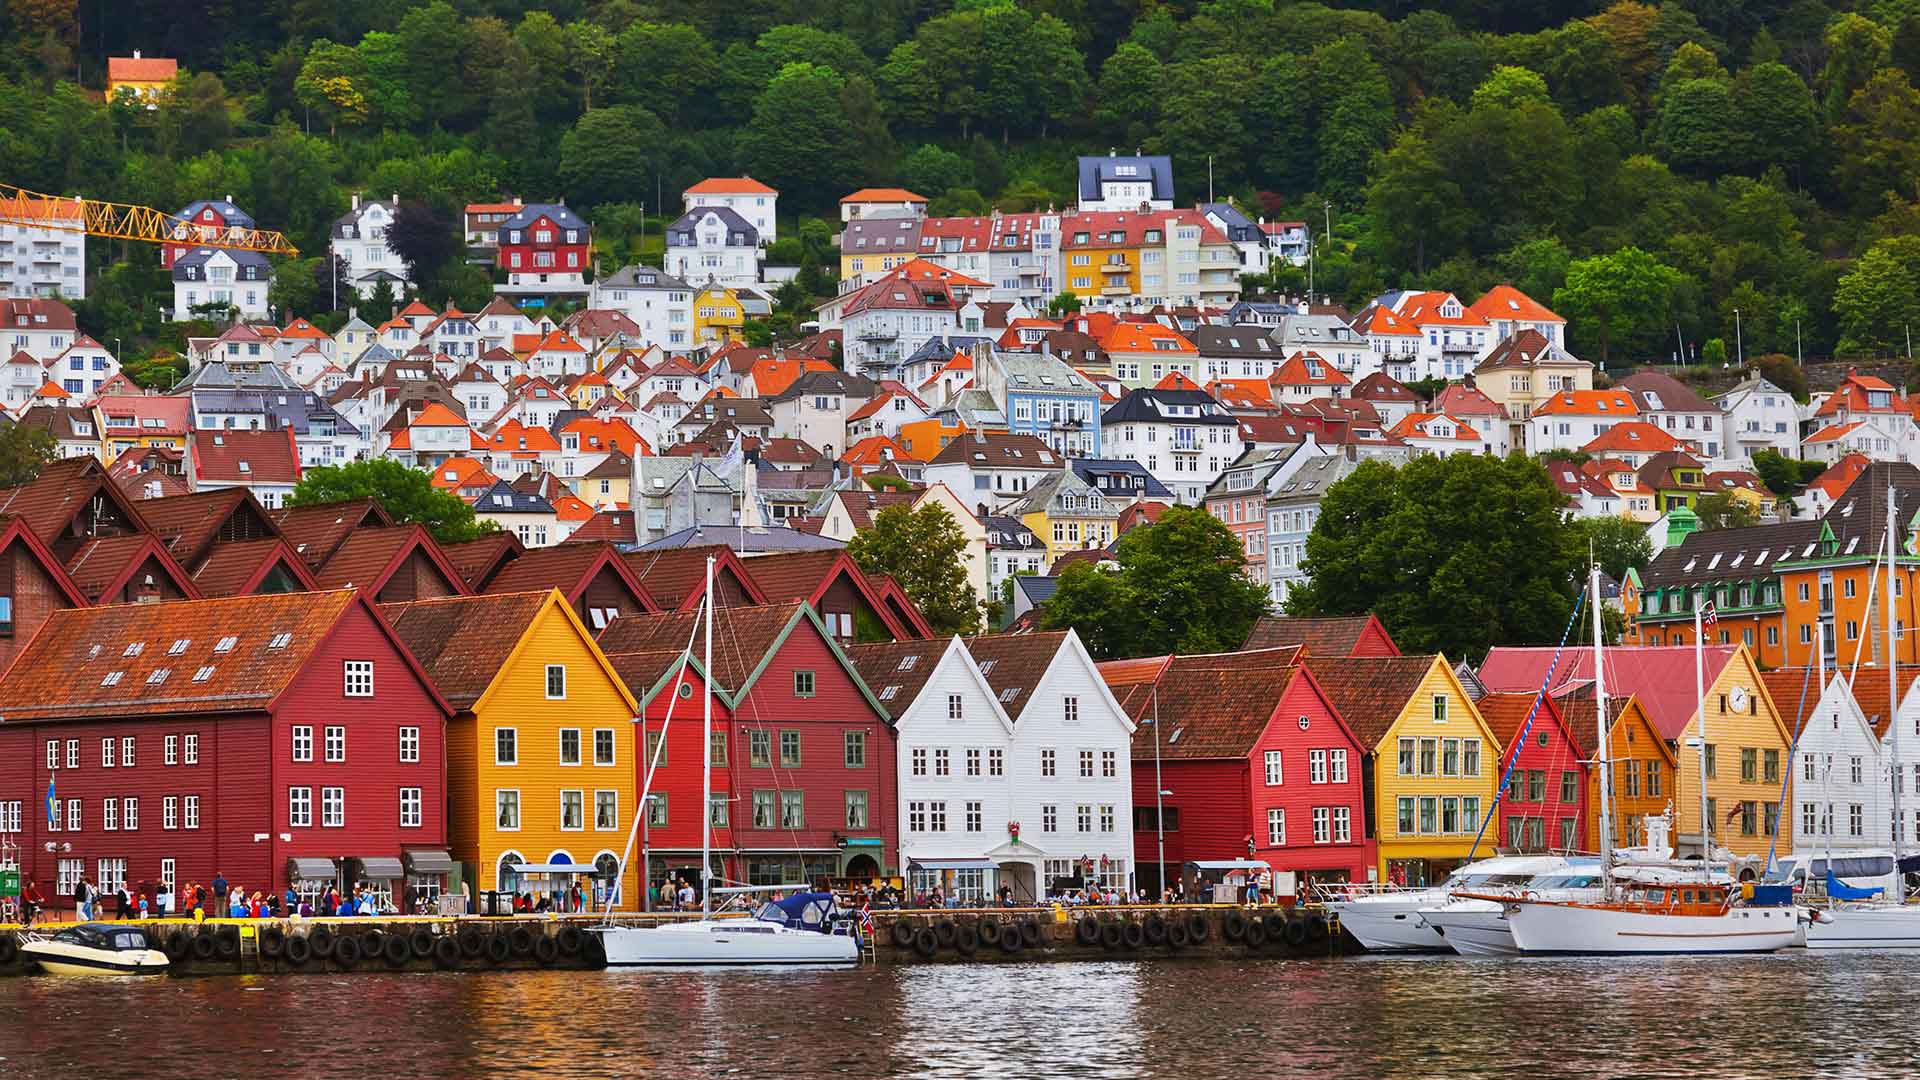
11th-best-drawing Nordic team – SK Brann (Bergen, Norway)…

Photo credits above -
2016 SK Brann home jersey, photo by SK Brann at shop.brann.no/produkter/drakter/2016-hjemmedrakt-lang-arm. Panoramic view of Bergen, photo unattributed at azamaraclubcruises.com/files/bergen-norway.jpg. View of Bergen city centre from a nearby hill, photo by Aqwis at File:SkansenSeptember2007 2.jpg (commons.wikimedia.org). Hanseatic commercial houses in Bryggen [old Bergen], photo unattributed at nordicvisitor.com/images/norway/bryggen-bergen-norway.jpg. Aerial view of Brann Stadion, photo by valrag at File:Brann stadium.jpg (commons.wikimedia.org). SK Brann supporters group Bergens Blade Gutter’s pyro/tifo from 14 April 2014, photo from their Twitter.com page at tw.google4cn.com/BGG_08/media.
…
12th-best-drawing Nordic team – Vålerenga IF (Oslo, Norway)…

Photo credits above -
2016 Vålerenga home jersey, photo unattributed at a soccer-jersey-site-that-never-credits-sources. Aerial view of Oslo in summer, photo unattributed at telegraph.co.uk/jpg [from this article, at Aerial view of Oslo in the evening, photo unattributed at visitnorway.com/Summer-holidays-in-Norway. Aerial view of Ullevaal Stadion, photo by John Christian Fjellestad at panoramio.com, and at File:Ullevål Stadium from air.jpg (commons.wikimedia.org). Vålerenga fans with scarves held up, photo unattributed at tipsfotball.com/.jpg.
___
Big Thanks to ecst.se/fotboll, for the list of all Nordic teams' attendances (2015 or 2014-15), at a Den nordiska publikligan [The Nordic Attendances] (ecst.se/fotboll). (This is where I got the idea for this map-and-post.)
Thanks to Soccerway for Denmark attendance figures.
Thanks to NormanEinstein at File:Norwegian Sea blank map.png (commons.wikimedia.org).
Thanks to the contributors at the following Wikipedia pages…
-Sweden’s top flight…2016 Allsvenskan / 2nd level: 2016 Superettan.
-Denmark’s top flight…2015–16 Danish Superliga / 2nd level: 2015-16 1. division (Denmark).
-Norway’s top flight…2016 Tippeligaen / 2nd level: 2016 1. divisjon.
-Finland’s top flight…2016 Veikkausliiga.
Largest metropolitan areas in the Nordic countries.
List of [3 largest] metropolitan areas in Sweden [Stockholm, Malmo, Gothenburg].
Regions of Norway.
Lands of Sweden.
Provinces of Finland.
Subdivisions of the Nordic countries.
Thanks to distancefromto.net.
Thanks to the supporter groups sites (plus one official-club-site) where I found cool tifo/supporter-made-atmosphere photos within the stadiums..
AIK Fotboll supporter-site: jojjesplejs.com.
Malmö FF supporter-site: mff-familjen.se.
Djurgården supporter-site: jarnkaminerna.se.
IFK Göteborg official site: ifkgoteborg.se/In-English/Welcome.
SK Brann supporters’ group Bergens Blade Gutter’s Twitter.com page at tw.google4cn.com/BGG_08/media.
Thanks to Anders Skoog via his brother LG, at LG Skoog’s blog at Runnersworld.se – for the nice photo of Hammarby Ultras/Hammarby IF supporters at the Tele2 Arena (aka Nya Soderstorm), here.
And a big Thank You to all who contributed at the far-ranging z6.invisionfree.com/UltrasTifosi messageboard/forum site, at z6.invisionfree.com/UltrasTifosi/[Scandinavia], for the awesome photos.


.jpg)
.jpg)
.svg)