
2017-18 Football League One (3rd division England): map w/ 16/17-crowds-&-finish + titles-&-seasons-in-1st-division
…
…
By Bill Turianski on 18 August 2017; twitter.com/billsportsmaps.
Links…
-2017–18 EFL League One (en.wikipedia.org).
-Table, fixtures, results, attendance, stats…LEAGUE ONE [Summary] (soccerway.com).
-Sky Bet League One 2017 – 2018 [kits] (historicalkits.co.uk).
-League One 2017-18 season preview (by Lawrence Ostleer at theguardian.com/football/blog).
A brief re-cap of 2016-17 League One [the 3rd division]…
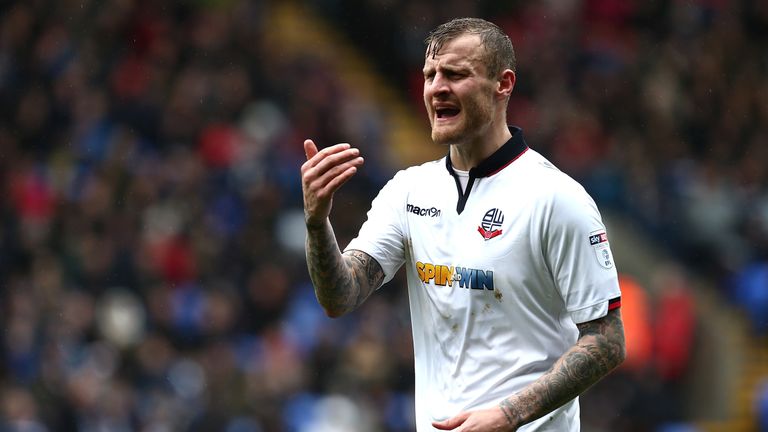
Promoted to 2nd Div…Sheffield Utd, Bolton Wanderers, Millwall {see this post: 17/18 EFL Championship, featuring: Sheffield Utd, Bolton, Millwall}.
Relegated from the 2nd division down to the 3rd division are…Blackburn Rovers, Wigan Athletic, Rotherham United.
Promoted up from the 4th division and into the 3rd division are the four clubs profiled below…
-
Below: the 4 promoted clubs for the 2017-18 3rd division
(Portsmouth, Plymouth Argyle, Doncaster Rovers, Blackpool)…
Portsmouth won the 2016-17 League Two title, and now return to the 3rd division after being stuck in the 4th division for 4 seasons. Plymouth Argyle won automatic promotion as 2nd-place-finishers and return to the 3rd division after being stuck in the 4th division for 6 seasons. Doncaster Rovers won the third automatic promotion as 3rd-place-finishers and bounce straight back to the 3rd division. The fourth promotion place went to Blackpool, who won the 2017 League Two play-off Final at Wembley, defeating Exeter City 2-1; Blackpool also bounce straight back to the 3rd division.
-
• Portsmouth FC.
Est. 1898. Nickname: Pompey. Colours: Blue shirts, White pants, Red socks. Location: Portsmouth, Portsea Island, Hampshire, situated (by road) 22 miles (36 km) SE of Southampton; and Portsmouth is situated (by road) 73 miles (118 km) SW of London. Population of Portsmouth: city-population: around 115,000 {2011 census}; urban-area-population: around 855,000 [Southampton, Portsmouth, Eastleigh, Gosport, Fareham, Havant, Horndean]. Portsmouth, along with Southampton and adjacent towns, are part of the South Hampshire Built Up Area, which is the 7th-largest Urban Area in the UK {en.wikipedia.org/wiki/List_of_urban_areas_in_the_United_Kingdom}.
Question: Why is Portsmouth FC nicknamed Pompey? Answer: “Portsmouth Football Club are nicknamed ‘Pompey’, a name which it shares with the English port city of Portsmouth and its historic naval base. The ‘Pompey’ nickname is thought most likely to originate from the historic nautical location known as Portsmouth Point, which is commonly abbreviated to ‘Po’m. P.’ when written in shortened form into a ships logbook.” {-excerpt from en.wikipedia.org/wiki/Portsmouth_F.C..} Portsmouth was the traditional home base of the British Navy, all through the years of Empire, and the naval presence there is still strong. It is a very working-class town, as opposed to the more upper-middle class Southampton, 15 miles northwest. Portsmouth’s colours are a nod to its naval presence and its military heritage, with the blue of their jersey symbolizing the British Navy, and their red socks represent the British Army (the home of the British Army is in Aldershot, Hampshire, 45 miles up the road from Portsmouth).
Portsmouth FC were formed in 1898, and joined the Southern League the following year. As of 2017-18, Portsmouth have played 33 seasons in the 1st division, and 91 seasons in the Football League/Premier League. Portsmouth were a non-League/Southern League side for a little over two decades. Then in 1920-21, Portsmouth, along with the entire 1919-20 Southern League Division One, joined the Football League, comprising most of the new Third Division. It took Portsmouth 7 seasons to win the two promotions that put them in the First Division, which Pompey first joined in 1927-28. In this time period, Portsmouth made it to two FA Cup finals, losing to Bolton 2-0 in the 1928 final, and losing to Manchester City 2-1 in the 1934 FA Cup final. Their third FA Cup final came in 1939, and this time Portsmouth were the victors, beating a heavily-favoured Wolves team 4-1, this despite the fact that Portsmouth were battling relegation, and ended up finishing only in 17th place in the league that season.
Back-to-back English titles for Portsmouth (1949 & 1950).
In 1946-47, with the resumption in Football League play following World War II, Portsmouth FC benefited from the town’s naval base…“Portsmouth capitalised on the footballers called up to serve in the Royal Navy and Royal Marines in the war years and recruited some of them. In this way, Portsmouth had the pick of some of the best.” {-excerpt from en.wikipedia.org/wiki/Portsmouth_F.C..} This was the start of Portsmouth’s glory days. Former chief scout Bob Jackson was appointed manager of Portsmouth in May 1947. The squad, which was filled with no recognised stars and very few international players, began to gel. Coming off a 12th-place finish in the first post-War season (1946-47), Pompey finished in 8th place with Jackson at the helm (1947-48). Then it all came together in 1948-49: Jackson had Pompey play in the W-M formation that Herbert Chapman (and his assistant coach Charles Buchan) had developed at Arsenal a decade earlier. Portsmouth had the best defense (1.0 goals allowed per game), and also led the league in scoring (84 goals/2.0 avg), with all 5 forwards racking up double figures and Portsmouth-born Outside-Right Peter Harris scoring 18, and Scottish Inside Forward Duggie Reid scoring 17. Portsmouth won the title with 2 games to spare, and ended up 5 points ahead of Manchester United. Then Portsmouth repeated as champions in 1949-50, though by a much tighter margin. Portsmouth had the second best defense (.90 goals allowed per game, behind 7th-place-finishers Blackpool’s .83 avg). And four other teams scored more. Portsmouth barely edged out Wolves for first place, thanks to a better goal-average of about 0.4 (but Portsmouth would still have won the title if the more-equitable goal-difference tie-breaker was used back then). Top scorer for Portsmouth’s repeat title-win was Kent-born Inside Forward Ike Harris, with 17 goals.
(In the post-War era, since Portsmouth’s back-to-back title wins, only 4 other clubs have won two straight titles: Manchester United [six times], Wolverhampton, Liverpool [three times], and Chelsea.)
Bob Jackson left Portsmouth in 1952, to manage Hull City. Portsmouth stayed competitive for the next few seasons, but by the late 1950s, their title-winning and locally-nurtured squad had aged, and were not replaced with enough quality players to keep the team in the top tier. Portsmouth were relegated out of the 1st division in 1959 (the same season that longtime Left Half Jimmy Dickinson played in his 500th game for Pompey). For the next 44 years (1959 to 2003), the club would only play only one season in the top flight (in 1987-88).
-From the Equaliser blog, 1940s Month: Bob Jackson’s Pompey (written on 9 Feb.2011 at equaliserblog.wordpress.com).
Portsmouth: back-to-back titles (1949 & 1950 First Division titles).

Photo and Image credits above – Old Portsmouth kits, illustrations from historicalkits.co.uk/Portsmouth. Bob Jackson, photo by Popperfoto/Getty Images via gettyimages.com. Peter Harris, photo by Daily Mirror at mirrorfootball.mediastorehouse.com/peter-harris/print. Duggie Reid, photo unattributed at frattonparkhomeofportsmouthfc.wordpress.com/legends. Portsmouth 1948-49 tinted photo (team photo), unattributed at uttonfromuddersfield.blogspot.com.
Portsmouth, 2003 to 2010: 7 seasons in the Premier League, including one great escape (in 2006), and their second FA Cup title (in 2008).
Portsmouth, under former Bournemouth and West Ham manager Harry Redknapp, won promotion into the Premier League in 2003. Their ramshackle home cauldron, Fratton Park, was the smallest home-venue in the league back then (capacity 20,600). Pompey had a 7-year-spell in the Premier League. In their 3rd season there (2005-06), Portsmouth were almost relegated, but pulled off one of the great escapes in Premier League history, going from the bottom of the table and 8 points down in the relegation zone in March, to safety and a 17th-place-finish, in the last 10 games. A last-gasp 30-yard dipping volley by MF Pedro Mendes v Man City on the 11th of March ignited a 6-wins-2-draws-2-loss finish in 05/06, and they escaped the drop with 4 points to spare. {Here is Mendes’ brace that day [via a tweet from @premierleague].}. The next season (06/07), Portsmouth finished 8 places higher, in 9th. Pompey were averaging 19.8 K and playing to 96 percent-capacity at their fortress, Fratton Park. Portsmouth finished as high as 8th place, in the following season of 2007-08. And they won their second FA Cup title that same season, beating 2nd-division side Cardiff City 1-0 at Wembley, thanks to a Kanu tap-in. This, after beating Manchester United at Old Trafford in the 6th round, thanks to a Glen Johnson goal-saving goal-line tackle-and-block, a Glen Johnson goal-saving line-clearing header, a Sylvain Distin goal-saving goal-line block, two David James full-stretch diving glove-tip-saves, and a Sully Muntari penalty conversion. {Video highlights: Manchester United 0-1 Portsmouth – 2008 FA Cup Quarter-Final (8 March 2008) (6:39 video uploaded by DCDJ18 at youtube.com).}
But boardroom graft and incompetence led to financial problems which were worsened by the 2009 global economic recession. So, due to automatic points deductions while being in administration, a cash-strapped Portsmouth suffered back-to-back relegations in 2012 (to the 3rd division), and in 2013 (to the 4th division). This happened amidst the messy and protracted supporters-trust-takeover-battle. In April 2013, Portsmouth became the largest supporter-owned club in England, after the Pompey Supporters Trust successfully gained possession of Fratton Park. Even as a 4th division side, Pompey saw little drop-off in support, and Portsmouth drew in the 15-16-K-range in League Two. But Portsmouth, now a parsimonious supporter-owned club, needed four seasons to get out of the 4th division, and it was former Chesterfield manager Paul Cook who led them out. In 2015-16, Cook took the reins at Portsmouth, bringing MF/playmaker Gary Roberts over from Chesterfield. But Pompey could not stay in the automatic promotion places, kept on dropping points by conceding late goals, and then flamed out in the 2016 play-off semifinals, losing to Plymouth. The following season, Portsmouth fielded a squad that did catch fire late on. Pompey moved into the automatic promotion spots by March 2017, and won the 4th division crown on the last day of the season, pipping Plymouth for the title. 3 Portsmouth players made the 2017 League Two Team of the Year (GK David Forde, CB Christian Burgess, and CB Enda Stevens). Portsmouth had the best defense in the 4th division (40 goals allowed/0.86 avg), and the second most prolific offense (with 79 goals; only Doncaster scored more).
Then, 6 weeks after Portsmouth’s promotion, Paul Cook up and left – for a fatter contract at Wigan. It was during this time that Portsmouth Supporters Trust voted to sell their shares to an investment company headed by former Disney chairman Michael Eisner. The rationale for most of the shareholders’ ‘yes’ votes was this…Portsmouth would need a considerable cash outlay to fuel any more promotion-campaigns, and would probably not be able to do so as a supporter-owned club. Plus Fratton Park needs some serious upgrades to avoid closure – like £4.1m worth {see this}. In June 2017, former Millwall and Wolves manager Kenney Jackett was hired as Portsmouth manager, a choice widely applauded, as Jackett has had real success in the 3rd division (see next paragraph)…
Manager of Portsmouth: Kenny Jackett (age 55; born in Watford). Jackett was a DF/MF who played in 11 seasons for his home town club, Watford (1980-90/337 league app/35 goals). Jackett has previously managed: Watford (1996-97), Swansea (2004–07), Millwall (2007–13), Wolverhampton (2014-16), and Rotherham (2016). Jackett has gotten two of his teams promoted to the 2nd division: Millwall in 2010, and Wolves in 2014.

Photo and Image credits -
Portsmouth 16/17 jersey, photo from pompeystore.com. Portsmouth Harbour, photo unattributed at newhistorian.com. Old Portsmouth viewed from Spinnaker Tower, photo by eNil at File:Old Portsmouth.jpg (commons.wikimedia.org). Fratton Park (aerial view, with new Tesco supermarket next door), by Shaun Roster via twitter.com/teamlocals. Fratton Park (aerial view), by 1080pfc at mobile.twitter.com/1080pfc jpg. Aerial view of Fratton Park main entrance, photo by PA at telegraph.co.uk/sport/football. Fratton Park main entrance, photo by manygameshaveiseen.blogspot.com. Facade at Fratton Park, photo from Paul Greer at bbc.co.uk/blogs/5live/2011/04/the-rjs-the-south-of-england… . David Forde, screenshot from video uploaded by officialpfc at youtube.com. Christian Burgess, photo by TSG Photo/Rex/Shutterstock via dailymail.co.uk/football. Enda Stevens, image from screenshot of video uploaded by officialpfc at youtube.com jpg. Gary Roberts, photo by Joe Pepler at portsmouth.co.uk/football. Promotion/league title-winners-celebration, screenshot from video uploaded by rjellcome at youtube.com jpg.
…
• Plymouth Argyle FC.
Est. 1886. Nicknames: Argyle, the Pilgrims. Colours: Dark-Green-with-Black (which is in honor of the colours of the flag of Devon). Location: Plymouth, Devon, situated (by road) 45 miles (72 km) SW of Exeter; and Plymouth is 237 miles (382 km) SW of London. Population of Plymouth: around 264,000 {2016 estimate}; urban-area-population: around 260,000 {2011 census}, making Plymouth the 32nd-largset Urban Area in the UK {en.wikipedia.org/wiki/List_of_urban_areas_in_the_United_Kingdom}.
Plymouth Argyle, located near the south-western corner of England, are one of the most isolated Football League clubs…
Probably the biggest hurdle Plymouth Argyle faces as a team in the Football League is the sheer isolation that Plymouth has with the rest of the teams in the League. There is only one League team close by to Plymouth, and that is Exeter City, which is 45 miles away. And Plymouth, way out on the south-west coast in Devon, is a whopping 237 miles down the road from London. Which means that it is further away from London (by road) than almost every other League club, including every Northern club except for Carlisle, Newcastle, Blackpool, Burnley, Accrington, and Morecambe. (Plymouth is only about 10 miles or so by road closer to London than Newcastle or Blackpool or Burnley are.)
Plymouth Argyle joined the Football League in 1920, along with the entire 1919-20 Southern Football League Division One. 15 of those 22 teams in that 1919/20 Southern League D1 have made it to the first division since then, including 5 current [2017-18] Premier League clubs (Brighton, Crystal Palace, Southampton, Swansea, Watford). But Plymouth Argyle is not among them. In fact Plymouth Argyle have played the second-most 2nd division seasons without ever winning promotion to the top flight – 40 seasons in the 2nd division. Only Port Vale has played more 2nd division seasons without ever winning promotion to the first division (41 seasons). {Source: see this list, myfootballfacts.com/ClubLeagueHistorySummary.}
The last time Plymouth Argyle were in the second division was a 6-season spell there from 2004-10, when Argyle drew primarily in the 13-K-range. They went down to the 3rd tier in May 2010 with serious financial problems, and that turned into a crisis in late 2010, with £760,000 in unpaid tax to HM Revenue & Customs. Plymouth went into administration in February 2011, with a 10 points deduction, and then they suffered their second-straight relegation in May 2011, down to the 4th division. The local council saved Plymouth by buying their ground, Home Park, in October 2011. At this point, new ownership came in, in the form of an investment/development company called the Akkeron Group, headed by James Brent. By this time (2011-12), support had dwindled to 6.9 K, and Plymouth escaped relegation out of the League by only a 2-point-margin, finishing in 21st place in League Two. The next season was an even closer relegation battle as Argyle escaped relegation by just a single point, again finishing in 21st. Argyle improved a great deal the next year to 10th place (in 2013-14). In 2014-15 Argyle made the play-offs as 7th place finishers, but lost to Wycombe in the first round. The next season (2015-16), under new manager Derek Adams, Plymouth improved enough again to be in the automatic promotion places for some of the season, but fell into the play-off places and finished in 5th, and then were beaten by AFC Wimbledon in the 2015 League Two play-off Final, 2-0. By this time, crowds had increased a couple thousand at Home Park, up to 8.7 K. In 2016-17, Plymouth Argyle improved once again, and led League Two for much of season, but again fell away – but only marginally, and Argyle ended up finally winning promotion back to the 3rd division, finishing in 2nd place, and drawing 9.6 K. An indication of the positive vibe down there on the Devon coast is that in 2016-17 Argyle drew one thousand more than they were drawing in 2011-12, when they went down to the 4th tier. It took Plymouth Argyle 6 seasons to get out of the 4th division, and they did so under Scottish manager Derek Adams.
Manager of Plymouth: Derek Adams (age 42; born in Glasgow, Scotland). Derek Adams played as a midfielder, primarily with Motherwell and a then-second-division Ross County. In his second spell at Ross County, Adams was player-manager (2007-10), then was briefly an assistant coach at Hibernian in 2010-11. He returned to Ross County as manager 6 months later (May 2011), and led the tiny Dingwall, Highlands-based club to its first-ever promotion to the Scottish 1st division. (Dingwall, Highland is a town of only around 5,400, located a few miles west of Inverness, and 180 miles N of Glasgow by road.) Then Ross County overachieved in the Scottish top flight, finishing in 5th place in 2012-13, and in 7th in 2013-14. Adams stepped down from the Ross County job in August, 2014, took a year’s hiatus, and then signed on as Plymouth Argyle manager in June 2015. A month later he brought over a Ross County play-maker/attacking-midfielder: Graham Carey (see photo/caption below). Plymouth were much improved in 2015-16, with Adams at the helm, and Carey was voted Player of the Year by Argyle fans in 2015-16, but they fell short of promotion. The following year (2016-17), Plymouth shot out of the gate and were at the top of the table by September. Graham Carey had another fine season, ending up with 14 league goals and 15 assists (second-most assists, behind only Accrington MF Sean McConville). Carey, and teammate Sonny Bradley (see photo/caption below), a 25-year old centre-back who scored 7 league goals, both made the 2017 League Two Team of the Year. On Monday 17 April 2017, Plymouth Argyle beat Newport County 6-1 in front of 13,971 at Home Park, and Plymouth Argyle clinched automatic promotion to the 3rd division, with 3 games to spare.

Photo and Image credits -
Plymouth Argyle 2016-17 jersey, illustration unattributed at footballkitnews.com. Aerial shot of Plymouth Harbour, photo unattributed at images.archant.co.uk. Plymouth Harbour, photo by devoncam.co.uk via pinterest.com jpg. Home Park, aerial photo unattributed at pinterest.com jpg. Argyle fans with giant PAFC/Green Army banner, photo by Getty Images via express.co.uk/football. Sonny Bradley, photo unattributed at sportskeeda.com/fa-cup-2016-17-liverpool-vs-plymouth-player-ratings. Graham Carey, photo from pafc.co.uk. Promotion-celebration, photo unattributed at upsu.com/media. Derek Adams, photo by Action Images via theleaguepaper.com.
…
• Doncaster Rovers FC.
Est. 1879. Nicknames: Donny; the Rovers. Colours: Red-&-White hoops [horizontally-striped jerseys]. Location: Doncaster, South Yorkshire, situated (by road) 23 miles (37 km) NE of Sheffield; and Doncaster is situated (by road) 177 miles (285 km) N of London. Population of Doncaster: around 109,000 {2011 census}.
Doncaster fanzine/podcast, Popular Stand (‘a football fanzine for the likes of Doncaster’).
-Great match report-with-photos from Doncaster’s promotion-clinching win in week 41, from a Mansfield Town fan, Doncaster Rovers 1 v Mansfield Town 0 – EFL League 2 (the66pow.blogspot.com)
Counting 2017-18, Doncaster Rovers have played 83 seasons in the Football League.
Doncaster have never played in the 1st division, but have played 16 seasons in the 2nd division, including 5 seasons in the recent past (2008-12; and in 2013-14). But for the majority of its time, Doncaster have been a lower-League club (with 35 seasons in the 3rd division, and 32 seasons in the 4th division). Doncaster Rovers were first elected to the Football League in 1901, but only lasted 2 seasons. They won re-election in 1903, but failed to be re-elected after a single season (1903-04). They had to wait two decades before returning to the League: Doncaster were elected back to the Football League in 1923 (replacing Stalybridge Celtic), and joined the Football League Third Division North in 1923-24. This time, Doncaster stayed in the League for a little over 8 decades. Their heyday was in the early 1950s, when, as a just-promoted-to-the-2nd-division side, in 1950-51, Doncaster drew a peak 20.8 K and finished in 11th. Donny played 8 seasons in the 2nd tier in the 1950s, but would not return to the second division for over half a century (51 years). After bouncing between the 3rd and 4th tiers all through the 1960s, ’70s, ’80s, and ’90s, Doncaster were relegated out of the 4th division and into non-League football in 1997-98.
After 5 seasons in non-League football, in the 5th division/Conference National, Doncaster won promotion back to the Football League in 2003. That was the first season that there were 2 non-League teams promoted from the 5th division. And in the new Conference play-off Final of 2003, at the Britannia Stadium in Stoke, in front of 13 thousand, Doncaster beat Dagenham & Redbridge 3-2 in aet, with the winner scored in the 110th minute by Francis Tierney. Since then, Doncaster have remained in the League, and have had two spells in the 2nd division: a 4-season spell from 2008–09 to 2011–12, and in 2013–14. During this time period, as a second-division-side, Doncaster were drawing in the 9-to-10-K-range, at their 15.2-K-capacity ground, Keepmoat Stadium (which opened in 2007 and is owned by the club). But it all came unstuck in their most recent stint in the second tier: Doncaster ended up suffering 2 relegations in 3 seasons, and thus found themselves in the 4th division for 2016-17, with home crowds shrunk over four thousand, to 5.5 K. The thing about Doncaster is, they always seem to have just been relegated or promoted…and in fact, Doncaster have changed divisions 5 times in 6 seasons (2012: relegated to 3rd Div/ 2013: promoted to 2nd Div/ 2014: relegated to 3rd Div/ 2015: remained in 3rd Div/ 2016: relegated to 4th Div/ 2017: promoted to 3rd Div).
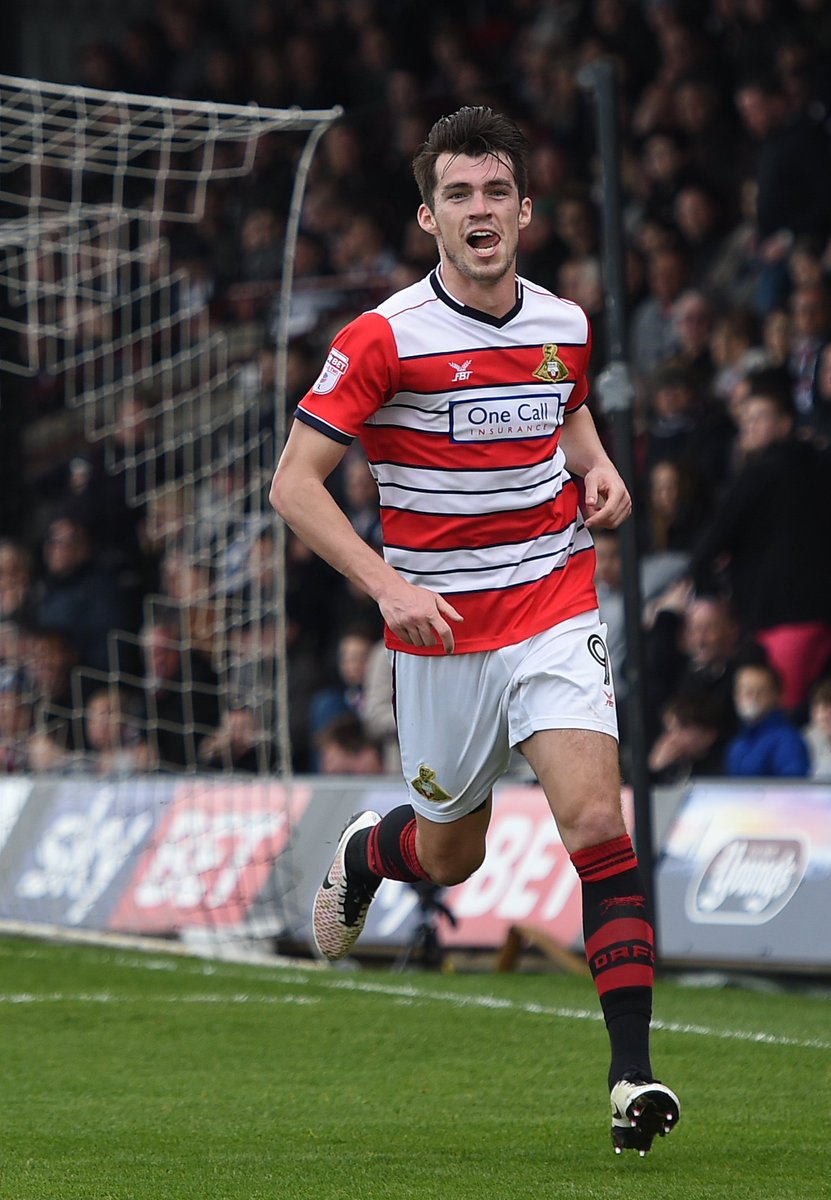
Manager of Doncaster: Darren Ferguson (age 45; born in Glasgow, Scotland). In October of 2015, Doncaster had hired Darren Ferguson as manager, when Rovers were hovering right above the relegation zone in the 3rd division. But Ferguson could not improve things, and Rovers went down. However, things changed in 2016-17, with Darren Ferguson’s first full year in charge at the Keepmoat Stadium. Consistency became their hallmark, and Doncaster did not lose two straight league matches all through the first 41 games of the season. On 8th April, 2017, with a 1-0 home win versus nearby rivals Mansfield Town, before 9.9 K, Doncaster clinched an immediate return to the 3rd tier (see photos and captions below). They did this with an impressive 5 games to spare. Darren Ferguson, son of Sir Alex, has now led his teams to promotion on 4 separate occasions: in 2008, 2009, and 2011 with Peterborough, and now in 2017 with Doncaster. Darren Ferguson was named League Two manager of the year. Two Rovers players (see photos and captions below) were named to the 2017 League Two Team of the Year: 36-year-old captain and attacking midfielder James Coppinger, and 25-year-old striker John Marquis. James Coppinger has been with Doncaster for 13 years now (since 2004), and the North Yorkshire/Teeside-born Coppinger has amassed over 500 appearances for Doncaster Rovers (most ever). To make the League Two Team of the Year at 36 years old is a remarkable accomplishment. John Marquis, who previously had 6 different loan spells as a Millwall player, was League Two joint-top-scorer (along with Barnet’s John Akinde), scoring 26 goals (and 2 assists). The 16/17 Doncaster Rovers had the most potent offense in the 4th division, scoring 85 goals (1.84 avg.). In addition to John Marquis, 3 other Rovers players scored in double figures: Tommy Rowe (13 goals/11 assists), Andrew Williams (11 goals/1 assist), and James Coppinger (10 goals/13 assists).

Photo and Image credits -
Doncaster 16/17 jersey, photo unattributed at soccer365.com. Keepmoat Stadium, aerial photo unattributed at pinterest.com. James Coppinger, photo by Lynne Cameron/Getty Images Europe via zimbio.com. John Marquis, photo from twitter.com/johnmarquis09 jpg. Goal (T. Rowe), photo by Davy Lamp at the66pow.blogspot.com/2017/04/doncaster-rovers-1-v-mansfield-town-0. Doncaster fans’ pitch invasion celebrating promotion: 1st photo [Doncaster 1-0 Mansfield Town, 8 April 2017], photo by PA via thes*n.co.uk; 2nd photo: by Davy Lamp at the66pow.blogspot.com. Darren Ferguson saluting Donny fans as Doncaster clinches promotion, photo by PA via yorkshirepost.co.uk/football.
…
• Blackpool FC.
Est. 1887. Nicknames: the Tangerines; the Seasiders. Colours: Tangerine [pale Orange] jerseys and White pants. Location: Blackpool, west Lancashire, situated (by road) 55 miles (86 km) N of Liverpool; and situated (by road) 248 miles (399 km) NW of London. Population of Blackpool: around 142,000 {2016 estimate}.
-
Blackpool, winners of the 1953 FA Cup Final (aka the Matthews Final) (Blackpool 4-3 Bolton)…
1953 FA Cup Final (en.wikipedia.org).

Photo and Image credits above -Stanley Matthews, photos: circa late 1940s, Matthews faking out defender, photo unattributed at dailymail.co.uk/football. 1953 tinted photo of Matthews in 1953 FA Cup Final, image unattributed at dailymail.co.uk/football; Matthews back at Stoke circa 1963, photo by PA at dailymail.co.uk/football.
Stan Mortenson: tinted print [ca. early 1950s], unattributed at ebay.com; 2nd photo (b/w), photo by PA via gettyimages.fi. Blackpool and Bolton 1953 badges from historicalkits.co.uk. Matthews dribbling in 1953 FA Cup final, photo by PA Wire/Press Association Images via dailymail.co.uk. Stan Mortensen scoring 2nd of 3 goals in 1953 FA Cup Final, photo by Popperfoto/Getty Images at theguardian.com/football. 2 shots of Matthews with winning cross (to Bill Perry in the 92nd minute): screenshot from video uploaded by Soccertackle at youtube.com; 2nd photo of Matthews’ cross to Perry, photo by PA via dailymail.co.uk/football. 2 shots of winning goal scored by Bill Perry, 1st photo by Popperfoto/Getty Images via gettyimages.de; 2nd photo of Bill Perry’s winning goal, by PA via dailymail.co.uk/football. Blackpool 1953 Cup final badge, photo by toffs.com/[Blackpool]. Captain Johnston, and Matthews, hoisted in celebration by Blackpool teammates, photo unattributed at intosport.co.uk/blackpool-1953-fa-cup-final-team-photo-memorabilia. Blackpool 1953 victory parade, photo unattributed at intosport.co.uk/blackpool-1953-fa-cup-final-open-top-bus-photo-memorabilia..
…
Manager of Blackpool: Gary Bowyer (age 46; born in Manchester).
Blackpool FC supporters’ boycott of Blackpool FC owners (the Oystons)…
Blackpool began fielding a threadbare squads which eventually saw back-to-back relegations to the 4th division by May 2016. Going back 7 years, when Blackpool had won promotion to the Premier League (in May 2010), there were over 35,000 Blackpool fans at Wembley, to watch their thrilling 3-2 League Championship play-off final victory over Cardiff City (total attendance that day was 82,244). This time, in Blackpool’s 2017 League Two play-off final versus Exeter City (which Blackpool won 2-1), there were only about 5,000 Blackpool supporters there (total attendance that day was 23,380). Now granted, a 4th-division play-off final at Wembley will invariably draw much less than a 2nd division final there would. But there should have been at least 40 K there, not the 23.3 K that were there.
And Blackpool’s home crowds at Bloomfield Road have dropped from 14.2 K to 3.4 K – a more than 10-thousand-per-game drop-off, in just 4 years. For context here are the last 7 seasons of home average attendance for Blackpool: 15.7 K in 2010-11 [1st Div]; 12.7 K in 2011-12 [2nd Div]; 13.9 K in 2012-13; 14.2 K in 2013-14 [2nd Div]; 11.1 K in 2014-15 [2nd Div]; 7.0 K in 2015-16 [3rd Div]; 3.4 K in 2016-17 [4th Div].
What changed? The answer is simply this: the absolutely poisonous atmosphere that the Oyston family has fomented up there on the Lancashire coast. A poisonous atmosphere which all began because the Oystons pocketed virtually all the millions in parachute cash after relegation out of the Premier League in 2011, and then went after fans who criticised their actions.
…“Oyston has had a poor relationship with Blackpool’s fans, mostly since the club’s relegation from the Premier League, due to a perceived lack of funding for the club’s stadium, playing staff and training ground. The relationship was described as being ‘at breaking point’ by Tim Fielding, the chair of the Blackpool Supporters Trust, in December 2014. Fielding resigned from his position the following month after the Oystons began legal action against him for comments he made on the internet, even though it was revealed that Karl Oyston had labelled Blackpool fan Stephen Smith a ‘massive retard’ and an ‘intellectual cripple’ in a text-message exchange two months earlier. The local newspaper, the Blackpool Gazette, subsequently decided to scrap Oyston’s weekly column ‘given such disgusting and offensive comments’. He was later charged with misconduct by the Football Association, a charge he appealed. The appeal was rejected by a tribunal, and he was given a ban from all footballing activities for six weeks and fined £40,000.” {-excerpt from en.wikipedia.org/wiki/Karl_Oyston.}
-From Medium.com, Most Blackpool fans will boycott Wembley, you should know why (by Peter Wells on 21 May 2017 at medium.com)
Here is quote about the boycott of the Wembley match…“There’ll be plenty of Oyston Out scarves in the ground,” Andy Higgins, a member of the Blackpool Supporters’ Trust, [said]. “Most of us think that if you’re going to go and finance that family, who are intent on suing supporters, you’re financing litigation. That’s when they went too far. Litigation against your own fans is beyond the pale.” {-quote from article written by Jacob Steinberg at theguardian.com/football.}
And as John Ashdown at the Guardian said, “That so few Blackpool fans – only just over 5,000 – were here to witness what should have been a celebratory occasion is testament to the depth of resentment against the Oyston family’s ownership of the club. This result will prompt mixed feelings for those on the Fylde coast who fear a victory for the team is a victory for the regime.” {-excerpt from Blackpool’s Mark Cullen sinks Exeter City in League Two play-off final, by John Ashdown on 28 May 2017 at theguardian.com/football}.

Photo and Image credits above -
16/17 Blackpool jersey, photo unattrributed at afcblackpool.co.uk. Blackpool Tower, photo by zergo512 at File:Blackpool tower from central pier ferris wheel.jpg (commons.wikimedia.org). Bloomfield Road, photo by Footyawaydays via lets-hang-on.com. Kelvin Mellor, photo by camerasport.photoshelter.com jpg. Brad Potts, photo by CameraSport/Getty Images via dailymail.co.uk/football. Empty seats at Wembley because of Blackpool supporter-boycott, photo by Daniel Storey at twitter.com/danielstorey85 jpg. Mark Cullen celebrating winning goal, photo by Getty Images via dailymail.co.uk/football.
___
Thanks to the following…
-Blank map of UK historic counties, by Nilfanion (using UK Ordnance Survey data), at File:United Kingdom police areas map.svg (commons.wikimedia.org).
-Blank relief map of Greater London, by Nilfanion (using UK Ordnance Survey data), at File:Greater London UK relief location map.jpg.
-Attendances from E-F-S site, european-football-statistics.co.uk/attn.htm.
-England – First Level All-Time Tables 1888/89-2015/16 (rsssf.com).
-Thanks to the contributors at en.wikipedia, at EFL League One (en.wikipedia.org).


.jpg)
.svg)