billsportsmaps.com

January 31, 2021

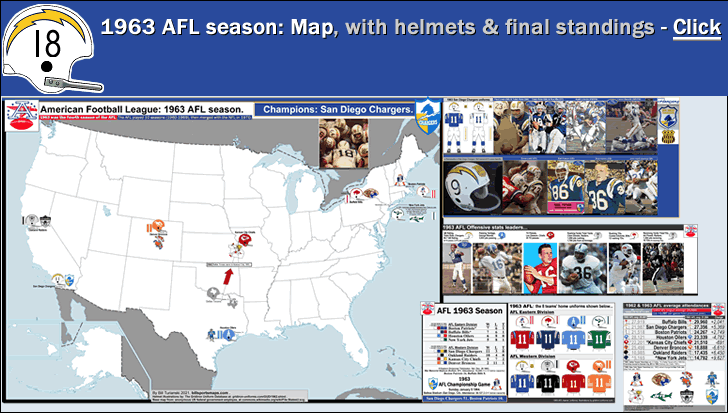
American Football League: 1963 AFL season, map with helmets/jerseys & final standings + offensive stats leaders + attendances. Champions: San Diego Chargers.

Filed under: AFL (gridiron football),AFL, 1963 map/season,Retro maps — admin @ 7:06 pm

afl_1963_4th-season_map_w-final-standings_o-stats-leaders_champions-san-diego-chargers_post_i_.gif
American Football League: 1963 AFL season, map with helmets/jerseys & final standings + offensive stats leaders; champions: San Diego Chargers


By Bill Turianski on the 31st of January 2021; twitter.com/billsportsmaps.

Links…
-1963 AFL season;
-1963 AFL Championship Game (en.wikipedia.org).
-1963 AFL season (pro-football-reference.com).
-1963 AFL uniforms (gridiron-uniforms.com).

The map… The map shows the primary helmets and jerseys worn by the 8 teams in the 1963 AFL, the fourth season of the American Football League. Also shown on the map page are the final standings of the 1963 AFL season, the Offensive leaders of the 1963 AFL season, and the average attendances of the 1963 AFL season (compared to the previous season).

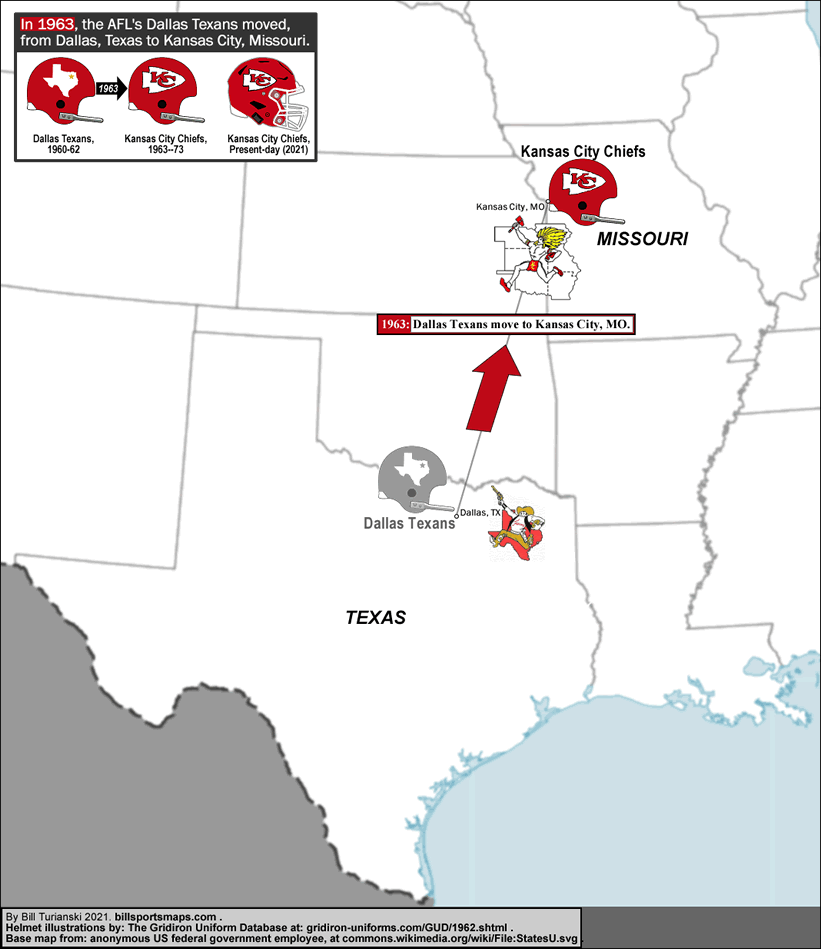
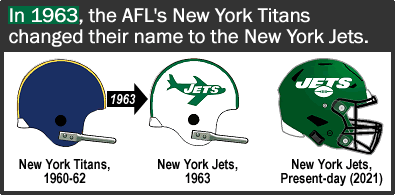
    Changes in AFL franchises in 1963. One team moved to new city and changed their name (Kansas City Chiefs); one team changed their name (New York Jets). Both these revamped franchises became instrumental in the ultimate success of the AFL, in its battle with the NFL…

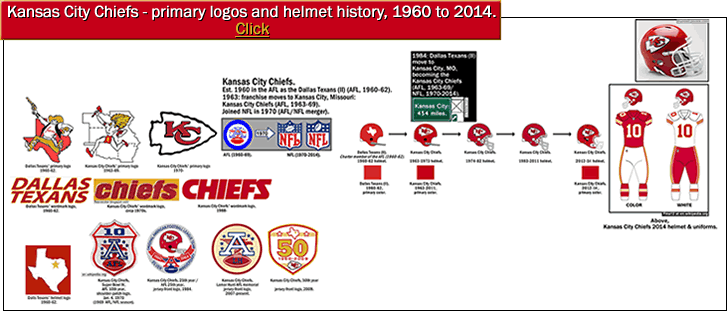
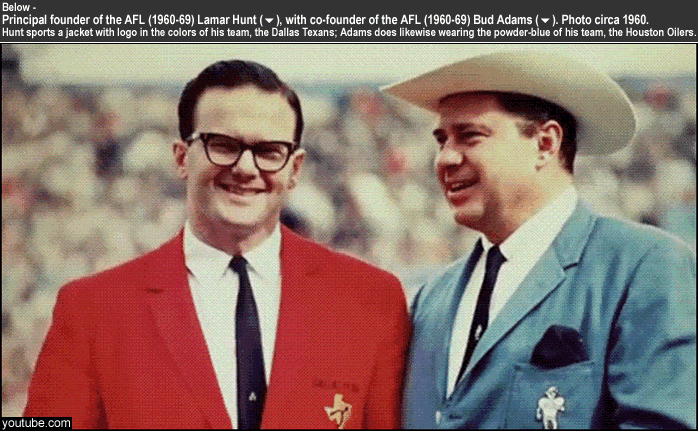
-Kansas City Chiefs, est. 1963…Right after winning the 1962 AFL title, the Dallas Texans (AFL, 1960-62) moved 453 miles (731 km) north, to Kansas City, Missouri. The franchise did this to avoid the situation in Dallas, Texas, where the team was competing with the much-stronger NFL in the form of the Dallas Cowboys. It was becoming obvious to owner-and-AFL-cofounder Lamar Hunt that the Dallas Texans were going to lose the battle for fans and ticket-support, there in Dallas, Texas. So the team moved to Kansas City, Missouri, and became the Kansas City Chiefs. Three years later, in the 1966 AFL season, the Kansas City Chiefs would play in the first Super Bowl (losing heavily to the NFL’s Green Bay Packers). Six years later, in the 1969 AFL season, the Kansas City Chiefs would upset the NFL’s Minnesota Vikings to win the fourth and final meeting between the AFL and NFL champions, in Super Bowl IV [4]. The 10-team AFL and the 16-team NFL would then merge for the 1970 season to form a 26-team NFL.
kansas-city-chiefs_afl-1963-move_from_dallas-texas_to_kansas-city-missouri_map-with-helmets-and-logos_-_b_.gif
Image credits above – Blank map by anonymous US federal government employee, at File:StatesU.svg (commons.wikimedia.org). Helmet illustrations by The Gridiron Uniforms Database at gridiron-uniforms.com.


-New York Jets, est. 1963…The hapless and broke and bankrupt New York Titans AFL franchise was bought by a much deeper-pocketed consortium, headed by entertainment executive Sonny Werblin. The team changed its name to the New York Jets. The team also changed their colors – from navy-blue & yellow-gold, to green & white. Werblin’s first order of business was to sign as head coach and GM the former Baltimore Colts title-winning head coach Weeb Ewbank, who said “I don’t see why we can’t build a winner here in five years.” The franchise finally was able to set in motion their plans to move out of the decrepit and soon-to-be-demolished Polo Grounds (on the tip of northern Manhattan, NYC), and into the new multi-purpose stadium being built by the government of New York City, in Queens, NYC. The move to the new venue would happen the following season of 1964, and attendance would skyrocket. The Jets’ improved on-field record coincided with their huge attendance increase at Shea Stadium, there in Queens, with QB Joe Namath at the helm. Five years after the name-change from the Titans to the Jets, in the 1968 season, the Jets were AFL champions. And so the AFL’s New York Jets then faced the NFL’s Baltimore Colts in Super Bowl III [3]. The hugely-favored Colts were beaten by the Jets, in one of the biggest upsets in pro football history, thereby signifying to the American public that the AFL had arrived, and was the equal of the NFL. Two seasons later (in 1970), the two leagues would merge.

new-york-jets_afl-1963_changed-name_from_ny-titans_to_ny-jets_b_.gif
Image credits above – Helmet illustrations by The Gridiron Uniforms Database at gridiron-uniforms.com.

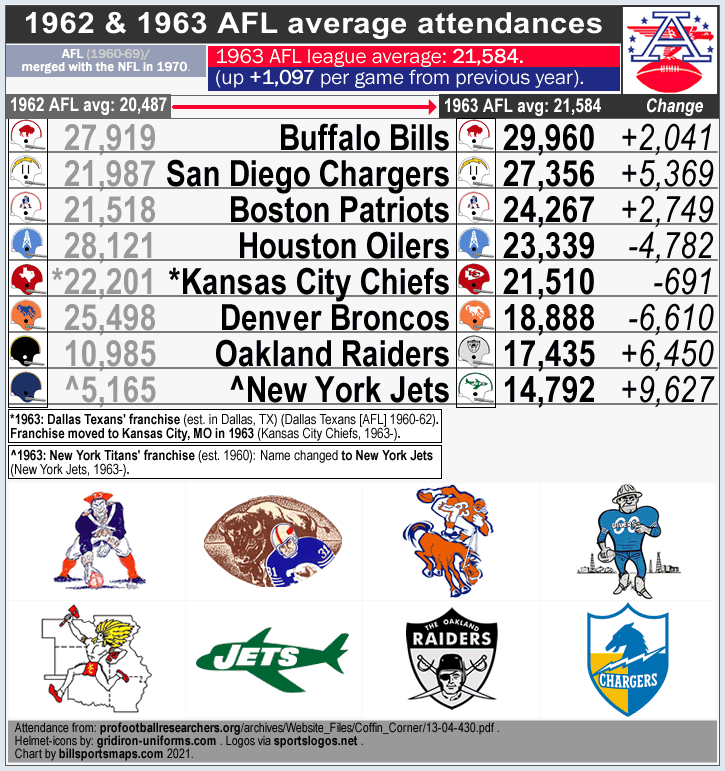
AFL attendances in 1963

afl-1963_attendance-chart_d_.gif
Source for attendance figures: pdf at ProFootballResearchers.org [Coffin Corner newsletter, Sept 1991, by Bob Carroll], profootballresearchers.org/archives/Website_Files/Coffin_Corner/13-04-430.pdf. Helmet illustrations from gridiron-uniforms.com.

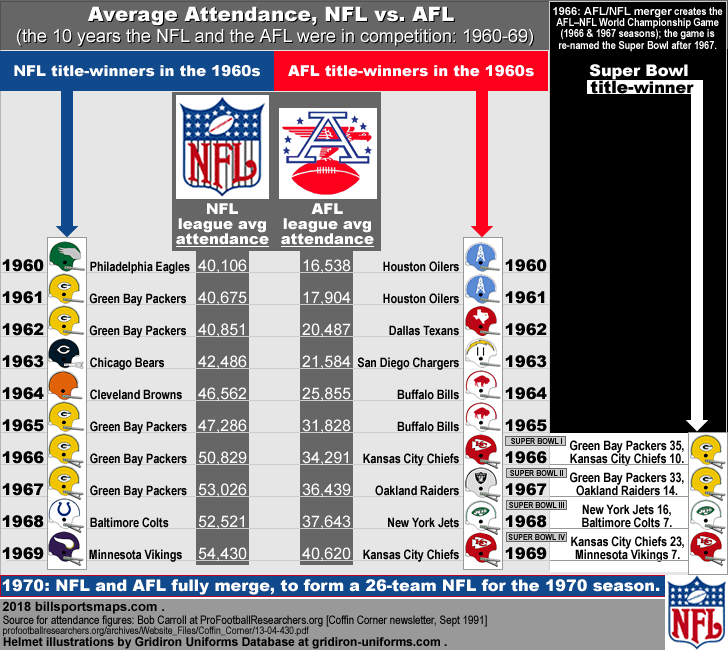
Average Attendance, NFL vs. AFL (the 10 years they were in competition: 1960-69); plus NFL/AFL/Super Bowl title-winners in the 1960s…
afl_vs_nfl_attendance_1960-69_title-winners_super-bowl_i-iv_winners_chart_h_.gif
Source for attendance figures: pdf at ProFootballResearchers.org [Coffin Corner newsletter, Sept 1991, by Bob Carroll], profootballresearchers.org/archives/Website_Files/Coffin_Corner/13-04-430.pdf. Helmet illustrations from gridiron-uniforms.com.


    1963 AFL champions – the San Diego Chargers

The San Diego Chargers were one of the strongest teams in the ten seasons of the AFL (1960-69). Yet although they made it to 5 AFL title games, the Chargers won only one of them – in 1963, when they blew out the Boston Patriots by 41 points.

It all came together for head coach Sid Gillman’s San Diego Chargers in 1963. 1962 had been a bust for the Chargers (who went an abysmal 4-10). But the team regrouped, after a boot-camp type atmosphere at their ’63 training camp, out in the high desert east of San Diego. Then the Chargers cruised through the 1963 regular season with the AFL’s best record (11-3), beating out the surprise Al Davis-led Oakland Raiders, by one game to win the Western Division. Led by the AFL’s 1963 MVP Tobin Rote (at QB), and future Hall-of-Famer WR Lance Alworth, the Chargers averaged 28.5 points per game, and were the highest-scoring offense in the league. And the tough Chargers defense allowed the least amount of points that year {1963 AFL standings}.

Then the Chargers caught a break. Because the Eastern Division had no clear dominant team, and the East was deadlocked at the top with two 7-6-1 teams. And so that meant that the East had to be decided by an extra playoff game (the AFL had no tiebreakers). And when the Boston Patriots beat the Buffalo Bills in that extra game, to advance to the 1963 AFL title game, the Patriots were depleted by the effort. So the Chargers entered the ’63 title game well rested, while the Patriots were anything but that.

Sid Gillman, renowned for his forward-thinking and pass-oriented “vertical offense”, decided to change things up for the 1963 title match. The Chargers had been beaten by a strong defense in the 1960 and 1961 AFL title games (both times losing to the Houston Oilers). With that in mind, Gillman drastically changed their plan of attack for the ’63 title game. Instead of deep routes to WR Lance Alworth, the Chargers would go with swing passes to FB Keith Lincoln. And instead of runs behind their future Hall of Fame OT Ron Mix, the Chargers would go with draws (to Lincoln and to HB Paul Lowe), and misdirection plays. In other words, Gillman was going with the opposite of what the Chargers had become known for.

By the time the Boston Patriots caught on to the Chargers’ game plan, the damage was done. Powered by long TD-runs by Keith Lincoln (for 67 yards) and Paul Lowe (for 58 yards), the Chargers shot out to a 21-7 lead after the 1st quarter. And the Chargers led by 31-10 at halftime. By the start of the 4th quarter, San Diego led by 28 points, and backup-QB John Hadl replaced Tobin Rote. 13 points later, the score was 51-10, and the Chargers were the new AFL champions.

MVP honors went to Keith Lincoln. Keith Lincoln was a QB out of Washington State, who had been drafted in the 5th round of the 1961 NFL draft by the Chicago Bears. But Lincoln, who grew up in southern California, decided to sign with the AFL’s San Diego Chargers instead. There he was converted to a running back. Lincoln had the game of a lifetime in the 1963 AFL title game, racking up an astounding 329 yards from scrimmage (206 yards rushing and 123 yards receiving). Plus he threw one pass for a 20-yard gain. The 329 yards from scrimmage that Keith Lincoln produced that day in San Diego has never been bested in a pro football title game, and is tied for 3rd-best all-time [NFL, 1920-2020; AFL, 1960-69]. {All-time best yards-from-scrimmage in a game (pro-football-reference.com/leaders).}

As of 2020, the Chargers have not won another title.

san-diego-chargers_1963-afl-champions_tobin-rote_ron-mix_keith-lincoln_paul-lowe_lance-alworth_john-hadl_sid-gillman_n_.gif
Photo and Image credits above – Tobin Rote & Ron Mix in the 1963 AFL Championship Game, unattributed at pinterest.com. Keith Lincoln runs for a 67-yard TD in the 1963 AFL Championship Game, photo unattributed at profootballtalk.nbcsports.com. Paul Lowe runs for a 58-yard TD in the 1963 AFL Championship Game, photo by Charles Aqua Viva/Getty Images via boltsfromtheblue.com. Lance Alworth catching long pass in the 1963 AFL Championship Game, photo unattributed at goldenrankings.com/AFLchampionship1963. Keith Lincoln taking hand-off from backup-QB John Hadl, late in the 1963 AFL Championship Game, unattributed at pinterest.com. Keith Lincoln on sidelines [circa 1964], photo unattributed at alchetron.com. San Diego Chargers 1963 helmet, from helmet hut.com. Head coach Sid Gilman and the Chargers players and staff celebrate the teams first (and only) championship title, with a champagne toast, photo unattributed at goldenrankings.com/AFLchampionship1963.


San Diego Chargers on map page… 1963 Chargers’ offense in the huddle listening to QB Tobin Rote (#18), unattributed at pinterest.com. 1963 Chargers uniforms, illustrations by Gridiron Uniforms database at gridiron-uniforms.com/[1963-AFL]. Tobin Rote & Paul Lowe [photo from 1963 Sports Illustrated cover], photo by Walter Iooss, Jr./Getty Images via pinterest.com. Tobin Rote & Ron Mix [photo from 1963 AFL Championship Game], unattributed at pinterest.com. Keith Lincoln [photo from 1963 AFL Championship Game], unattributed at pinterest.com. Lance Alworth [photo from 1963], photo by Focus On Sport/Getty Images via gettyimages.ca. San Diego Chargers 1963 helmet, from helmet hut.com. Ernie Ladd [photo from 1963], unattributed at bleacherreport.com. Earl Faison [1962 Fleer card], from psacard.com. Dick Harris [1962 Fleer card], from amazon.com. John Hadl [photo from 1965], photo by Neil Leifer/Getty Images via gettyimages.com. Chargers patch circa 1960s from ebay.com.

Offensive stats leaders on map page… Tobin Rote (Chargers) [photo from 1964], unattributed at talesfromtheamericanfootballleague.com. George Blanda (Oilers) [photo circa 1964], unattributed at pinterest.com. Len Dawson (Chiefs) [1964 Topps card], from cardboardconnection.com. Clem Daniels (Raiders) [photo circa 1964], photo from raiders.com. Cookie Gilchrist (Bills) [photo from 1964], unattributed at pinterest.ie. Art Powell (Raiders) [photo circa 1965], unattributed at fs64sports.blogspot.com.

Thanks to all at the following links
-Blank map by anonymous US federal government employee, at File:StatesU.svg (commons.wikimedia.org).
-Thanks to Sportslogos.net for 1960-era AFL team logos.
-Thanks to the contributors at pro-football-reference.com.
-Thanks to the contributors at AFL 1963 season (en.wikipedia.org).
-Thanks to the Coffin Corner newsletter, for this pdf, profootballresearchers.org/archives/Website_Files/Coffin_Corner/13-04-430.pdf [AFL attendance by team 1960-69] .
Special thanks to Tim Brulia, Bill Schaefer and Rob Holecko of The Gridiron Uniform Database, for giving billsportsmaps.com the permission to use football uniforms illustrations from Gridiron Uniform Database {GUD}.

August 23, 2020

NFL 1963 season, map with helmets/jerseys & final standings + offensive stats leaders; champions: Chicago Bears.

Filed under: NFL>1963 map/season,NFL/ Gridiron Football,Retro maps — admin @ 9:50 am

nfl_1963_map-with-helmets_1963-standings_offensive-stats-leaders_home-jerseys_chicago-bears-champs_post_e_.gif
NFL 1963 season, map with helmets/jerseys & final standings + offensive stats leaders; champions: Chicago Bears


By Bill Turianski on the 23rd of August 2020; twitter.com/billsportsmaps.
Links…
-1963 NFL season
-1963 NFL Championship Game (en.wikipedia.org).
-1963 NFL season (pro-football-reference.com).

-The Chicago Bears win the 1963 NFL Championship (by Larry Kart at chicagotribune.com).

1963 NFL title game: Chicago Bears 14, New York Giants 10 (Bears win their 8th title, and their first title in 17 years)…
The 1963 NFL Championship Game (December 29 1963) was played at Wrigley Field, with a full house of 45,801 on hand, despite the windy and freezing 8°F temperature [-13° Celsius].

The game pitted the NFL’s best offense (the Giants) against the league’s best defense (the Bears).

The 1963 Chicago Bears defense had conceded a then-record low of only 10.2 points-per-game, and finished 11-1-2 to win the Western Conference. Two of the Bears’ eleven wins came against the defending champions, Vince Lombardi’s Green Bay Packers, and the Bears ended up beating out the Packers for the Western title by just half a game (the Packers finished 11-2-1). The heart of the Bears’ crushing defense was their linebacker trio of Bill George (MLB), Larry Morris, and Joe Fortunato.

The 1963 New York Giants, who finished 11-3, also narrowly won their conference, over-taking and eventually edging out the Cleveland Browns by one game, for the Eastern title. The ’63 Giants were an explosive offensive juggernaut, led by veteran QB YA Tittle and a host of scoring threats, including Del Shofner (End) and Phil King (HB). YA Tittle had won the NFL’s 1963 Most Valuable Player award: Tittle had thrown for 36 TD passes for the Giants that year (setting an NFL record).

The Bears won the 1963 NFL title game by wearing down the Giants’ vaunted offense. YA Tittle took so many hits from the blitzing Bears defense that he was nullified. The Bears made 5 interceptions, two of which set up both of their touchdowns. Both of the turnovers which led to the Bears’ TDs were pick-offs from screen passes. Tittle had not given up a screen-pass-interception in all of the 1963 regular season, but in the title game that year he was picked off on screens twice by the Bears. And that was what decided it.

The Giants took an early 7-0 lead, and were clicking well on offense despite the icy conditions. So the Bears switched tactics and started blitzing. Late in the first quarter, Bears LB Larry Morris hit Tittle’s left knee with his helmet as the quarterback threw. The injured Tittle was much less effective for the rest of the game. Near the end of the 1st quarter, Larry Morris intercepted a Tittle screen pass, and returned the ball 61 yards to the Giants 6-yard line. Two plays later, Bears QB Billy Wade scored a touchdown on a two-yard quarterback sneak, to even the score at 7-7. Then 9:49 into the 2nd quarter, New York retook the lead, 10–7, on a 13-yard FG. But on the Giants’ next drive, Tittle hurt his left knee again, from another hit by Morris. Backup rookie QB Glynn Griffing replaced Tittle, to little effect. The score stayed 10-7 Giants at halftime.

In the 3rd quarter, Tittle was back in, shored up by novocaine and cortisone and heavy bandages. But Tittle could not throw off his bad foot, and his passing was erratic. This led to the second screen pass intercepted by the Bears. Late in the 3rd quarter, on the Giants’ own 35-yard-line, Tittle tried to float a screen pass as the Bears blitzed. But Bears DE Ed O’Bradovich anticipated the pass, intercepted, and ran 10 yards to the Giants’ 14. Three plays later, Billy Wade hit TE Mike Ditka for a quick toss that Ditka bulled to the 1 yard line. Then Wade pulled off his second QB-sneak, for a 1-yard-TD, and the Bears led 14-10. That score held, and LB Larry Morris was named the MVP of the game.

And the Bears had won their first NFL title in 17 years, and their 8th NFL title overall. And the New York Giants had thus lost 5 NFL title games in 6 years (and would not win another NFL title until the 1984 season). It was another 22 years until the Bears won another NFL title (in the 1985 season).

chicago-bears_1963-nfl-championship-game_wrigley-field_bears-14_giants-10_george-halas_billy-wade_larry-morris_ed-obradovich_joe-fortunato_doug-atkins_d_.gif
Photo and Image credits above -
Aerial shot of Wrigley Field for the 1963 NFL Championship Game: photo unattributed at twitter.com/[@OTBaseballPhoto]. Screenshot of Bears QB Billy Wade and Bears owner/head coach George Halas, from video uploaded by Classic Sports Pictures at youtube.com. Larry Morris, 1964 Kahns trading card via footballcardgallery.com. Bears linebacker Larry Morris returns interception 61 yards, screenshot from video uploaded by Classic Sports Pictures at youtube.com. Larry Morris upends Giants RB Joe Morrison, photo unattributed at pinterest.com. Bears DE Doug Atkins (#81), LB Larry Morris (#33) and LB Joe Fortunato (#31) blitz Giants QB YA Tittle: photo by Robert Riger/Getty Images via nytimes.com. Interception on a screen pass by Bears DE Ed O’Bradovich (#87), photo unattributed at goldenrankings.com/nflchampionshipgame1963. QB Bily Wade’s title-winning 1-yard TD run, photo from chicago.suntimes.com/bears. George Halas in the final minutes of the game, photo unattributed at twitter.com/[@sigg20].


Bears players on map page,
Reproduction of early-1960s Chicago Bears helmet, photo from ebay.com. Segment of NFL-logo-themed playing cards [from 1964], from grayflannelsuit.net/blog. Billy Wade [photo circa 1964], photo by Robert Riger/Getty Images via bleacherreport.com. Mike Ditka [photo from 1963], photo by Malcolm Evans/USA Today via articles.chicagotribune.com. Mike Ditka [action-photo circa 1963], unattributed at pinterest.com. Joe Marconi [photo circa 1963], unattributed at goldenrankings.com. Johnny Morris [1964 Philadelphia card], from amazon.com. Stan Jones [photo circa 1964], unattributed at sportscollectibles.com. Doug Atkins [photo circa 1963], unattributed at sportsmockery.com. Joe Fortunato [1964 Philadelphia card], from tradingcarddb.com. Bill George [photo circa 1963], photo by Robert Riger/Getty Images via nflspinzone.com. Rosey Taylor [photo circa 1963], unattributed at pinterest.co.uk. Richie Petitbon [1963 Topps card], from tradingcarddb.com.

Offensive stats leaders on map page,
YA Tittle (Giants) [photo circa 1962], unattributed at unclemikesmusings.blogspot.com.
Johnny Unitas (Colts) [photo from 1963], photo by Robert Riger/Getty Images at gettyimages.com.
Jim Brown (Browns) [photo circa 1965], unattributed at ebay.com.
Bobby Mitchell (Washington) [photo circa 1963], unattributed at sportsecyclopedia.com.
Terry Barr (Lions) [photo circa 1964], unattributed at worthpoint.com.
___

Thanks to all at the following links…

-Blank map by anonymous US federal government employee, at File:StatesU.svg (commons.wikimedia.org).
-Thanks to the contributors at pro-football-reference.com
-Thanks to the contributors at NFL 1963 season (en.wikipedia.org).
Special thanks to Tim Brulia, Bill Schaefer and Rob Holecko of The Gridiron Uniform Database, for giving billsportsmaps.com the permission to use football uniforms illustrations from Gridiron Uniform Database {GUD}.

August 3, 2020

England (incl. Wales): Historic Counties location-map of the 1920-21 Football League, when the League expanded to a 22-club Third Division (66 clubs total); Champions: Burnley FC.

Filed under: >ENG-1920-21 map,Retro maps — admin @ 7:52 am

1920-21_map_with-historic-counties_england_football-league_66-clubs_champions_burnley-fc_post_k_.gif
England (incl. Wales): Historic Counties location-map of 1920-21 Football League (66 clubs); Champions: Burnley FC


By Bill Turianski on the 3rd of August 2020; twitter.com/billsportsmaps.

    The map shows the Football League in 1920-21, when the first First Division champions were Burnley FC (their first English title), and when the Third Division was introduced.

Table of Contents:

Part 1). Description of Map page.

Part 2). A synopsis of Burnley’s title-winning season of 1920-21.

Part 3). History of Football League expansion from 1888 to 1921: A section which includes a timeline of the Football League’s first 29 seasons [1888-1921], the creation of the Third Division in 1920-21, and then creation of the two Third Divisions (North and South) in 1921-22.

Part 4). Notes on the First Division attendance in the early years, and the impact of adding two 3rd division leagues by 1921-22 (with bar graph of League attendance 1890-1950).

Part 5). Top Flight teams of 1920-21… Where are those clubs now, 100 years later..?

Part 6). Historic County boundaries of England (pre-1975), compared to the modern County boundaries.

    Part 1: The map shows the Football League of 1920-21, when the Third Division was introduced, and when Burnley FC were the champions of England.

The main map, including a separate London-area map, shows all 66 clubs in the Football League (22 First Division clubs, 22 Second Division clubs, 22 Third Division clubs).

The First Division clubs are shown with their home kits, arranged by region in separate boxes, flanking each side of the main map.
They are arranged in 7 regional sections.
Here is a list of those seven regional sections, including names on each club’s home ground (and years they played there)…

    1920-21 First Division: clubs by Historic Counties

Lancaster [including the cities of Manchester and Liverpool]: (9 First Division clubs)
∙ Blackburn Rovers: played at (and still play at) Ewood Park (1881; and since 1890).
∙ Bolton Wanderers: played at Burnden Park (from 1895 to 1997).
∙ Burnley: played at (and still play at) Turf Moor (since 1883).
∙ Everton: played at (and still play at) Goodison Park (since 1892).
∙ Liverpool: played at (and still play at) Anfield (since 1892).
∙ Manchester City: played at Hyde Road (1887-1923).
∙ Manchester United: played at (and still play at) Old Trafford (since 1910).
∙ Oldham Athletic AFC: played at (and still play at) Boundary Park (since 1904).
∙ Preston North End: played at (and still play at) Deepdale (since 1878).

Yorkshire [the 3 Ridings of Yorkshire]: (5 First Division clubs)
∙ Bradford City: played at (and still play at) Valley Parade (since 1903).
∙ Bradford Park Avenue: played at Park Avenue (from 1907 to 1973).
∙ Huddersfield Town AFC: played at Leeds Road (from 1908 to 1994).
∙ Middesbrough: played at Ayresome Park (from 1903 to 1995).
∙ Sheffield United: played at (and still play at) Bramall Lane (since 1889).

Northeast [Northumberland and Durham]: (2 First Division clubs)
∙ Newcastle United: played at (and still play at) St James’ Park (since 1892).
∙ Sunderland AFC: played at Roker Park (from 1898 to 1987).

Birmingham area: [Warwikshire/Worcestershire/Staffordshire]: (2 First Division clubs)
∙ Aston Villa: played at (and still play at) Villa Park (since 1897).
∙ West Bromwich Albion: played at (and still play at) the Hawthorns (since 1900).

Derbyshire: (1 First Division club)
∙ Derby County: played at the Baseball Ground (from 1895 to 1997).

London area [County of London and Middlesex]: (3 First Division clubs)
∙ Arsenal: played at Highbury (from 1913 to 2006).
∙ Chelsea: played at (and still play at) Stamford Bridge (since 1905).
∙ Tottenham Hotspur: played at White Hart Lane (from 1899 to 2017).

Next to the 22 1st division clubs’ home kits are each club’s current (2020) badge. The 22 First Division clubs also have home-jersey segments next to their location-dots on the map. The 22 Second Division clubs have slightly smaller home-jersey segments next to their location-dots on the map. And the 22 Third Division clubs have even smaller home-jersey segments next to their location-dots on the map. The source of the illustrated kits and jersey-segments is the excellent site Historical Football Kits (historicalkits.co.uk).

Note on the location-dots…a black dot shows the location of the club’s home ground in 1920-21; grey dots show future grounds the club would go on to play in. Listed next to each location-dot is the date that the club played at each of their grounds (in tiny 10-point type).

The main map and the London area map both show the borders of the Historic Counties (pre-1975). {See Part 6, a section on Historic Counties, further below.} Any Historic County in England (or Wales) which had a Football League club in 1920-21 is shown on the map(s) with a tinted overlay.

At the top-centre of the map page is a section devoted to the 1921 title-winners, Burnley FC of Lancashire {see more on this in Part 2, below}. Below that, in the centre of the map-page, is a section devoted to the 5 top scorers in the First Division in 1920-21.

At the right-hand side of the map page are the tables for the 3 divisions of the 1920-21 Football League. Next to each club is their 1920-21 home-jersey segment, and the club’s current (2020) badge. If the club in 1920-21 wore a badge on their jersey, that is also shown (but very few clubs wore badges on their jerseys back then). The tables include the usual (Wins, Draws, Losses, Points) plus Goal Average. (Goal Average was Goals Scored divided by Goals Conceded. It was used as a tiebreaker from 1888 to 1976. It was replaced by Goal Difference in 1976-77. The problem with goal average was that it encouraged lower scoring games, as this page at Wikipedia shows, Goal Difference v. Goal Average.) At the far right-hand side of the 1920-21 Football League tables are each club’s home league average attendance.

Finally, at the lower left-hand side of the map page, next to the map’s Legend, is a list of the 30 largest cities in England in 1921. {Source: List of towns and cities in England by historical population (en.wikipedia.org).} The 14 largest cities in England in 1921 are shown on the map…London, Birmingham, Liverpool, Manchester, Sheffield, Leeds, Bristol, Bradford, Hull, Newcastle, Nottingham, Portsmouth, Stoke-on-Trent, Leicester.


    Part 2: The 1920-21 season, when Burnley FC, of Burnley, Lancashire, were the football champions of England.

Most successful clubs and top-drawing clubs circa 1920…
1920-21 was the 29th season of the Football League, and the second season back after World War I. Aston Villa was the most successful English club to that point in time, with 6 titles. Aston Villa had last won the title in 1910 (six seasons earlier). The second-most successful club was Sunderland, with 5 titles. Sunderland had last won the title in 1912 (four seasons earlier).

The best drawing clubs circa 1920 were Newcastle United and Chelsea {year-by-year attendance, here}. Both Newcastle and Chelsea were drawing at or near 40 thousand per game. In 1920-21, there was phenomenal and record-breaking attendance through all three divisions. The 1st division overall average attendance in 1920-21 would not be surpassed for another 26 years (not until 1946-47). The 1st division as a whole averaged an astounding 29.2 K per game. The 2nd tier drew also drew very well, with an average crowd of 16.7 K. And the new 3rd tier, comprised almost entirely of formerly non-League sides all from the south of England (and of Wales), drew an impressive 10.6 K per game. The following season of 1921-22 would see another 3rd division added, this time comprised of formerly non-League sides all from the north of England (and Wales). {For more on that, see Part 3, below, which includes a timeline of Football League expansion from 1888 to 1921.} {More on attendance in part 4, further below.}

In 1920-21, Burnley, a founding member of the Football League in 1888, were playing in their 15th season in the First Division, and were in their 4th consecutive top flight season. (Burnley had won promotion back to the First Division in 1913). Burnley’s Manager John Haworth was starting his 11th season at the helm. John Haworth had previously led Burnley to promotion in 1913, and to the FA Cup title in 1914.

As mentioned, the 1920-21 season was the second season back, after four Football League seasons were cancelled, due to the Great War [World War I]. The previous season of 1919-20 saw Burnley finish in 2nd place, 9 points behind the title-winners, West Bromwich Albion.

Burnley got off to a terrible start in 1920-21, losing their first 3 matches (losing at home to Bradford City, then losing away to Huddersfield Town, then losing away to Bradford City). So Manager John Haworth made several changes to the squad, including the reinstatement of both Goalkeeper Jerry Dawson and Defender/Captain Tommy Boyle. Then on the 6th of September 1920, Burnley beat Huddersfield 3–0, at home at Turf Moor; the goalscorers were Bob Kelly, Tommy Boyle, and Billy Nesbitt.

At that point in early September 1920, Burnley began an unbeaten run that would extend to a then-record 30 games. Burnley’s 30-game-unbeaten-run included 21 wins, and zero dropped points at Turf Moor. Burnley’s unbeaten run was an English first division record for 83 years, until it was bettered by Arsenal in 2003–04 (Arsenal’s unbeaten run went beyond a full season, to 49 games).

Burnley reached first place on 20 November 1920, with a 2-2 draw at Oldham. Burnley remained leaders for the rest of the season. The Clarets’ unbeaten run went all through October, November, December, January, and February. At Christmas time, Burnley led the league by 3 points. On 15 February, Burnley beat Blackburn 3-1 at Turf Moor, in front of a team season-high home attendance of 41,500. (Burnley drew an average of 31,535 to Turf Moor in 1920-21, which was a little over 2,000 more per game than the league average of 29,252.) {1920-21 First Division attendance figures can be seen at European-Football-Statistics.co.uk; also on the map page, at the far right hand side are average attendance figures for all 3 League divisions, and all 66 League teams.}

Burnley’s 30-game unbeaten run ended in late March, and it ended only when Burnley had to (ridiculously) play two games in two days. Burnley finally lost a match on 26 March, to title-challengers Manchester City, 3-0 away – which was just one day after they had beaten Manchester United 1-0 at Turf Moor. At that point, Burnley were 7 points clear at the top of the table. Burnley then beat Man United away and Man City at home, and the title was just one good result away. But then, mirroring their early season problems, Burnley finished the season winless in their last 6 games. But they had built up enough of a lead that a 1-1 draw, away to Everton, on the 23rd of April, clinched the title for them, with 3 games to spare.

The key players in Burnley’s title-winning season of 1920-21 were Goalkeeper Jerry Dawson, Forward Joe Anderson, Forward Bob Kelly and Captain/Defender Tommy Boyle. The Renfrewshire, Scotland-born Joe Anderson had 25 goals in league games that season (6th-best in the league). Bob Kelly, born near Wigan in Lancashire, scored a league-10th-best 20 goals that season. Tommy Boyle, who was born near Barnsley in Yorkshire, had previously captained two teams to the FA Cup title: Barnsley in 1912 and Burnley in 1914. As mentioned earlier, Boyle had started the season on the bench, but manager Haworth put him back in the squad on the same game that started their 30-game unbeaten run. Tommy Boyle led all Burnley defenders with 7 goals in 1920-21. {Joe Anderson, Bob Kelly, Tommy Boyle and Jerry Dawson can be seen in photos on the map page, in the Burnley section at the top-center; there is also a photo of Secretary/Manager John Haworth, an aerial shot of Turf Moor from the late 1920s, two team photos, and a banner from the Burnley matchday programme of 2 April 1921.}

    Part 3: In 1920-21, the Football League expanded from 44 teams to 66 teams, with the addition of a Third Division.

Before that is discussed, here is a timeline of the Football League, from its creation in 1888-89, up to 1920-21…
{Note: all seasons listed below are linked to their pages at en.wikipedia.org (click on the date).}
1888-89: 12 teams… the Football League is established with 12 clubs from the Midlands and the North of England…Accrington FC [defunct], Aston Villa, Blackburn Rovers, Bolton Wanderers, Burnley, Derby County, Everton, Notts County, Preston North End, Stoke FC [present-day Stoke City], West Bromwich Albion, Wolverhampton Wanderers. {See this: One letter, two meetings and 12 teams – the birth of league football (by Paul Fletcher at bbc.com/sport/football from Feb. 2013).}
1890-91: 14 teams…in its 4th season, the League expands by two teams, to 14 teams.
1892-93: 28 teams…in its 5th season, the Football League expands to a second division and is now comprised of 28 teams (with the First Division now comprising 16 teams). Some of the arriving clubs in the new 12-team Second Division come into the League from the failed rival-league the Football Alliance (1889-92). Promotion and relegation is to be decided by test matches between the bottom 3 finishers in D-1 and the top three finishers in D-2. Also, the bottom four finishers in D-2 must pass re-election by League members, or be demoted out of the League (later changed to bottom 3 finishers).
1893-94: 31 teams…in its 6th season, the Football League expands by 3 teams to 31 teams, with the addition of 3 more teams to the now-15-team Second Division.
1894-95: 32 teams…in its 7th season, the Football League expands by one team to 32 teams, with the addition of another team to the now-16-team Second Division.
1898-99: 36 teams…in its 11th season, the Football League expands by 4 teams to 36 teams, with the addition of 2 teams to each division, making D-1 and D-2 both 18-team leagues. ALSO, Promotion-and-Relegation replaces Test Matches…now, the bottom 2 finishers in D-1 would be relegated down to D-2, while the top 2 finishers in D-2 would be promoted up to D-1 (and the bottom 3 finishers in D-2 still had to pass re-election to stay in the League).
1905-06: 40 teams…in its 18th season, the Football League expands by 4 teams to 40 teams, with the addition of 2 teams to each division, making D-1 and D-2 both 20-team leagues. ALSO, clubs from the South of England enter the League for the first time: the first two southern-England-based clubs to join the League were Chelsea, and Clapton Orient [present-day Leyton Orient].
1915: football is suspended in England following the outbreak of the Great War [WW I]. Four seasons of the Football League are lost (1915-16 to 1918-19).
1919-20: 44 teams…with the return of football in England, the Football League expands by 4 teams to 44 teams, with the addition of 2 teams to each division, making D-1 and D-2 both 22-team leagues.
1920-21: 66 teams…in its 20th season, the Football League expands by 22 teams to 66 teams, with the creation of a Third Division. ALSO, clubs from Wales enter the League for the first time: four clubs, all from South Wales, join the League (Cardiff City into the Second Division; Swansea Town [Swansea City], Newport County, and Merthyr Town into the Third Division).

1920-21 was the second season that the Football League was back in play, following World War I. This was when the League expanded once again – into a third division. In 1920-21, that new 3rd tier was comprised of teams almost exclusively from the heretofore-under-represented South of England (and Wales)…all but one were located south of Birmingham (see next few sentences). 23 of the 24 of the clubs in the new 1920-21 Third Division were teams which had been, previously, in the [non-League] 1919-20 Southern League Division One {league table, here}. The only club from the 1919-20 Southern League Division One that did not join the new Football League Third Division was Cardiff City, who were elected straight into the Football League Second Division. And to make room for that, the last-place finisher of the 1919-20 Football League Second Division was relegated into the new 3rd division. That club was Grimsby Town. Why did Cardiff City, Wales’ biggest football club (then and now), receive such special treatment (ie, an immediate promotion)?… ‘As Cardiff City was long considered a potential entrant for the Second Division due to their FA Cup exploits and Southern League dominance, they were sent directly into the Second Division’…{excerpt from en.wikipedia.org/Football_League_Third_Division}. Some might say that was simply blatant favoritism, and I don’t disagree. However, it must be pointed out that the 1920-21 Cardiff City squad was a strong enough team to finish in second place in their debut season in the League (and thus win promotion to the 1921-22 First Division). So Cardiff City went from non-League football, to the top flight, in one season (and were the last team to ever do so).

The 66-teams set-up in the Football League lasted exactly one season (1920-21).
One year later (1921-22), the new south-ward imbalance of the lower part of the Football League was corrected, when another Third Division in the Football League was established. Since there was no northern equivalent to the Southern League, this new 1921-22 Third Division North was comprised of teams from the most prominent of the non-League leagues in the Midlands and the North. Those leagues which supplied teams into the new Football League Third Division North in 1921-22 were: the Midland League, the Central League, the North Eastern League, the Lancashire Combination, and the Birmingham Combination.

So, in 1921-22, there was the newly-established Third Division North and there was the newly-established Third Division South (each with 22 teams, and each being parallel 3rd divisions). That made it 88 teams in the Football League. This 88-team Football League set-up, including two equal 3rd tier leagues, existed for twenty one seasons (1921-22 to 1949-50). Then, in 1950-51, the whole Football League set-up expanded slightly more, to 92 teams. So, in 1950-51 there were: 22 teams in the 1st Division, 22 teams in the 2nd Division, 24 teams in the 3rd Division North and 24 teams in the 3rd Division South. (That number of teams – 92 – still stands today, in concept, if not legal framework.) Then, in 1957-58, the two regional 3rd divisions were eliminated, with the creation of a new national Third Division and a new national Fourth Division. This set-up existed all through the 1960s and the 1970s and the 1980s, and only changed when the Premier League ‘evolved’ from the old First Division, in 1992-93. The now-20-team 1st division…aka the Premier League…might be a separate legal entity from the Football League, but it is still the top tier of the English football league system. And the Football League’s three tiers still sit below that. So, in England (including Wales), there are still 92 teams in the four leagues above the vast non-League Pyramid.

    Part 4: Notes on the First Division attendance in the early years, and the impact of adding two 3rd division leagues by 1921-22.

As mentioned in part 2, 1920-21 was the 29th season of the Football League. The Football League had grown remarkably, with crowds now nearing a 30-thousand-per-game average in the top tier. And the Football League had grown from a single 12-team league to a three-tier 66-team set-up. It had fought off an early rival league – the Football Alliance: The Football Alliance existed from 1889-92, with its 12 members merging into the Football League in 1892, joining the newly formed Second Division of the Football League.

England: Football League Average Attendance, 1988-89 to 1949-50 – League averages, by Division…
Click on image below for full-size chart
england_football-league_attendance-1889-to-1950_bar-chart_f_.gif
Graph by billsportsmaps.com; attendance figures from european-football-statistics.co.uk.

The first season of 1888-89 saw crowds averaging only 4,600 per game. {Year-by-year English League-average attendance figures from european-football-statistics.co.uk, here.} Growth was slow at first. 5 years on, in 1892-93 (when the Football Alliance clubs came over to augment the new Second Division), attendance was at 7,000 per game in the 1st tier, and 2,200 in the new 2nd tier. The creation of a second division did not seem to negatively affect top flight crowds, though, of course, if the League had not created the Second Division, attendances might have increased. But then again, another rival-league like the Alliance might have threatened the League, so you could say expansion to the Second Division was inevitable. (One could also make the same argument for the League’s expansion into the two 3rd divisions.)

It took eleven seasons for the First Division to reach 10-K-per-game, in 1898-99 (with the Second Division drawing 4.2-K per game). And even then, the next season of 1900 saw a slight decrease in crowd size (of 0.5-K-per-game). It took 19 seasons for the 1st division to make an attendance increase of 2,000-per-game…that happened in 1906-07, when average crowds increased by 2.1-K-per-game: from 13.4-K in 1906, to 15.5-K in 1907.

Twenty-thousand per game was finally reached in the 1913-14 season, and that season also saw the 2nd division draw 10-K per-game for the first time. The outbreak of World War I was in June 1914, and the next season of the Football League in 1914-15 saw a drop in attendance as the war loomed. Then there were the 4 seasons lost to World War I. The first season after the war – 1919-20 – saw a large increase in average crowd size: 24.0-K in the 1st tier and 12.8-K in the 2nd tier. Those are very solid numbers. And in 1920-21, attendance continued to skyrocket, to a phenomenal 29,200 per game. And an impressive 16.3-K per game in the 2nd tier. And a remarkable 10.8-K per game in the new Third Division. Ten thousand per game in the new 3rd division! That’s how starved for League football fans in the south of England were (because 21 of the 22 teams in the new 3rd division in 1920-21 were southern clubs).

It bears mentioning that the 29.2-K-per-game attendance that the 1st division drew in 1920-21 was not surpassed for 26 years. It wasn’t until 1946-47, the first season back after World War II, that there was better attendance in the top flight than in 1920-21 (20 seasons). (In 1946-47, the 1st division averaged a then-record 32.2-K, then two seasons later in 1948-49 the 1st division reached its all-time record attendance of 38.7-K per game. Which has almost, but not quite, been bested by the Premier League in 2019-19 and in 2019-20. Again, see attendances by year, here.)

Why did the 1st division’s overall attendance drop after 1920-21, and why did top flight attendance continue to plateau all through the rest of the 1920s and all of the 1930s? Well, the global Depression of the 1930s certainly contributed to flat attendance in that decade, but what about in the 1922-to-’29 time period? That is to say, when the economy was fine, and the League had just experienced its two best-drawing seasons.

I would say it was because of the introduction of the second, parallel 3rd division in 1921-22. Because that added 22 Northern-or-Midlands-based clubs into the League, and many of the people attending matches of those new 3rd-Division-North League clubs would have been going to other northern-based Football League matches in previous seasons. By the same token, there is a reason why the season of 1920-21 saw considerable attendance increase despite the creation of the new 3rd tier. It was because all those new League clubs in the new 3rd tier in 1920-21 were southern-based clubs (except for Grimsby Town). And the 1st division had just 3 southern-based clubs back then in 1920-21 (Spurs, Arsenal, Chelsea), and the 2nd division had only four clubs located in the south back then (Cardiff City [of Wales], Bristol City, Clapton [Leyton] Orient, Fulham).

So in 1920-21, in the south of England (and Wales), there was a vast untapped market for League football – even 3rd division League football. But in the following season (1921-22), when the Football League created a parallel 3rd division comprised entirely of northern-based clubs, there was a much smaller market for 3rd division League football up north. Because there were so many big League clubs already up there in the North and in the Midlands. The Football League football market was pretty saturated up there (and it still is today, especially around Greater Manchester, Merseyside, and Lancashire).

Want more proof that the over-saturation of League football in the North hurt attendance figures? Well, in all of the 28 seasons that the dual-North/South-3rd-division set-up existed (from 1921 to ’57), the Third Division North never had higher attendance than the Third Division South. It was never even close: never in any of those 28 seasons was the 3rd-North’s overall attendance within 2.0-K-per-game of the 3rd-South’s. Again, see the chart above (and click on it for an enlarged image) or see the E-F-S site’s England page {here}.

After 1921-22, for nearly two decades, 1st division football attendance did not increase. There was no 1st division crowd-size increase for 18 consecutive seasons, from 1921-22 to 1938-39.


    Part 5: Notes on the Top Flight teams of 1920-21… Where are those clubs now, 100 years later..?

Each of the 22 top flight teams of 1920-21 are below shown in order of finish, with the following information…
# in 1920-21. Club. 100 years later…2019-20 league finish (#in league pyramid). Seasons played in 1st division (consecutive seasons in 1st div/or: last time in 1st div). English titles (last). FA Cup titles (last). Average attendance*
*Average attendance is for 2019-20 from domestic home league matches played up to 15 March 2019; post-March 15 closed-door (ie, zero attendance) matches discounted from attendance average.
(Note: for all the clubs listed below, Top flight seasons & Consecutive seasons includes the season starting in September 2020 [2020-21].)
(Note: there have been 122 seasons of English 1st Division/Premier League, including 2020-21.)

1920-21 First Division
∙1st place in 1920-21: Burnley FC.
100 years later…2019-20: 10th place in Premier League (#10 in league pyramid). 58 seasons in 1st division (5 consecutive top flight seasons). 2 English titles (last in 1960); 1 FA Cup title (1914). 20,260 avg attendance in 2019-20 (30th best attendance in English football in 2019-20).

∙2nd place: Manchester City FC.
100 years later…2019-20: 2nd place in Premier League (#2 in league pyramid). 92 seasons the in 1st division (19 consecutive top flight seasons). 6 English titles (last in 2019); 6 FA Cup titles (last in 2019). 54,219 avg attendance in 2019-20 (5th best).

∙3rd place: Bolton Wanderers FC.
100 years later…2019-20: 23rd place (last place) in League One (3rd division) (#67 in league pyramid)/relegated to 4th division. 73 seasons in the 1st division (relegated out in 2012). 4 FA Cup titles (1958). 11,480 avg attendance in 2019-20 (46th best).

∙4th place: Liverpool FC.
100 years later…2019-20: 1st place in Premier League (#1 in league pyramid) (English champions). 106 seasons in the 1st division (59 consecutive top flight seasons). 19 English titles [2nd-best All-time] (2020). 7 FA Cup titles (2006). 53,143 avg attendance in 2019-20 (6th best).

∙5th place: Newcastle United FC.
100 years later…13th place in Premier League (#13 in league pyramid). 89 seasons in the 1st division (4 consecutive top flight seasons). 4 English titles (1927). 6 FA Cup titles (1955). 48,248 avg attendance in 2019-20 (7th best).

∙6th place: Tottenham Hotspur FC. (Note: Tottenham won the 1921 FA Cup title, beating Wolverhampton 1–0.)
100 years later…2019-20: 6th place in Premier League (#6 in league pyramid). 86 seasons in the 1st division (43 consecutive top flight seasons). 2 English titles (1961). 8 FA Cup titles (1991). 59,384 avg attendance in 2019-20 (4th best).

∙7th place: Everton FC.
100 years later…2019-20: 12th place in Premier League (#12 in league pyramid). 118 seasons in the 1st division [All-time English record] (67 consecutive top flight seasons). 9 English titles (1987). 5 FA Cup titles (1995). 39,150 avg attendance in 2019-20 (10th best).

∙8th place: Middlesbrough FC.
100 years later…2019-20: 17th place in EFL Championship (2nd division) (#37 in league pyramid). 62 seasons in the 1st division (relegated out in 2017). 19,933 avg attendance in 2019-20 (31st best).

∙9th place: Arsenal FC.
100 years later…2019-20: 8th place in Premier League (#8 in league pyramid). 104 seasons in the 1st division last in 2017 (96 consecutive top flight seasons [All-time English record]). 13 English titles [3rd-best All-time] (2004). 14 FA Cup titles [All-time English record] (2020). 60,279 avg attendance in 2019-20 (2nd best).

∙10th place: Aston Villa FC.
100 years later…2019-20: 17th place in Premier League (#17 in league pyramid). 107 seasons in the 1st division [2nd-best All-time] (2 consecutive top flight seasons). 7 English titles (1981). 7 FA Cup titles (1957). 41,661 avg attendance in 2019-20 (8th best).

∙11th place: Blackburn Rovers FC.
100 years later…2019-20: 11th place in EFL Championship (2nd division) (#31 in league pyramid). 72 seasons in the 1st division (relegated out in 2012). 3 English titles (1995). 6 FA Cup titles (1928). 13,873 avg attendance in 2019-20 (40th best).

∙12th place: Sunderland AFC.
100 years later…2019-20: 8th place in EFL League One (3rd division) (#52 in league pyramid). 86 seasons in the 1st division (relegated out in 2017). 6 English titles (1936). 2 FA Cup titles (1973). 19,933 avg attendance in 2019-20 (31st best).

∙13th place: Manchester United FC.
100 years later…2019-20: 4th place in Premier League (#4 in league pyramid). 96 seasons in the 1st division (46 consecutive top flight seasons). 20 English titles [All-time English record] (2013). 12 FA Cup titles [2nd-best All-time] (2016). 73,393 avg attendance in 2019-20 (Best attendance in England).

∙14th place: West Bromwich Albion FC.
100 years later…2019-20: 2nd place in EFL Championship (2nd division) (#22 in league pyramid)/promoted automatically to Premier League for 2020-21. 81 seasons in the 1st division (had been relegated out in 2019/promoted back in 2020). 1 English title (1920). 5 FA Cup titles (1968). 24,053 avg attendance in 2019-20 (22nd best).

∙15th place: Bradford City AFC.
100 years later…2019-20: 9th place in EFL League Two (4th division) (#76 in league pyramid). 12 seasons in the 1st division (relegated out in 2001). 1 FA Cup title (1911). 14,309 avg attendance in 2019-20 (38th best).

∙16th place:Preston North End FC.
100 years later…2019-20: 9th place in EFL Championship (2nd division) (#29 in league pyramid). 46 seasons in the 1st division (relegated out in 1961). 2 English titles (1890). 2 FA Cup titles (1938). 13,579 avg attendance in 2019-20 (43rd best).

∙17th place: Huddersfield Town AFC.
100 years later…18th place in EFL Championship (2nd division) (#38 in league pyramid). 33 seasons in the 1st division (relegated out in 2019). 3 English titles (1926). 1 FA Cup title (1922). 21,748 avg attendance in 2019-20 (27th best).

∙18th place: Chelsea FC.
100 years later…3rd place in Premier League (#3 in league pyramid). 86 seasons in the 1st division (32 consecutive top flight seasons). 6 English titles (2017). 8 FA Cup titles (2018). 40,453 avg attendance in 2019-20 (9th best).

∙19th place: Oldham Athletic AFC.
100 years later…2019-20: 19th place in EFL League Two (4th division) (#86 in league pyramid). 12 seasons in the 1st division (relegated out in 1994). 3,466 avg attendance in 2019-20 (85th best).

∙20th place: Sheffield United FC.
100 years later…9th place in Premier League (#9 in league pyramid). 62 seasons in the 1st division (2 consecutive top flight seasons). 1 English title (1898). 4 FA Cup titles (1925). 30,869 avg attendance in 2019-20 (14th best).

∙21st place: Derby County FC (relegated to the 2nd division for 1921-22).
100 years later…10th place in EFL Championship in 2019-20 (#30 in league pyramid). 65 seasons in the 1st division (relegated out in 2008). 2 English titles (1975). 1 FA Cup title (1946). 26,727 avg attendance in 2019-20 (20th best).

∙22nd place: Bradford Park Avenue FC (relegated to the 2nd division for 1921-22).
100 years later…22nd place [last place] in National League-North (6th level)/would have been relegated to the 7th level but were reprieved due to Coronavirus pandemic rendering all English leagues below the 6th level to be null & void for 2019-20 [ie, relegations below 6th level were cancelled] (~#137 in league pyramid). 3 seasons in the 1st division (relegated out in 1921). 484 avg attendance in 2019-20 (180th best in English football).

+1920-21 Second Division promoted clubs:
∙1st place in Second Division in 1920-21: Birmingham FC/promoted to First Division for 1921-22. (Note: the name Birmingham City FC was adopted in 1943).
100 years later…20th place in EFL Championship in 2019-20 (#40 in league pyramid). 57 seasons in the 1st division (relegated out in 2011). 20,412 avg attendance in 2019-20 (29th best).

∙2nd place in Second Division in 1920-21: Cardiff City FC/promoted to First Division for 1921-22 [becoming the first Welsh club to play in the English 1st division].
100 years later…5th place in EFL Championship in 2019-20/lost in play-offs semifinals (#25 in league pyramid). 17 seasons in the 1st division (relegated out in 2019). 1 FA Cup title (1927 [the only Welsh club to win an FA Cup title]). 22,822 avg attendance in 2019-20 (25th best).

    Part 6: Historic Counties of England before the late 20th century boundary-changes…

Note: this interactive map was very helpful in making my 1920-21 map here, and I imagine many of you would enjoy looking through it…Wikishire.co.uk/interactive map of Historic Counties of the British Isles .

Basically, everything, County-wise, was much more convoluted back then. ‘Back then’ generally meaning before 1975, but with London, before 1965…and specifically meaning before the changes made in April 1974 which were the result of The Local Government Act of 1972. That Act of Parliament led to the creation of such things as Greater Manchester and the West Midlands (both of which were officially instituted in April 1974). Before this, the outlying areas of England’s three biggest cities – London, Birmingham, and Manchester – were split among different County jurisdictions. As were the outlying areas around Liverpool, and also Newcastle.

One might ask why were the Historic Counties were done away with circa 1972-74? The answer is that they were changed to streamline administrative purposes. For example, imagine today having all of sprawling urban London under six different local government jurisdictions (County of London/Essex/Kent/Surrey/Middlesex/Hertfordshire). Or having all of urban Birmingham being under three separate jurisdictions (Warwickshire/Staffordshire/Worcestershire). In the major cities of Great Britain, the County borders had been established long before the patterns of urban development had become apparent. The changes made between 1965 and 1975 were aimed at combining the urban areas into single jurisdictions. ‘The Local Government Act 1972 sought generally to unite conurbations within a single county, while retaining the historic county boundaries as far as was practicable.’ {-excerpt from Historic counties of England/1965 and 1974 (en.wikipedia.org).

But to many people, eradicating the Historic Counties has left them rootless. -Britons Feeling Rootless After Changes to England’s Historic Counties (by Simon Worrall from November 2014 at nationalgeographic.com.

You could say that the Historic Counties in Britain functioned in the same way as the states in the United States of America. Each – in both cases – have unique characteristics, and each give residents there an identity. Imagine the uproar if two small American states like Connecticut and Rhode Island were merged. Or if New Jersey was abolished and diced up to better suit the local governments of New York City and Philadelphia. Or if north-western Indiana was grafted onto Illinois, to make the city of Chicago’s government more streamlined. No way those things would go down well. However, in Britain they did do things like that.

Introduction of the 6 Metropolitan Counties…
The changes made in county borders from 1965 through 1974 saw the introduction of a separate category of County: the Metropolitan county. There are 6 Metropolitan counties…Greater London, Greater Manchester, the West Midlands (ie, greater Birmingham including Wolverhampton and Coventry), Tyne and Wear (greater Newcastle including Sunderland, as well as Gateshead and South Shields), Merseyside (greater Liverpool including St Helens and the Wirral Peninsula, as well as Southport), West Yorkshire (greater Leeds including Bradford, Huddersfield, and Halifax), and South Yorkshire (greater Sheffield including Barnsley, Rotherham, and Doncaster). {Here is a small chart showing the Metropolitan counties that were created in April 1974 (en.wikipedia.org).}

London (Greater London)…
Back before 1966, there was the County of London (1889-1965), but that was much smaller than the sprawling present-day Greater London. All of East London, for example, was still part of Essex (including where West Ham once played and now play, and where Leyton Orient still play).

And much of West London and North London was actually not ‘in London’, but was part of Middlesex (including where both Spurs and Brentford once played and where both now play). The County Middlesex does not officially exist anymore, but there are many who still keep the concept alive – just one example being the ‘County of Middlesex’ signs still standing in Brentford and Enfield.

Before 1966, a large section of South West London was still part of Surrey (including where Crystal Palace still play). Also, a large section of South East London was still part of Kent (such as where Charlton Athletic once played and still play).

Birmingham, and the introduction of the West Midlands…
Before 1975, the region surrounding Birmingham was part of three different counties. Pre-1975, most of Birmingham was in Warwickshire, but north-east parts of the already-sprawling greater Birmingham were in a narrow northeastern-pointing arm of Worcestershire. And the western part of the greater Birmingham region…from West Bromwich on towards Wolverhampton and the Black Country…that was all part of Staffordshire. The West Midlands did not exist before April 1974 – there was just the vague concept of the Midlands. The Midlands was well established culturally, as a distinct region of England, but before 1975 the Midlands was not established in any jurisdictional form. Warwickshire lost a great deal of territory after 1974: Warwickshire lost not only the city of Birmingham, but Warwickshire also lost the area just east of that (Sutton Coldfield, Solihull, and the city of Coventry). The Historic county of Warwickshire had a generally circular-shape, but now Warwickshire is an odd oblong-crescent shape. So, before the sweeping changes of April 1974, Aston Villa were situated in Warwickshire, while just 3 miles west of Villa Park there is West Bromwich Albion’s home ground of the Hawthorns. But the Hawthorns was situated in Staffordshire before 1975.

Other former Counties (like Middlesex)…
Back then, there were also some other counties (like Middlesex) that do not exist anymore – like Huntingdonshire, which was just south of Peterborough, and which eventually became part of Cambridgeshire. And there were two Counties that no longer exist up in the Northwest of England: Westmorland and Cumberland. These two former counties now comprise most of present-day Cumbria (including most of the the Lake District, and the city of Carlisle up near the Scottish border).

Lancashire (which back then included the cities of Liverpool and Manchester), and Cheshire…
A southern section of present-day Cumbria originally belonged to Lancashire – Lancashire had a significant detached enclave on the Furness Peninsula, on the north shore of Morecambe Bay, around Barrow-in-Furness (home of Barrow AFC). Before 1975, Lancashire was a great deal larger…the city of Manchester and the city of Liverpool were both part of Lancashire back then. But also, some parts of both cities’ outer areas were not ever in Lancashire and were actually part of Cheshire. Specifically: Warrington and Widnes were in Cheshire before 1975, and are now part of Merseyside; and Stockport, Altrincham, Hyde, Dukinfield, and Stalybridge were in Cheshire before, and are now part of Greater Manchester. Lancashire lost about two-fifths (40%) of its land after 1974 – around 700 square-miles. There is one section that Lancashire gained after 1974: some sparsely-populated area just north of Blackburn and Burnley, and just south-west of the Yorkshire Dales.

Manchester…
The Metropolitan county of Greater Manchester did not exist before April 1974. Manchester United, Manchester City, Bolton Wanderers, and Wigan Athletic (as well as Oldham and Rochdale) all played in, and still play in, areas that were once part of Lancashire. You can see a stubborn vestige of Lancashire-identification in Bolton Wanderers’ recent crest-change. Because their badge once again includes a Red Rose of Lancashire, despite the fact that the town of Bolton, and where the Wanderers now play (in Horwich, 6 miles west of Bolton) are both part of Greater Manchester.

Liverpool…
Liverpool was part of Lancashire before 1975; now Liverpool is part of the Metropolitan county of Merseyside. And Merseyside – that is to say Greater Liverpool including the Wirral Peninsula – that jurisdiction did not exist before 1975. The Wirral, where Tranmere Rovers play [in Birkenhead], was part of Cheshire back then. Merseyside stretches up the Lancashire coast a bit as well, to Southport.

Newcastle…
Up in the Northeast, back before April 1974, the Metropolitan county of Tyne and Wear did not exist. Newcastle was part of Northumberland. And Sunderland was part of County Durham, along with other parts of urban north-east Durham (Gateshead and South Shields). Without Newcastle, Northumberland (the northern-most county in England), is now one of the least-populated counties.

Yorkshire (the largest Historic county)…
The Historic County of Yorkshire was once, over a thousand years ago, a part of the Viking kingdom of Jórvík (Danish York, from 867 to 954). The Historic County of Yorkshire was one vast county that was subdivided into 3 Ridings, plus an obscure section west of the city of York called the Ainsty of York. (Riding is an Old Norse term – Threthingr – which means: one-third part of a thing.) Two of the three old Ridings of Yorkshire correspond – generally – with the modern-day (post-1974) counties. The North Riding of Yorkshire morphed into North Yorkshire, which is now a large mushroom-shaped county (with the city of York in the mushroom-shape’s stem). Also generally unchanged is the East Riding of Yorkshire (which includes Hull, there on the north shore of the Humber Estuary). But the West Riding of Yorkshire changed quite a bit after 1974…the West Riding of Yorkshire, after 1974, was basically divided into two. Now there is West Yorkshire, which has the city of Leeds, and just west of that, the city of Bradford, as well as Huddersfield and Halifax towards the west, and then to the border at the Pennine Chain. (The Penninnes are the low mountain range that has traditionally separated Yorkshire from Lancashire and Northwest England.) And now there is South Yorkshire, which was also created in April 1974, and which is where Sheffield, as well as Barnsley, Rotherham, and Doncaster, are located. As mentioned at the top of this section, the counties of West Yorkshire and South Yorkshire are two of the 6 counties that are designated as Metropolitan counties.

With the term ‘Yorkshire’, one can perhaps best see how, in some ways, the old Historic county set-up never really went away. I say this because people from there will usually simply describe themselves as ‘from Yorkshire’, not differentiating which of the four modern-day Yorkshire counties they are actually from.
___
Thanks to all at the following links…
Sources:
Football League…
-English Football League (en.wikipedia.org).
-A complete history of the Football League, of which Derby County were a founder member (dcfc.co.uk).
-1920-21 Football League (en.wikipedia.org).
-The 1920-21 English Football League First Division…Table Standings; Top 10 Goal Scorers (melaman2.com). [Note: only source I could find for Top Scorers in 1920-21.]
-Historical Kits.co.uk…English_Football_League [kits, by club, through the years].
-European Football Statistics.co.uk…[Attendance] {To access, click on England; click on 1920-21.}
-File:England location map.svg (en.wikipedia.org).
-Map of the Thames River Basin District (gre.ac.uk).
Historic Counties of England (and Wales)…
-Historic Counties of England (en.wikipedia.org).
-Wikishire.co.uk/map…https://wikishire.co.uk/map/#/centre=52.917,-4.500/zoom=7 [interactive map] (wikishire.co.uk/map).
-County of London [1889-1965] [Before the much larger Greater London was instituted in 1965, there was the County of London (1889-1965).] (en.wikipedia.org).
-Know Your London.wordpress.com…London – The Counties (knowyourlondon.wordpress.com from Sept. 2017).
-Middlesex County Press.com…But Where Exactly is it Again? (middlesexcountypress.com).
-File:Middlesex 1851 and 1911.png [Boundaries of former County of Middlesex.] (commons.wikimedia.org).
-Historic Surrey [With map showing parts of the County of Surrey lost & gained after 1965.] (exploringsurreyspast.org.uk).
-Gloucestershire…File:Gloucestershire_1832_Map [Shows Bristol as part of Gloucestershire.] (en.wikipedia.org/[History of Gloucestershire]).
-File:Yorkshire_Wapentakes.svg [Ainsty of York, a region of the Historic County of Yorkshire which was a separate jurisdiction from the Three Ridings of Yorkshire.] (wikishire.co.uk).
-1911 map of the County of Berkshire [Shows Berkshire when it was a larger County, and before it included Slough.](upload.wikimedia.org).
-Historic Counties of Wales (en.wikipedia.org).
Blank maps…
-File:English metropolitan and non-metropolitan counties 2010.svg (en.wikipedia.org).
-File:Greater London UK relief location map.jpg (en.wikipedia.org).
[Note: I erased the present-day County boundaries for the main map, drawing in Historical County boundaries {see links above}; I used both the present-day Greater London boundary and the present-day London Borough boundaries as an under-layer backdrop for the London map.]
Populations of cities…
List of towns and cities in England by historical population (en.wikipedia.org).

Photo and image credits on map page…
Burnley section:
Aerial photo of Turf Moor (1929) by unknown photographer for Burnley Express via en.wikipedia.org. 1920-21 Burnley FC official programme banner [April 1921], from clarets-mad.co.uk. Team photo of Burnley FC (1922) [1922 Chums trading card], via doingthe92.com/["Chums" football teams (1922)]. Joe Armstrong [1921], unattributed at vintagefootballers.com. John Haworth, from burnleyfootballclub.com. Burnley FC team photo (1921), unattributed at clarets-mad.co.uk. Burnley 1920-21 kit, illustration by historicalkits.co.uk. Jerry Dawson [1922 Sport and Adventure Famous Footballers trading card], from doingthe92.com.
Tommy Boyle [Captain], (1922 Gem trading card) from doingthe92.com/[The Gem Library "Special Real Photo" (1922)]. Bob Kelly (1922 trading card by DC Thomson), from doingthe92.com/[DC Thomson "British Team of Footballers" (1922)]. Joe Armstrong [1921], unattributed at vintagefootballers.com.

Section for Top scorers in 1920-21 First Division:
Data: The 1920-21 English Football League First Division…Table Standings; Top 10 Goal Scorers (melaman2.com). [Note: this was the only source I could find for an actual list of the Top Scorers in 1920-21.]
Joe Smith (Bolton), unattributed at twitter.com/[@MemorabiliaMal. Tommy Browell (Man City), 1922 Gem trading card from doingthe92.com/[The Gem Library "Special Real Photo" (1922)]. Charlie Buchan (Sunderland), colorized photo unattributed at Sunderland message board site at readytogo.net. Billy Walker (Aston Villa), 1923 trading card from doingthe92.com/[The Gem Library "Autographed Action Series" (1923)]. George Elliott (Middlesbrough), 1914 colorized photo from an unattributed trading card at vintagefootballers.com.

Base maps:
both are by Nilfanion…
-File:English metropolitan and non-metropolitan counties 2010.svg (en.wikipedia.org).
-File:Greater London UK relief location map.jpg (en.wikipedia.org).

-Illustrations of Kits:
Historical Kits.co.ukEnglish_Football_League [kits, by club, through the years].
-1920-21 Football League attendance figures from european-football-statistics.co.uk/[1921 England Attendance].

Legend for Map & the Banner at foot of map:
-Compass rose from de.123rf.com.
-Banner Segments from these sources: The Scroll [from cover of 1920-21 FA Cup Final programme] via co.pinterest.com; Text and the old-style Ball image are from 10footballs.com/the-programmes-192122-2/.

July 4, 2020

1929 Major League Baseball: map with crests & uniforms, final standings and stats leaders; champions: Philadelphia Athletics. With illustrated article: The 1929 and 1930 Philadelphia Athletics: the most overlooked team in baseball history.

Filed under: Baseball,Baseball-1929 MLB season,Retro maps — admin @ 12:00 pm

mlb_al_nl_1929-map_w-uniforms_logos_standings_stats-leaders_1929-ws-champs_philadelphia-athletics_post_f_.gif
1929 Major League Baseball: map with crests & uniforms, final standings and stats leaders; champions: Philadelphia Athletics


By Bill Turianski on the 4th of July 2020; twitter.com/billsportsmaps.

Links…
Sources…
-Baseball-Reference.com, 1929 AL season; 1929 NL season.
-SportsLogos.net.
-Baseball Hall of Fame’s Dressed to the Nines (uniforms illustrated by Marc Okkonen), exhibits.baseballhalloffame.org/dressed_to_the_nines/database.htm.
-Most logos: sportlogos.net.
-US cities’ populations (1920 figures), biggestuscities.com/1920.
-Lost in History [the 1929-31 Philadelphia Athletics] (by William Nack from Aug 1996 at si.com/[vault]).
-Connie Mack’s Second Great Athletics Team: Eclipsed by the Ruth-Gehrig Yankees, But Even Better (by Bryan Soderholm-Difatte, from 2013, at sabr.org).

Links to the other 4 maps in this category (MLB retro maps from the 1920s)…
-1925 MLB map (Pittsburgh Pirates, champions; w/ an article on MLB attendance, by team, circa the 1920s).
-1926 MLB map (St. Louis Cardinals, champions; w/ a chart of 1920s US city populations & cities with MLB teams).
-1927 MLB map (New York Yankees, champions; w/ an illustrated article on the 1927 NY Yankees).
-1928 MLB map (New York Yankees, champions; w/ an illustrated article on the 1928 NY Yankees).

    The 1929 and 1930 Philadelphia Athletics: the most overlooked team in baseball history

The 1927 and 1928 New York Yankees are remembered as one of the greatest, if not the greatest, teams of all time. But in 1929, the Yankees finished a distant 18 games behind the Philadelphia Athletics of owner-and-manager Connie Mack. The Yankees also failed to win the AL pennant in the next two seasons of 1930 and ’31. So, not to take anything away from the “Murderer’s Row” Yankees, but something is going on here that needs to be put into perspective. Let me ask you this…if the 1927 and ’28 Yankees, led of course by Babe Ruth and Lou Gehrig, were the greatest team of all time, then why didn’t the Yankees of the late-1920s-and-early-1930s win more World Series titles? Because Gehrig was still young and healthy, and Ruth was still in his prime.

It may surprise some to know that the Yankees of Ruth and Gehrig won only 4 World Series titles in the 12 seasons the two played together (in 1923, in 1927, in 1928, and in 1932). And that first Yankee title in 1923 was won when Gehrig wasn’t even a starter. So what stood in the way of the “Murderer’s Row” Yankees from winning more titles? The answer is the Philadelphia Athletics, who won 3 straight American League pennants, from 1929 to 1931. The Yankees finished 18 games behind the A’s in 1929. Then the Yankees finished 16 games behind the A’s in 1930. Then the Yankees finished 13.5 games behind the A’s in 1931. Heck, in 1930, the Yankees didn’t even finish in 2nd place (the Washington Senators did).

There are a couple of reasons why the dominant 1929-30 Philadelphia Athletics are so forgotten. First of all, the 1929-30 Philadelphia A’s have always been overshadowed by the 1927 and ’28 New York Yankees, and the long-ball legacy of the Ruth-&-Gehrig-led Bronx Bombers. And the second reason? It also has to do with New York…the largely New York-based sports media that basically ignored how great the 1929 (and 1930) Philadelphia Athletics actually were. As famed sportswriter Shirley Povich said, “The A’s were victims of the Yankee mystique. Perhaps the 1927 Yankees were the greatest team of all time. But if there was a close second, perhaps an equal, it was those A’s. They are the most overlooked team in baseball.”

The core of the Philadelphia Athletics in 1929 and ’30 was four Hall of Fame players…the slugging threesome of outfielder Al Simmons, catcher Mickey Cochrane, and 1st baseman Jimmie Foxx, plus pitcher Lefty Grove. Grove was one of the hardest-throwing left-handers ever (so said another great flamethrower, Walter Johnson). Lefty Grove had the best ERA in the AL for 4 straight seasons (1929-32). In 2001, Lefty Grove was named the second-best pitcher of all time, by Sabermetrics-founder Bill James. This foursome all came together in a 2-year span (1924-25), under Connie Mack (aka the Tall Tactician), who had a keen eye for talent, and an extensive scouting network.

Granted, if you want to talk pure hitting numbers, circa 1926 to 1932, the Philadelphia Athletics, for all their considerable offensive clout, were no match for New York Yankees. But no team was (and no team has been, ever). The Yankees absolutely dominated offensively between 1926 and 1932, leading not just the AL, but all of MLB, in scoring, in 6 of those 7 years. {You can see more on 1927 Yankees offensive stats in my 1927 map-&-article, here.} But home runs might get the headlines, but pitching and defense are ultimately the keys to a successful ball club. And the Philadelphia Athletics were a much more complete team, because their fielding – and especially their pitching – was superior. The 1929-to-’31 Athletics committed 137 less errors than the Yankees did in that same time period {see this, from en.wikipedia.org/[History of the Philadelphia Athletics]}. And the Athletics’ pitching from 1926 to 1932 was simply in a class by itself. In those 7 years, the Athletics had a total Pitching WAR (Wins After Replacement) that was 142.5, or a yearly average of 20.3 Pitching WAR. The Yankees in the same time period of 1926-32 had a total Pitching WAR of 65.2, or a yearly average of just 9.3 Pitching WAR. That is 11.0 less Pitching WAR, per year, from the Yankees, compared to the Athletics. It must be conceded that, in 1929 and ’30, the Yankees’ pitching staff was transitioning from the aged Herb Pennock and Waite Hoyt, to the young Red Ruffing and Lefty Gomez, and the Yankees’ Pitching WAR in 1929 and ’30 was dead-last in the AL. But in all those 7 years (of 1926 to 1932), the Athletics pitchers had a better Pitching WAR than the Yankees in all but one season, in 1927, and that was by only 0.4 WAR {this data was found in this article at SABR.org, which is also linked to below}. It wasn’t just the A’s ace southpaw Lefty Grove, with a 7.1 Pitching WAR in 1929, that was so effective for the Philadelphia Athletics, there were two other standouts: Rube Walberg (6.1 Pitching WAR in 1929), and George Earnshaw (5.2 Pitching WAR in 1929). Grove and Walberg, using WAR, were among the 5 best pitchers in the AL from 1926 to ’32. From 1928 to ’32 (5 seasons) Lefty Grove had an astounding .795 winning percentage, with 128 wins and just 33 losses.

And there is this…“no New York Yankees team over any five-year period— not with Ruth, not with Gehrig, not with DiMaggio, not with Mantle, not with Jeter—ever had as high a winning percentage as the 1928–32 Philadelphia Athletics.” {Quotation from article by Bryan Soderholm-Difatte at SABR.org, which is linked to in the next paragraph below}. In the 5-year-span of 1928-32, the Philadelphia Athletics went 505-258 (.657). The Philadelphia A’s of that time-period also were the first ever team to win 100 games in a season for 3 consecutive seasons (1929-31).

Some flat out proclaim that Connie Mack’s Philadelphia Athletics of the late-’20s/early-’30s were simply better than the Yankees of Ruth & Gehrig…
-Connie Mack’s Second Great Athletics Team: Eclipsed by the Ruth-Gehrig Yankees, But Even Better (by Bryan Soderholm-Difatte, from 2013, at sabr.org).

-Lost In History – From 1929 to 1931, the Philadelphia A’s were the best team in baseball, with four future Hall of Famers and a lineup that dominated Babe Ruth’s legendary Yankees. So why hasn’t anyone heard of them (by William Nack from Aug 1996 at si.com/[vault]).

(Note: the above article by William Nack at Sports Illustrated is an absolute gem, but there is one discrepancy that I need to point out. Nack says, in reference to the New York-vs-Philadelphia rivalry that “In the early days of the 20th century Philadelphia was the nation’s second city, and its teams’ most memorable clashes on baseball diamonds–first against the Giants and later against the Yankees–expressed the city’s aspiration to reclaim its place as the nation’s center.” However, Philadelphia was definitely not the nation’s second city back then…Chicago was. Philadelphia was supplanted by Chicago as the second-most populous city in the USA as early as the 1890s {see this, from en.wikipedia}. I have 1920 US city populations listed on the map-page (at the upper-left-corner of the map), and they are US Census Bureau figures. Here are the 1920 city population figures from the US Census Bureau…Top 3 US cities’ populations in 1920, New York City: 5.6 million; Chicago: 2.7 million; Philadelphia: 1.8 million {source: census.gov/[Population of the 100 Largest Urban Places: 1920]. I know it is a small point, and it does not diminish the author’s underlying theme, namely, that Philadelphians had (and certainly still have) a deep-rooted chip on their shoulders about the preeminence of New York City, and Philadelphia’s lost status as the former largest city in the country.)

I think there is another reason why the 1929-30 Philadelphia Athletics have been effectively banished from the collective memory of baseball fans. And that is this: the Philadelphia Athletics all but ceased to exist when the franchise moved to Kansas City, in 1955. Then the franchise moved again, 13 years later, in 1968, to Oakland, California. There was a diminished interest for the old team, back in Philly. After all, Philadelphia still had a major league ball club (the Phillies), so there never was that culture of loss and nostalgia that defines the Brooklyn Dodgers’ hallowed place in baseball history. There are many, many books written about the Brooklyn Dodgers. There are hardly any books written about the Philadelphia Athletics. Only the old-timers who had seen the greatness of the 1929-30 Athletics first-hand, there in Philadelphia, were keeping the flame alive, so to speak. The following generations of baseball fans in Philadelphia (and elsewhere) never were adequately told about the great Athletics teams in Philadelphia.

Even the Oakland A’s themselves have ignored, and still ignore, the greatness of the 1929-30 Philadelphia Athletics…
If you go to an Oakland A’s game at the Oakland Coliseum, the only vestige you will see of the 5-time-World-Series-title-winning-/-9-time-AL-pennant-winning Philadelphia Athletics is in the present-day team’s uniforms: the Athletics’ Gothic-A cap-logo and their shoulder-patch elephant-logo (which dates to 1902). Because sadly, the Oakland A’s do not, in any way, acknowledge their own franchise’s 5 World Series titles that were won in Philadelphia. Here is the Oakland A’s World Series-titles banner outside their ballpark…it only shows the 4 World Series titles that the franchise won in Oakland. In other words, the Oakland Athletics themselves do not even acknowledge the greatness that was the Philadelphia Athletics.

And if you think no other transplanted MLB teams do this, well, here is what the Los Angeles Dodgers have at their Dodger Stadium…a set of banners showing every Dodgers World Series title, including the 1955 WS title won when the team was still in Brooklyn. Also at Dodger Stadium are giant murals of Dodgers MVPs and Cy Young winners [both of which include Brooklyn Dodgers players]. There is also a giant World Series-ring sculpture of the 1955 Brooklyn Dodgers there at Chavez Ravine {here /here is where I found the last three images: The Artful Dodgers (at bryanhg.wordpress.com).} Remember, this is an MLB franchise (the Dodgers) that is a class act, but still…all this tribute to their former location (in Brooklyn), and yet the Brooklyn Dodgers only won ONE TITLE. Meanwhile, the Philadelphia Athletics won 5 TITLES…and the Oakand A’s, the MLB franchise that originated as the Philadelphia Athletics 120 years ago, shows absolutely no tribute – at all – to where they came from (Philadelphia), and how great they were, way back then. Pathetic. Well, at least one fan in the Bay Area agrees with me…{Concept for a new banner at the Coliseum – 4/21/2020 (from the A’s Fan Radio site, asfanradio.com).

    The Philadelphia Athletics beat the Chicago Cubs 4 games to 1, to win the 1929 World Series

Before Game 1 (on October 8 1929 at Wrigley Field in Chicago), the big question was how the Cubs’ right-handed sluggers would fare against the Athletics’ ace pitcher, the southpaw Lefty Grove (Grove was one of the the best pitchers in 1929, with a 20-6 record, and an MLB-best 2.81 ERA). But Philadelphia Athletics manager Connie Mack shocked everyone, by keeping Lefty Grove on the bench, and starting the unheralded, and seemingly washed-up 35-year-old side-arm junk-ball hurler Howard Ehmke. (In August, after the A’s had clinched the Pennant, Ehmke had stayed in Philadelphia during an A’s late-season road trip, with the job of scouting out the Cubs hitters when they came to town to play the Philadelphia Phillies. So Connie Mack had planned on this surprise move for some time.)

The Cubs right-handed power hitters were nullified by the soft-throwing right-hander Ehmke. Howard Ehmke struck out 13 (a World Series record that stood for 24 years), and allowed just one unearned run. The Athletics’ slugger Jimmy Foxx broke the scoreless game in the 7th inning with a solo HR, and the Athletics won Game 1 by the score of 3 to 1. {Here is a nice 2:28 video on Howard Ehmke, Philadelphia Athletics Howard Ehmke, Hero of the 1929 World Series, uploaded by Philadelphia Sports History at youtube.com.}

In Game 2 (also at Wrigley Field in Chicago), the Athletics broke ahead with a 6-run lead, with HRs by Jimmy Foxx and Al Simmons. In the bottom of the 5th inning, A’s starter George Earnshaw got into trouble, and Connie Mack put Lefty Grove on, in relief. Grove pitched 4 and 1/3 innings of scoreless ball, and the Athletics won Game 2 by the score of 9 to 3. (And the A’s pitchers struck out 13 Cubs, again.)

In Game 3 (at Shibe Park in Philadelphia), the Cubs beat the Athletics 3 to 1. The Cubs won on the strength of Pitcher Guy Bush, who allowed 1 run in 9 innings. The Cubs scored 3 runs in the 6th inning, with 2 runs driven in by a Kiki Cuyler single, and one run driven in by a Rogers Hornsby single. Athletics Pitcher George Earnshaw gave up just 1 earned run in 9 innings for the loss.

In Game 4 (at Shibe Park in Philadelphia), Connie Mack stuck to his right-handed pitchers policy, starting another journeyman, Jack Quinn. But Quinn gave up 7 runs in 6 innings. The Cubs had an 8-0 lead when the Athletics came to bat in the 7th inning. 13 batters later, the Cubs found themselves trailing 10-8. {Via Old-Time Baseball Photos on twitter, here is a photo of Mule Haas sliding into home for his Inside-the-park HR, which pulled the A’s to within one run at 8-7.} That 10-8 score stood, as Lefty Grove pitched two innings of perfect relief to clinch the victory. The eight-run comeback by the Philadelphia Athletics on October 12, 1929 is still the greatest comeback in MLB post-season history. In the illustration below, you can see a batter-by-batter re-cap of the legendary 7th inning 8-run comeback by the Philadelphia A’s (which featured 15 batters, 10 runs, and two balls lost in the sun by beleaguered Cubs Center Fielder Hack Wilson). {Here is a brief article at baseball-reference.com/blog on the greatest comebacks in MLB regular season & post-season history, Biggest Comeback Wins in Baseball History (by Alex Bonilla at sports-reference.com/blog on Jan 29 2019).}

Game 5 (at Shibe Park in Philadelphia). Connie Mack started Howard Ehmke again, but this time Ehmke was ineffective, and was replaced by Rube Walberg in the 4th inning, with the A’s down 2-0. That score stood until the 9th inning, with the A’s down to their last two outs. Then, for the second straight game, the Athletics produced a comeback rally. Max Bishop singled, then Mule Haas’ HR made it 2-2. Cochrane grounded out, but Al Simmons doubled, and after an intentional walk to Jimmie Foxx, Bing Miller doubled, to score Simmons and clinch the Series.

Below: 1929 World Series: Philadelphia Athletics beat Chicago Cubs 4 games to 1; the Series included the greatest comeback in MLB post-season history (A’s come back from 8 runs down to win Game 4, 10-8)...
philadelphia-athletics_1929_worldseries-champions_athletics-4-games_cubs-1_wrigley-field_shibe-park_athletics-have-greatest-comeback-in-mlb-postseason-history_h_.gif
Photo and Image credits above – Logos from
sportlogos.net. Segment of 1929 Philadelphia Athletics WS program cover, from amazon.com. Segment of 1929 Chicago Cubs WS program from goldinauctions.com. Shibe Park [aerial photo from 1929 photo], unattributed at twitter.com/[@MLBcathedrals]. Wrigley Field [aerial photo from 1929], AP Photo via gladishsolutions.com. Mickey Cochrane, Connie Mack and Lefty Grove [photo circa 1929], AP Photo via ftw.usatoday.com. Small illustration of segment of 1929 Philadelphia Athletics road jersey, by Marc Okkonen at exhibits.baseballhalloffame.org/dressed_to_the_nines/database. Howard Ehmke [photo from 1929], photo by George Rinhart/Corbis via Getty Images at gettyimages.com. Jimmie Foxx [photo from 1928], photo unattributed at pinterest.com. Al Simmons [photo from 1928], photo unattributed at bleacherreport.com. Photo segment of 1929 Philadelphia Athletics home uniform, from auction.lelands.com. 1929 WS Shibe Park unauthorized temporary bleachers atop neighboring row houses, colorized photo unattributed at twitter.com/[@BSmile]. Guy Bush [photo from 1929], photo by Sporting News via Rogers Photo Archive via gettyimages.co.uk. Kiki Cuyler [photo from 1929], unattributed at imagekind.com. Rogers Horsnby [photo circa 1929], unattributed at ebay.com. Al Simmons, Jimmie Foxx [photo from 1930], unattributed at baseballhistorycomesalive.com. Jimmy Dykes, Joe Boley, Max Bishop [photo from 1929], photo by Hank Olen/NY Daily News Archive via Getty Images at gettyimages.com. Mule Haas [photo from 1928], from National Baseball Hall of Fame at njmonthly.com. Bing Miller [Fleer retro-trading card from 1960; photo circa 1929], from psacard.com. A’s players storm the field to congratulate for his Series-winning RBI, photo by National Baseball Hall of Fame Library/MLB via Getty Images via gettyimages.com.

Post-script to the 1929 World Series title won by the Philadelphia Athletics…
Fifteen days after the Philadelphia Athletics’ thrilling World Series victory, the bottom dropped out of the US economy, with Black Tuesday. That was October 29, 1929, when the Stock Market crashed, ushering in the decade-long Great Depression. For the Philadelphia Athletics, this led to the eventual dismantling of their championship team. While the Athletics would go on to win the World Series again, in the following year of 1930 (beating the St. Louis Cardinals 4 games to 2), and then win the AL pennant for a 3rd straight time in 1931, the Depression put an end to any further glory for the Philadelphia Athletics. To avoid financial ruin of the ball club, owner/manager Connie Mack was forced to sell off his prize players for cash (and mediocre players). In 1932, Al Simmons went to the Chicago White Sox. In 1933, Lefty Grove went to the Boston Red Sox, and Mickey Cochrane went to the Detroit Tigers. And in 1935, Jimmie Foxx also went to the Red Sox. The Philadelphia Athletics never contended for another AL pennant. Connie Mack continued on as owner and manager, slipping into dementia. But none dared challenge him, and the Philadelphia Athletics declined to the point where it became inevitable that the franchise would move. Some people say the wrong baseball team moved out of Philadelphia, and I could not agree more.

1929 MLB stats Leaders.
ERA: Lefty Grove, Philadelphia Athletics. Wins: George Earnshaw, Philadelphia Athletics. Batting Avg: Lefty O’Doul, Philadelphia Athletics. HR: Babe Ruth, New York Yankees. RBI: Hack Wilson, Chicago Cubs. OPS: Rogers Hornsby, Chicago Cubs. Wins Above Replacement (WAR) for Position Players: Rogers Hornsby, Chicago Cubs. WAR for Pitchers: Willis Hudlin, Cleveland Indians.

Photo credits on map page…
Banner (Philadelphia Athletics, 1929 World Series Champions)…Photo segment of 1929 Philadelphia Athletics home uniform, from auction.lelands.com. 1929 Philadelphis Athletics WS winners’ ring, unattributed at pinterest.com. 1929 Philadelphia WS press pin, from robertedwardauctions.com/1929-philadelphia-athletics-world-series-press-pin. 1929 WS ticket [to 1929 WS game 5 at Shibe Park], from sports.mearsonlineauctions.com/1929-philadelphia-athletics-chicago-cubs-game-5-world-series-ticket-and-stub. 1929-34 Philadelphia A’s cap, from mlbshop.com. 1929 Philadelphia Athletics uniforms, by Marc Okkonen at exhibits.baseballhalloffame.org/dressed_to_the_nines/[al_1929_philadelphia]. 1929

Connie Mack [photo circa 1929], unattributed at pinterest.com. Al Simmons [photo circa 1928], 1961 Golden Press Card via baseball-almanac.com. Jimmy Foxx [photo circa 1932], colorized photo unattributed at pophistorydig.com. Lefty Grove [US Postal Service Stamp; original image circa 1930], from mysticstamp.com. Rube Walberg [photo circa 1929], photo by Getty Images via gettyimages.dk. George Earnshaw [photo from 1928], unattributed at sports.mearsonlineauctions.com. Mickey Cochrane [photo circa 1930], unattributed at pinterest.como. Jimmy Dykes [photo circa 1927], unattributed at baseball-fever.com/[thread: Philadelphia Athletics 1928-32].
1929 MLB Stats leaders…
Lefty Grove [photo circa 1929], photo by Getty Images via si.com. George Earnshaw [photo circa 1929], photo unattributed at phillysportshistory.com. Lefty O’Doul [photo from 1930], photo unattributed at digitalcollections.detroitpubliclibrary.org. Babe Ruth [photo circa 1928], photo unattributed at m.mlb.com/player. Hack Wilson [photo circa 1929], photo by AP via espn.com. Rogers Hornsby [photo from 1929], colorized photo unattributed at ebay.com. Willis Hudlin [photo from 1928], photo unattributed at letsgotribe.com/[top-100-indians-34-willis-hudlin].

Thanks to all at the following links…
Sources:
-University of Texas at Austin online archive (Perry-Castañeda Library Map Collection), legacy.lib.utexas.edu/maps/united_states.html.
-Baseball-Reference.com, 1928 AL season1928 NL season.
-Baseball Hall of Fame’s Dressed to the Nines (uniforms illustrated by Marc Okkonen), exhibits.baseballhalloffame.org/dressed_to_the_nines/database.htm.
-US cities’ populations (1920 figures), biggestuscities.com/1920.
-Attendances. Source: baseball-reference.com/leagues/MLB/1928-misc.shtml.
-Lost in History [the 1929-31 Philadelphia Athletics] (by William Nack from Aug 1996 at si.com/[vault]).
-Connie Mack’s Second Great Athletics Team: Eclipsed by the Ruth-Gehrig Yankees, But Even Better (by Bryan Soderholm-Difatte, from 2013, at sabr.org).
Most logos from:
-SportsLogos.net, sportslogos.net/[MLB logos].
1929-34 Philadelphia A’s cap, from mlbshop.com. Photo of 1929 NY Giants jersey from Alamy at alamy.com/stock-photo/new-york-giants-baseball. Photo of Detroit Tigers 1929 road ball cap from vintagedetroit.com. Segment of Philadelphia Athletics 1929 home jersey, from worthpoint.com.

April 27, 2020

1928 Major League Baseball: map with crests & uniforms, final standings and stats leaders; champions: New York Yankees.

Filed under: Baseball,Baseball-1928 MLB season,Retro maps — admin @ 11:15 am

http://billsportsmaps.com/wp-content/uploads/2020/02/mlb_al_nl_1928-map_w-uniforms_logos_standings_stats-leaders_1928-ws-champs_new-york-yankees_post_b_.gif
1928 Major League Baseball: map with crests & uniforms, final standings and stats leaders; champions: New York Yankees


By Bill Turianski on 27 April 2020; twitter.com/billsportsmaps.
Links…
Sources:
-Baseball-Reference.com, 1928 AL season; 1928 NL season.
-Baseball Hall of Fame’s Dressed to the Nines (uniforms illustrated by Marc Okkonen), exhibits.baseballhalloffame.org/dressed_to_the_nines/database.htm.
-US cities’ populations (1920 figures), biggestuscities.com/1920.
-Attendances. Source: baseball-reference.com/leagues/MLB/1928-misc.shtml.
-Most logos. Source: SportsLogos.net, sportslogos.net/[MLB logos].

Aspects of the map-and-chart:
A). 1928 location-map of the 16 MLB teams. Home cities listed, then franchises listed in smaller text below the home-city name. Each team (franchise) has at least one logo from that year (in this case, 1928); the logos are sized to reflect average attendance from that season: the higher-drawing teams have larger logos-and-or-multiple-logos. In this case, that applies to the top-drawing teams in the NL in 1928 (the Chicago Cubs and the NY Giants, as well as the Brooklyn Robins [aka Dodgers], and the St. Louis Cardinals), and it applies to the top-drawing teams in the AL in 1928 (the New York Yankees, as well as the Philadelphia Athletics). Similarly, the lower-drawing teams in MLB that season have much smaller logos on the map (in this case, such as the Boston Braves and the Philadelphia Phillies).

In my first MLB retro map, I took a look at attendance figures – by team – in this era…{here, 1925 MLB retro map [Pirates win WS].}

B). Population of US cities (1920 figures). A small chart showing the 25-then-largest cities of the USA in 1920 is shown at the upper-left-hand side of the map. MLB representation-by-city is noted there. In my 1926 and 1927 retro MLB maps, I took a look at Populations of US Cities (1920 figures), with a small expanded chart of the one on the map…{1926 MLB retro map [Cardinals win WS].} {1927 MLB retro map [Yankees win WS].}

C). Attendance {data from baseball-reference.com}. 1928 MLB team average attendances are shown at the upper-right of the map. Two paragraphs above is a link to an article I wrote about MLB attendance team-by-team, circa the 1920s.

D). World Series champions (for 1928, the New York Yankees). World Series champions are represented by a prominent section at the top of the map. A photo of the manager of the WS winner is shown (Miller Huggins), along with 7 photos of the top players on the WS-winning Yankees of 1928 (Babe Ruth, Lou Gehrig, Herb Pennock, Waite Hoyt, Tony Lazzeri, George Pigras, Earle Combes). The players shown were determined by WAR [Wins After Replacement]. Players who have been elected to the Baseball Hall of Fame [HoF] are noted, by a bronze-colored square with year of HoF election listed.

E). Top players in MLB for 1928 are shown at the foot of the map. Photos of stats leaders in several categories are shown…for Pitchers: ERA, Wins, and WAR (Pitchers); for Position-Players: Batting Average (BAvg), HR, RBI, OPS, and WAR. Again, HoF players are noted.

1928 MLB stats leaders…
ERA, Dazzy Vance (Brooklyn). Wins: [joint-best] Larry Benton (NY baseball Giants) / Burleigh Grimes (Pittsburgh). WAR (for pitchers), Dazzy Vance (Brooklyn). BAvg, Rogers Hornsby (Boston [NL]). HR, Babe Ruth (NY [AL]). RBI, Lou Gehrig (NY [AL]). OPS, Babe Ruth (NY [AL]). WAR (for position players), Babe Ruth (NY [AL]).

F). MLB team sections: flanking sections, in alphabetized chart-form, show the 8 NL franchises (of 1928) on the far-left of the map, and the 8 AL franchises (of 1928) on the far-right of the map. The sections include several things…In each franchise’s rectangular box is shown their uniforms from that season, and at least one of their primary logos from that season, along with a narrow bar that is in the team’s colors that season. A photo of the present-day-franchise’s home ball cap is shown [2020 ball caps]. And franchise info is shown for each team, including: years of existence [seasons in NL or AL], location(s), league-titles [Pennants] and MLB titles [WS titles], plus any franchise movements. Standard abbreviations for each team are used. As far as former teams go, to avoid any confusion, I used baseball-reference.com’s abbreviations. {Here: baseball-reference.com/about/[team_IDs](MLB team abbreviations).}

    1928: New York Yankees win their second straight World Series title, with another Series-shutout…

In 1928, the American League’s New York Yankees won their second consecutive (and then-3rd overall) World Series title. Coming off the heels of the legendary 1927 Yankees (when they swept the Pittsburgh Pirates in 4 games), the 1928 Yankees repeated, by sweeping the National League’s St. Louis Cardinals. The Yankees beat out the Philadelphia Athletics by 2.5 games for the 1928 AL pennant; the Cardinals beat out the Cubs (by 2 games) and the Giants (by 4 games), for the NL pennant.

The Yankees used only 3 pitchers in the 1928 World Series: Waite Hoyt, Tom Zachary, and George Pipgras {see photo below}. Between them, they pitched 4 Complete Games. In the 1st game, RHP Waite Hoyt held the Cardinals to just 3 hits. Hoyt went the distance, and the Yankees won 4-1, with Bob Meusal hitting a HR. In the 2nd game, RHP George Pipgras also went the full 9 innings, as the Yanks won 9-4. Lou Gehrig hit a 3-run HR in the 1st inning. Pipgras gave up just 4 hits.

Two days later (Oct. 7 1928) in St. Louis, Missouri, the Yankees won their 3rd straight complete-game-win. This time, the pitcher was journeyman LHP Tom Zachary. (Zachary was picked up off waivers from Washington in August, replacing the injured Herb Pennock.) The Yanks won 7-3, on the strength of Lou Gehrig’s 2 HRs. In the 4th and final game, Waite Hoyt again threw a complete game. The Yankees hit 4 HRs…3 HRs by Babe Ruth, and one HR by Lou Gehrig (his 4th of the Series). The final score, again, was 7-3. The Yankees had swept, and they had avenged their 1926 Fall Classic loss to the Cardinals.

1927 / ’28 was the first time a team had ever swept back-to-back World Series contests. No other ball club in Major League Baseball has accomplished the feat of back-to-back World Series sweeps…but the New York Yankees have gone on to do it two more times…in 1938 / ’39, and then in 1998 / ’99.

Below: 1928 New York Yankees: the first team to ever sweep back-to-back World Series titles…
1928_ny-yankees_ws-champions_babe-ruth_lou-gehrig_waite-hoyt_george-pipgras_tom-zachary_c_.gif
Photo and Image credits above -
Photo from right-field bleachers at Yankee Stadium [opening game of 1928 World Series], from a screenshot from a video uploaded by New York Yankees at youtube.com. Waite Hoyt, Tom Zachary, George Pipgras [photo taken before game 1 of the 1928 WS]: photo from gettyimages.com. Gehrig and Ruth [circa 1928], photo from Wikimedia Commons via pinstripealley.com.

___

Photo and Image credits on the map page…
1928 World Series champions New York Yankees…
Babe Ruth [colorized photo from 1928], photo unattributed at twitter.com/[@baseballincolor]. Lou Gehrig [photo circa 1927], from Bettman-Corbis/Getty Images via si.com. Herb Pennock [photo circa 1928], unattributed at cmgworldwide.com. Waite Hoyt [photo circa 1928], unattributed at baseballhall.org. Tony Lazzeri [photo from 1929], photo unattributed at mearsonlineauctions.com. George Pipgras [photo circa 1928], unattributed at fold3.com. Earle Combs [photo circa 1927], unattributed at pinterest.com. Miller Huggins [colorized photo circa 1929], photo unattributed and colorized by Don Stokes at baseballhistorycomesalive.com. “Murderers Row”, featuring Gehrig, Ruth, Combes, Lazzeri [colorized photo from 1929], photo unattributed at flickr.com/[Willie Brown]. Photo of 1928 World Series Game 1 ticket, from hugginsandscott.com.

1928 MLB stats leaders…
Dazzy Vance (BRO) [photo circa 1928], photo unattributed at sabr.org. Larry Doyle (NYG) [photo circa 1928], trading card from vintagecardprices.com. Burleigh Grimes (PIT) [photo circa 1929], photo unattributed at oldbucs.blogspot.com. Dazzy Vance (BRO) [photo circa 1924], photo unattributed at mearsonlineauctions.com. Rogers Hornsby (BSN) [photo from 1928], photo from the cover of Time Magazine via File:Rogers Hornsby 1928.jpg (commons.wikimedia.org). Babe Ruth (NYY) [photo circa 1927], unattributed at huntauctions.com. Lou Gehrig (NYY) [photo circa 1928], unattributed at sabr.org. Babe Ruth (NYY) [photo circa 1927], from Bettman-Corbis/Getty Images via si.com.

Thanks to all at the following links…
Sources:
-University of Texas at Austin online archive (Perry-Castañeda Library Map Collection), legacy.lib.utexas.edu/maps/united_states.html.
-Baseball-Reference.com, 1928 AL season1928 NL season.
-Baseball Hall of Fame’s Dressed to the Nines (uniforms illustrated by Marc Okkonen), exhibits.baseballhalloffame.org/dressed_to_the_nines/database.htm.
-US cities’ populations (1920 figures), biggestuscities.com/1920.
-Attendances. Source: baseball-reference.com/leagues/MLB/1928-misc.shtml.
Most logos from:
-SportsLogos.net, sportslogos.net/[MLB logos].
-1928 Detroit Tigers home jersey script- logo, illustration from flickr.com/photos/heritagesportsart.
-1928 NY Giants road cap logo, photo from sportscards.com.

January 28, 2020

American Football League: 1962 AFL season, map with helmets/jerseys & final standings + offensive stats leaders; champions: Dallas Texans [future Kansas City Chiefs]. /+ article: History of the Kansas City Chiefs (including origins of nickname, venues played in, helmet history).

Filed under: AFL (gridiron football),AFL, 1962 map/season,Retro maps — admin @ 11:57 am

afl_1962_3rd-season_map_w-final-standings_o-stats-leaders_champions-dallas-texans_post_c_.gif
American Football League: 1962 AFL season, map with helmets/jerseys & final standings


By Bill Turianski on 28 January 2020; twitter.com/billsportsmaps.
Links…
-1962 AFL season
-1962 AFL Championship Game (en.wikipedia.org).
-1962 AFL season (pro-football-reference.com).
-Illustrated History of Kansas City Chiefs’ uniforms (1960 to 2018)…from Gridiron Uniforms Database (gridiron-uniforms.com).

The map (click on image at the top of the post)…
The map shows the primary helmets and jerseys worn by the 8 AFL teams of 1962, the third season of the American Football League (IV) (1960-69). At the lower-right of the map-page are the final standings of the 1962 AFL, along with home jerseys and helmets of the 8 AFL teams of 1962. At the bottom-right corner are the attendance figures for the 1962 AFL season. At the upper-right of the map-page are standout players for the champions, the 1962 Dallas Texans (the franchise that became the Kansas City Chiefs in the following season of 1963). Below the Dallas Texans of 1962 section of the map page, is a section for 1962 AFL Offensive Leaders, in the following categories: QB Rating & TD Passes: Len Dawson, Dallas Texans. Passing Yardage: Frank Tripucka, Denver Broncos. Rushing Yardage: Cookie Gilchrist, Buffalo Bills. Yards from Scrimmage & Total TDs: Abner Haynes, Dallas Texans. Receiving Yards: Art Powell: New York Titans.

In the 1962 AFL Championship Game, played at Jeppesen Stadium in Houston, Texas, on December 23 1962, the Dallas Texans defeated the Houston Oilers 20-17 in double-overtime. The Texans, coached by Hank Stram and led by QB Len Dawson, had two TDs by RB Abner Haynes. But it took 17:54 of overtime play (2:54 into the 6th quarter), for the Texans to get a 25-yard FG to beat the Oilers (who were the two-time-reigning AFL champions). It was, at the time, the longest pro gridiron football game ever played, and to this day it remains the longest championship game played in the sport. {See photos in illustration further below.}

    The AFL (of 1960-69) had a 10-year battle with the established pro football league, the NFL.

In 1970, the AFL essentially won the battle, by virtue of the fact that the NFL allowed all 10 of the AFL franchises to join the NFL, in a full dual-league merger. Plus, the AFL won the last two match-ups with the NFL…Super Bowl III (1968 season) saw the AFL’s New York Jets beat the NFL’s Baltimore Colts, and Super Bowl IV (1969 season) saw the AFL’s Kansas City Chiefs beat the NFL’s Minnesota Vikings {see the next few paragraphs for more on that}.

After the 1962 AFL season, there were two AFL franchises that would soon change their identities dramatically. These two teams in 1962/63 were the very competitive Dallas Texans (soon to become the Kansas City Chiefs), and the hapless and broke New York Titans (soon to become the New York Jets). These two franchise-changes following the 1962 season considerably helped the AFL in its battle for legitimacy.

The Dallas Texans, who went on to win the 1962 AFL Championship Game, were saddled with a taxing local rivalry with the NFL’s Dallas Cowboys. The AFL team could not compete with the drawing-power of the NFL, despite the fact that the AFL team in Dallas (the Texans) were championship-caliber, while the NFL team in Dallas (the Cowboys) were, at this point in time, a basement-dwelling expansion team. The NFL was just too powerful for even a title-winning AFL team to compete with. {More on this can be seen in the Texans/Chiefs’ Stadiums section, 8 and 9 paragraphs further below.}

In May 1963, 5 months after winning the 1962 title, the AFL’s Texans would leave Dallas, moving 450 miles north to Kansas City, Missouri, to become the Kansas City Chiefs. (The Texans/Chiefs franchise would not change ownership, or color-scheme, with the move). And the New York Titans, under new and more well-funded ownership, would change their name to the New York Jets, changing from dark-blue/yellow-gold colors to green-&-white. And a year after that, in 1964, the re-branded NY Jets would move from the decrepit Polo Grounds in northern Manhattan, NYC to the brand-new Shea Stadium in Queens, NYC…and soon started drawing 50 thousand per game. The Chiefs would not go on to draw quite as well as the Jets would, but they ably filled their new home in KC, the MLB ballpark known as Municipal Stadium. By 1966, the Chiefs were drawing 37-K-per-game, and by 1969 they were drawing 49-K-per-game. {You can see a color photo of their home venue back then (Municipal Stadium in gridiron-football-configuration), and Texans/Chiefs attendance figures, in the illustration below).

And the Kansas City Chiefs kept on with the winning ways they had had in Dallas. The Texans/Chiefs franchise would go on to win two more AFL titles (in 1966 and 1969), as well as winning Super Bowl IV (#4) in January of 1970 (the last of four head-to-head match-ups between the AFL and the NFL) {also see in illustration below}. The Chiefs’ Super Bowl upset-win (over the Vikings) came one year after the AFL pulled off its greatest feat in its 10-year history, when the New York Jets shocked the gridiron football world by beating the heavily-favored Baltimore Colts in Super Bowl III (#3) in January of 1969.

So, the roots of the AFL’s eventual triumph over the NFL, in Super Bowls III and IV, can be found in the time between the 1962 and 1963 AFL seasons, when the Kansas City Chiefs and the New York Jets came into existence.

Note: the article below first appeared in this post from 2014, on the NFL’s AFC West Division…
NFL, AFC West – Logo and helmet history of the 4 teams (Broncos, Chiefs, Raiders, Chargers)./ Origins of nicknames./ Stadiums./ Title-winning teams.

    The Dallas Texans/Kansas City Chiefs: 3 AFL titles & 1 Super Bowl title in a 10-year-span…

dallas-texans_hank-stram_abner-haynes_kansas-city-chiefs_kc-municipal-stadium_super-bowl-iv_len-dawson_buck-buchanan_curley-culp_k_.gif
Photo and Image credits above -
1960-62 Dallas Texans helmet, illustration from gridiron-uniforms.com/chiefs. Albert Haynes, photo unattributed at sportsnola.com. Photo of 1962 Dallas Texans AFL Champions team photo, unattributed at media-cache-ak0.pinimg.com. Hank Stram with AFL championship trophy, photo unattributed at media-cache-ak0.pinimg.com. Abner Haynes in 1962 AFL title game, photo unattributed at ntmeangreenfootball.com. USA blank map by Zntrip at Blank map of the United States. Aerial photo of Kansas City Chiefs playing at Municipal Stadium, photo by Kansas City Chiefs at kcchiefs.com/municipal-stadium-tribute. Hank Stram being carried off the field by Chiefs players after their 1966 AFL Championship Game win over Buffalo, photo unattributed at mmbolding.com/AFL1966. AFL 10 years patch worn by Chiefs in Super Bowl IV, photo unattributed/ uploaded by remembertheafl.com at Super Bowl IV (en.wikipedia.org). Len Dawson taking the snap in Super Bowl IV vs. Vikings, photo unattributed at arrowheadaddict.com/2013/06/16/chiefs-history-and-an-anniversary. Buck Buchanan and Curley Culp tackling Dave Osborn in Super Bowl IV, photo from USA Today via spokeo.com.

    Kansas City Chiefs – logos and helmet history (1960-2019), click on image below…

kansas-city-chiefs_helmet-history_logos_1960-2014_segment_.gif
Kansas City Chiefs – logos and helmet history (1960-2014)
Texans/Chiefs helmet illustrations above from gridiron-uniforms.com/chiefs. Chiefs uniforms.png by fma12, en.wikipedia.org/wiki/File:Chiefs_uniforms.png. Photo of Chiefs 2012-13 Riddell helmet from thumbs3.picclick.com/d/w225/pict/251241604074_/KANSAS-CITY-CHIEFS-Riddell-Revolution-NFL-Football-Helmet.jpg. Dallas Texans’ 1960-62 wordmark logo from sportsecyclopedia.com/nfl/kcdal/daltexans. Photo of Chiefs’ circa 1970s wordmark logo from fleersticker.blogspot.com.

Origin of Chiefs nickname…
Upon moving his AFL franchise the Dallas Texans to Kansas City, Missouri in 1963, oil-fortune-heir Lamar Hunt was faced with the quandary of having to re-name his franchise. But actually, as hard as it is to believe, Hunt (at first) wanted to keep the nickname and call the team the Kansas City Texans. It took his right-hand-man, Jack Steadman (who was the Texans/Chiefs GM and vice president of operations), to convince Hunt otherwise. The mayor of Kansas City then, H. Roe Bartle, who was very instrumental in the city being able to lure the AFL franchise away from Dallas, was nicknamed “the Chief” (from his days as a Scout Executive of the St. Joseph and Kansas City Boy Scout Councils 35 years previously when he formed a Native Tribes honor society within the Boy Scouts called The Tribe of Mic-O-Say).

The Chiefs became the winning entry (but not the most popular entry by far) into the local name-the-new-team contest that Hunt had organized. The most popular of the 4,866 entries (with 1,020 different names being suggested) were for the nicknames the “Mules” and the “Royals.” “Chiefs”, suggested by 42 entries, was third-most-selected in the naming contest; nevertheless Hunt selected Chiefs as the football team’s new nickname. At other sources (like here) it is said Hunt re-named the team the Chiefs in honor of the large number of Native Americans who (past and present) had called the region of western Missouri and the Great Plains their home. At that is technically true. And that notion is re-enforced by the first primary logo of the new Chiefs franchise {see it by clicking on the on the image above or here}.

But the Chiefs are also named after the nickname of that former Kansas City mayor, H. Roe Bartle who helped get the team to KC and who made good on his promise to Lamar Hunt that Kansas City would have a vast season-ticket paying fan-base there even before the team’s arrival. And this was swiftly accomplished, as in a short span of time (8 weeks) in early 1963, over 20,000 season season tickets were sold to pro-football starved fans in and around Kansas City – before the franchise had even moved out of Dallas, and before the folks who forked over cash for the season tickets even knew exactly which pro team the city was getting. As it said in the timeline/1963 section of the official Kansas City Chiefs website, “the team was officially christened the Chiefs on May 26th, in part to honor the efforts of Bartle.” {excerpt from http://www.kcchiefs.com/history/60s/ [dead link/ now available via Wayback Machine at http://web.archive.org/web/20080609053609/http://www.kcchiefs.com/history/60s/ }.

For more on this, see the following article at SBnation, How the Kansas City Chiefs Got Their Name (article by oldchiefsfan from May 18 2009). In the comments section there, 2 commenters who were proud childhood members of the Boy Scouts' Tribe of Mic-O-Say weigh in: jbj8609 says ..."My father and I are both members of MOS (in St. Joseph, MO, not the KC one), and I can confirm this to be 100% accurate. My dad has been “Tribal Historian” here for several years now and used to tell me this story many times. Always thought it was very cool"; bankmeister says..."I’m also a Mic-O-Say member with five consecutive years at Bartle, plus my mom has lived off of Roe Avenue for 25 years. H. Roe and the Chiefs mean a lot to me." {end of excerpts.} The Kansas City Chiefs is a great name that honors Native Americans. Unlike the racist name of another NFL team.

    Stadiums the Dallas Texans (II)/Kansas City Chiefs franchise have played in...

Cotton Bowl in Dallas, Texas (home of the Dallas Texans (II) from 1960-62)...
The Cotton Bowl began as Fair Park, a stadium built on the site of the Texas State Fair grounds, in 1930. Cut-and-fill construction was employed to build up berms for the stands, and this lowered the playing surface twenty-four feet below the original ground level. The stadium initially held 45,000 spectators; in 1936, the name was officially changed to the Cotton Bowl. The following year, 1937, the Cotton Bowl Classic college football Bowl game began being played there. But it wasn't a popularly-attended Bowl game until a partnership was created with the Southwest Conference starting in 1941 (and the Texas A&M versus Fordham game in '41 was the first Cotton Bowl Classic that was played to a sell-out crowd). By 1950 and through the 1960s, the Cotton Bowl could hold 75,000 (it has a 90,000-capacity now). The primary tenant, in its early days through to the mid-1970s, was the SMU Mustangs college football team; the failed NFL franchise the Dallas Texans (I) of 1952 played 4 of their scheduled 6 games there to sparse crowds, before the NFL front office took over the team and folded it at the end of the 1952 NFL season. In 1960, it would be the home of 3 football teams: the SMU Mustangs, the expansion NFL team the Dallas Cowboys, and the Dallas Texans (II), a charter member of the new rival-league, the AFL.

AFL founder Lamar Hunt, though Arkansas-born, was raised in Dallas, Texas (where his father's oil business was centered). His efforts to get an NFL team for Dallas circa 1958-59 had been unsuccessful. When he got the AFL off the ground and running in 1959-to-early-1960, there was never any doubt that he would have one of the 8 franchises in the new league and that it would be located in Dallas. This despite the fact that in the interim - in early 1960 - the NFL had awarded a Dallas franchise to someone else. So Hunt's Dallas Texans were instantly consigned to being the second-team-in-Dallas, simply by virtue of the fact that the NFL was more established. The red-and-yellow/gold Dallas Texans struggled to get media attention in their 3 seasons in Dallas, but in fact, in the team's first year in Dallas (1960), the AFL's Texans drew best in the debut-season of the AFL and outdrew the NFL's Cowboys (24,500 per game for the AFL Texans versus 21,417 per game for the Cowboys). Of course the first-year Cowboys were horrible (they went 0-11-1), while Hunt's Texans were competitive and fun to watch with a prolific-scoring offense (they went 8-6). But the next season, 1961, Texans' attendance plummeted almost 7K per game to 17,571, while the slightly-improved Cowboys (at 4-9-1) saw their attendance shoot up 33% to 24,521 per game. The writing was on the wall for Hunt. As football-crazy and as dynamic and growing as the city of Dallas was in the early 1960s, it still was not big enough to support two pro football teams. In the next season, 1962, even as an 11-3 team en route to the 1962 AFL title (see illustration below), the Texans were still unable to draw as well as they did their first year - they averaged 22,201 (the 5-8-1 Cowboys averaged only slightly less, at 21,778 in '63).

Hunt knew that once the Dallas Cowboys (inevitably) got competitive, they would totally overshadow the Dallas Texans and start claiming a much greater share of the ticket-paying public in the Dallas/Ft. Worth area. So Hunt threw in the towel and began looking for a new home for his team. New Orleans, Atlanta and Miami and Seattle were also considered, but thanks to that huge season-ticket-drive in KC, Hunt moved his team 450 miles north to Kansas City.

Municipal Stadium (Kansas City), home of the Chiefs from 1963-71...
Opened in 1923 and originally called Muehlebach Field, the venue was built as a ballpark for the Kansas City Blues (V) (1902-54) of the American Association. The Kansas City Monarchs Negro leagues team also played there (from 1923-34; 1937-54). For that reason the ballpark was situated at the edge of Kansas City's inner-city neighborhood. Capacity was originally 17,000, with the main feature of the ballpark being a single, roofed stand that ran the whole of the first-base foul-line to the right-field-foul-pole, but on the other side the roof only stretched to third base (making the roof a rounded L-shape). In 1955, prior to the arrival of the Philadelphia Athletics MLB franchise, the city decided to almost completely demolish the stadium and rebuild from scratch. The city ran three shifts - the new stadium was built in 90 days, in time for the April 1955 MLB opening of the Kansas City Athletics (1955-67). The not-quite-V-shaped-roof remained, now in a double-deck form, and capacity for baseball was then 30,000. It was re-named Municipal Stadium.

When Lamar Hunt decided to move his Dallas Texans to Kansas City in early 1963, the stadium was renovated again, but in more of a jury-rigged way - temporary stands were erected in left field to expand the stadium's capacity each fall, but had to be torn down before the start of the baseball season the following year.

Kansas City mayor H. Roe Bartle had helped get the team to KC, and had made good on his promise to Lamar Hunt that Kansas City would have a vast season-ticket paying fan-base there even before the team's arrival. Some sources say that Bartle promised to triple the crowds the team had drawn in Dallas (ie, 21.4 K times 3 equals 64 K) - but even if he did promise that, it would have been impossible because Municipal Stadium in Kansas City only held around 30,000 then, and even after expansion for football, it never had more than a 49,000-capacity {see this, stadiumsofprofootball.com/past/KCMunicipal}. The 1963 Kansas City Chiefs actually drew about 650 per game worse than they did the year before as the 1962 Dallas Texans (at 21,510 per game in 1963 versus 22,201 in '62) (note: 10-year AFL attendance figures for the Dallas Texans (II)/Kansas City Chiefs can be seen in the illustration above, and the source for those figures was at THE AMERICAN FOOTBALL LEAGUE - ATTENDANCE, 1960-69 By Bob Carroll at profootballresearchers.org.)

The Kansas City Chiefs upon arrival in KC in 1963 were reigning champions of the AFL, but the Chiefs then suffered a downturn in form and went 5-7-2 in '63; 7-7 in '64; and 7-5-2 in '65. Cumulative gate figures for those first 3 years in KC were 20,376 per game. So the fact that the Chiefs turned mediocre right when they arrived in KC certainly hurt attendances, and the crowds the Chiefs drew only got respectable after the Chiefs got good again - in 1966, when they tore up the AFL, going 11-2-1, winning the AFL Championship game (over the Bills, 31–7), and appearing in the first AFL-NFL Championship Game [aka Super Bowl I] (losing to the Packers, 35-10). In that great season of 1966, the Chiefs drew 37,010 (an increase of around 15.5 K over their ’65 attendance). Attendance-wise, the Chiefs have never looked back: they drew 45 K in ’67 (going 9-5); 48 K in ’68 (going 12-2); and 49 K in ’69 when they went all the way with an 11-3 record, beating the Raiders 13-6 in the last AFL Championship game and then winning Super Bowl IV [4] by upsetting the heavily-favored Minnesota Vikings by a score of 23-7 in the last game ever played by the AFL (see illustration above).

Following the Jets’ upset of the NFL’s Colts in Super Bowl III, the Chiefs’ similar upset of the Vikings in Super Bowl IV made it plain for all to see that the AFL was the deserved equal of the NFL. Actually, the AFL beat the NFL soundly in the last two match-ups between the two leagues, so it basically looked like the once-derided upstarts had actually surpassed their hide-bound rivals…in ten years flat. The Chiefs played their first two seasons in the NFL at Municipal Stadium (1970-71), then moved into their purpose-built Arrowhead Stadium in September 1972.

Below: the Truman Sports Complex -the first major league sports stadium complex in the USA which rejected the misguided multi-purpose stadium model.
truman-sports-complex_arrowhead-stadium_with-kaufman-stadium_jackson-county-missouri_b_.gif
Photo and Image credits above -
Chiefs 2012-14 Pro Revolution helmet, illustration by gridiron-uniforms.com/teams/2012_KansasCity.
Kauffman Stadium and Arrowhead Stadium as seen from the nearby interstate highway, photo unattributed/ uploaded by KingmanIII at skyscrapercity.com/ [thread: Closest stadiums]. Arrowhead Stadium aerial photo, by Ichabod at en.wikipedia.org/ [Arrowhead Stadium page].

Arrowhead Stadium – home of the Chiefs since 1972…
To see how the Chiefs’ Arrowhead Stadium came to be, we need to backtrack about 5 years, back to early 1967. Although having just lost in a convincing fashion to the Green Bay Packers in what we now call Super Bowl I, the Chiefs were nevertheless a solid and growing franchise circa early 1967. They had won 2 AFL titles in six seasons, and were now drawing in the 37,000-per-game range. Half a year later in the autumn of 1967, Chiefs were drawing around 45,000 per game [this after their first 3 years in KC when they had lackluster attendance, failing to draw above 22 K per game (1963-65/see attendance figures in illustration above]). All signs pointed to further attendance increases for the Chiefs. They were playing to nearly-full capacity at this point, and the aging Municipal Stadium, located in its inner-city neighborhood, was becoming inadequate for the them and their fans. Locations for a new stadium for the Chiefs and the Athletics were scouted by the city of Kansas City starting in early 1967, but a suitable location was never found, and so just across the county-line in Jackson County, Missouri, at the far eastern edge of Greater Kansas City, a location adjacent to an interstate highway interchange was designated. Hunt had operations-chief Jack Steadman work on the stadium design. Denver architect Charles Deaton was brought in by Steadman and it was Deaton who suggested that the two teams, playing as they were in sports that had such radically different configurations, would be better served if each team had its own stadium. Its own stadium that was configured to its own sport’s configuration (a rectangular-shaped stadium for the football team, and a half-circle-atop-a-triangle-shaped stadium for the baseball team). The 2 venues could share a parking lot complex which would reduce costs by sharing parking and highway expenses. This was the exact opposite of conventional wisdom of the time. The late 1960s was the heyday of the now-derided multi-purpose stadium era (an era that lasted up to the late 1980s), or as I like to call it, the Robert Moses Disease. Circa 1960 to 1988 or so, the urban planners running metropolitan areas ignored the basic fact of the fundamental incompatibility of putting the two very different sports into the same stadium, and forced ugly, astro-turf laden cookie-cutter, multi-purpose concrete stadiums on the public. The whole idea was “we can put our baseball team and our NFL football team in the same stadium, and who cares if the dimensions of the two sports fields are totally incompatible”.

I am not exaggerating in saying that Mr. Deaton’s visionary idea (which is the norm today), has helped to elevate the fan experience in both the NFL and in Major League Baseball. Once there were over a dozen multi-use stadiums in MLB and in the NFL, and they all sucked, because they were designed to host two very incompatible configurations. They were giant soul-less concrete doughnuts that gave the fan – for either sport – vast yawning empty spaces where there should have been seats, and sight-lines looking upon totalitarian-architecture backdrops of brutal concrete. [By 2010, following the Minnesota Twins opening of their Target Field, there was only one multi-purpose stadium still in use in both the NFL and MLB - Oakland's stadium, and its days are numbered.]

Here is an excerpt from the Kauffman Stadium page at en.wikipedia.org,…”In 1967, voters in Jackson County, Missouri approved the bonds for Truman Sports Complex, which featured a football stadium for the Kansas City Chiefs and a baseball stadium for the Kansas City Athletics, whose owner, Charles O. Finley, had just signed a new lease to remain in Kansas City. This was a very unusual proposal; conventional wisdom at the time held that separate football and baseball stadiums were not commercially viable.”…{end of excerpt from en.wikipedia.org/wiki/Kauffman_Stadium#History. The two stadium sports complex, what became known as the Truman Sports Complex, would prove to be twenty years ahead of its time.

But then a wrench was thrown into the works when, in October, 1967, MLB gave A’s owner Charlie Finley permission to move his Kansas City Athletics MLB franchise west to Oakland, CA (in 1968). The folks in and around Kansas City were so enraged about losing their pro ball club they pressured their elected officials to act. Partly thanks to the threat to introduce legislation in the US Senate to remove MLB’s antitrust exemption (put forth by Missouri Senator Stuart Symington), MLB hastily began plans for another round of expansion at the winter meetings in 1967, so both Kansas City and Seattle got MLB AL expansion franchises; and both San Diego and Montreal, Quebec, Canada got MLB NL expansion franchises, all 4 teams set to begin play in 1969.

At about the same time, the Jackson County Sports Complex Authority was created, and construction began in 1968 for the two-stadium Truman Sports Complex (named in honor of western-Missouri-born-and-bred President Harry S. Truman). The second-year Kansas City Royals began playing at the new 37,000-capacity Royals Stadium in April, 1972 (the venue is now called Kauffman Stadium in honor of the Royals’ first owner, Ewing Kauffman). The Chiefs began playing at the new 78,000-capacity Arrowhead Stadium in September, 1972 (after several renovations, Arrowhead, since 2010, now has a capacity of 76,416). The original two-stadium concept, initially designed by Denver architect Charles Deaton and Jack Steadman, was implemented in its final design by the Kansas City architectural firm of Kivett & Myers. The template for what was to be called Arrowhead Stadium is said to have influenced the design of several NFL stadiums. Both stadiums were very well designed and have had very good upkeep – both stadiums are still in excellent shape. And both teams have no plans of moving elsewhere (either out of town or into another costly new stadium), as opposed to the case with EIGHT now-demolished multi-purpose stadiums that were built in the USA in the same era or later. Specifically, in Minneapolis (Metrodome demolished in 2014), in Queens, New York (Shea Stadium demolished in 2007), in St. Louis (Busch Memorial Stadium demolished in 2005), in Philadelphia (Veterans Stadium demolished in 2004), in Cincinnati (Riverfront Stadium demolished in 2002), in Pittsburgh (Three Rivers Stadium demolished in 2001), in Seattle (Kingdome demolished in 2000) and in Atlanta (Atlanta–Fulton County Stadium demolished in 1997) [note: soon Candlestick Park in San Francisco can be added to this list of demolished multi-purpose stadiums, as with the vacating of the 49ers after the 2013 season, the dreary Candlestick Park has no primary tenant].

Below: Lamar Hunt and Bud Adams (photo circa 1960)…
lamar-hunt_bud-adams_afl_1960_b_1.gif
Image credit above -youtube.com/watch?v=W1sL0gf_LXI (youtube.com video uploaded by Scott Sillcox).

    Colors and helmet logos of the Texans/Chiefs

The following link is to a 1 minute and 53 seconds-long video (produced by the NFL and Tide detergent), Kansas City Chiefs uniform and uniform color history (video uploaded by Scott Sillcox at youtube.com)}.

-Illustrated History of Kansas City Chiefs’ uniforms (1960 to 2018)…from Gridiron Uniforms Database (gridiron-uniforms.com).

1960-62 – Red and Yellow/Gold (map-of-Texas-with-gold-star-for-Dallas helmet-logo, on a plain red helmet)…
Lamar Hunt actually wanted the Dallas Texans to wear orange-and-sky-blue, but Bud Adams’ Houston Oilers had already chosen powder blue as their primary color, so Hunt had to come up with a different color scheme (thank goodness for that). Hunt chose a simple yet striking red-with-yellow/gold…the franchise has never worn any other colors. The Texans/Chiefs have also only worn a red helmet with no stripe detail (a wise decision because the inherent high-potency of the color red ends up being diluted by the often-at-cross-purposes imposition of a center stripe…especially when that red is paired with a shape in the logo that is slightly more complex than a block letter or a circle). First (1960-62), the red helmet had a logo that was the-state-of-Texas-with-gold-star-for-Dallas {see that nice design here in a game-worn helmet from the 1960-62 era}.

1963-2019 – Red and Yellow/Gold (arrowhead-with-interlocking-K-C helmet-logo, on a plain red helmet)…
When Hunt moved the team to Kansas City, the story goes he himself drew out the new logo in his kitchen on a dinner napkin…sketching out a design influenced by the San Francisco 49ers’ interlocking-S-F, but with an arrowhead framing the letters K-C instead of the football-shaped-oval on the Niners’ helmet. That design debuted in 1963 and, aside from a slight reshaping of the logo in 1974 (the arrowhead was made a bit smaller and the K-C a bit larger), it has remained the Chiefs helmet design for over 50 years. And rightly so. The Chiefs’ bold yet dignified helmet looks as sharp today as it did a half century ago; the same can be said for their uniforms.


Credits
Dallas Texans on map page,
Video of 1962 AFL Championship Game [Len Dawson about to pass to Abner Haynes], screenshot of video uploaded by NFL at youtube.com. Dallas Texans game-worn helmet, photo from milehighcardco.com/1960-62-dallas-texans-afl-game-used-helmet. Jerry Mays [1962 Fleer card], from ebay.com. Mel Branch [photo circa 1962], unattributed at goldenrankings.com/AFLchampionship1962. EJ Holub [photo from 1962 title game], unattributed at goldenrankings.com/AFLchampionship1962. Sherrill Headrick [photo from 1961], unattributed at helmethut.com/Features/Dr.Ken148. Len Dawson [1962 title game] screenshot from video uploaded by Rusty Brewer at youtube.com. [photo from 1962], unattributed at pinterest.co.uk. Chris Burford [1964 Topps card], from peacework.us/su/delt60/Burford_Chris. Abner Haynes [photo from 1962], AP via si.com/nfl. Jim Tyrer [1964 Topps card], from bleacherreport.com.

Offensive stats leaders on map page,
Len Dawson [1963 Fleer card], from myalltimefavorites.com. Frank Tripucka [1963 Fleer card], from comc.com. Cookie Gilchrist [photo from 1963], from buffalobills.com via wkbw.com. Abner Haynes [1962 Fleer card], from ebay.com. Art Powell [1962 Fleer card] from ebay.com.

Thanks to,
-Blank map by anonymous US federal government employee, at File:StatesU.svg (commons.wikimedia.org).
-Thanks to Sportslogos.net for 1960-era AFL team logos.
-Thanks to Buffalo Bills official site for original Bills logo (1960-61).
-Thanks to Infinite Jets blog for hard-to-find full-color NY Titans logo.
Thanks to the Coffin Corner newsletter, for this pdf, [AFL attendance by team 1960-69] (profootballresearchers.org).
-Thanks to the contributors at pro-football-reference.com.
-Thanks to the contributors at AFL 1962 season (en.wikipedia.org).
Special thanks to Tim Brulia, Bill Schaefer and Rob Holecko of The Gridiron Uniform Database, for giving billsportsmaps.com the permission to use football uniforms illustrations from Gridiron Uniform Database {GUD}.

October 14, 2019

1927 Major League Baseball: map with crests & uniforms, final standings and stats leaders; champions: New York Yankees./+ Illustrated article, 1927 MLB champions: the New York Yankees, perhaps the greatest team in MLB history.

Filed under: Baseball,Baseball-1927 MLB season,Retro maps — admin @ 7:31 am

mlb_al_nl_1927-map_w-uniforms_logos_standings_stats-leaders_1927-ws-champs_new-york-yankees_post_d_.gif
1927 Major League Baseball: map with crests & uniforms, final standings and stats leaders; champions: New York Yankees


By Bill Turianski on 14 October 2019; twitter.com/billsportsmaps.

Links…
Sources:
-Baseball-Reference.com, 1927 AL season; 1927 NL season.
-Baseball Hall of Fame’s Dressed to the Nines (uniforms illustrated by Marc Okkonen), exhibits.baseballhalloffame.org/dressed_to_the_nines/database.htm.
-US cities’ populations (1920 figures), biggestuscities.com/1920.
-Attendances. Source: baseball-reference.com/leagues/MLB/1927-misc.shtml.
Most logos. Source: SportsLogos.net, sportslogos.net/[MLB logos].

From 1903 to 1952 (50 seasons), there were no franchise-shifts in Major League Baseball. The 16 MLB teams from this 50-year period played in only 9 American cities…New York City (3 teams), Chicago (2 teams), Philadelphia (2 teams), Detroit, Cleveland, St. Louis (2 teams), Boston (2 teams), Pittsburgh, Washington, and Cincinnati.

Below: a chart of 1920s USA city populations, with 1927 MLB teams noted…
1927_mlb_cities_populations_b_.gif.

    1927 MLB champions: the New York Yankees, perhaps the greatest team in MLB history

Many observers consider the 1927 New York Yankees to be the greatest team ever. The ’27 Yankees featured seven future Hall of Famers: pitchers Herb Pennock and Waite Hoyt, infielders Lou Gehrig (1B) and Tony Lazzeri (2B), outfielders Babe Ruth and Earle Combs, and manager Miller Huggins. After losing to the St. Louis Cardinals 4 games to 3 in the 1926 World Series, the 1927 Yankees went 110-44 (.714). Only 4 other teams have won more games than that…the 1906 Chicago Cubs and the 2001 Seattle Mariners won 116, the 1998 Yankees won 114 and the 1954 Cleveland Indians won 111. But the 1906 Cubs and the 1954 Indians and the 2001 Mariners did not win the World Series in those years. Also, the 1998 Yankees, though they did win the World Series that year, played in the era of the modern-day 162-game season [154-game season until 1960/162-game season in American League since 1961; 162-game season in National League since 1962].

The 1927 Yankees won the American League by 19 games, the most to that point in AL history. (Note: the Chicago Cubs won the National League in 1906 by 20 games.)

Let’s look at the numbers. The 1927 Yankees had a .307 BAvg, a .489 slugging percentage, and scored 975 runs, outscoring their opponents by a record 376 runs. That .489 Slugging Pct. the ’27 Yankees had – as a team – was surpassed by only 5 other individual players on all the other teams in the AL that season. Babe Ruth’s record-setting 60 homers, when added to Lou Gehrig’s 47 HR, accounted for over 25% of all HRs in the AL that season! Gehrig had a then-record 173 RBIs, while Ruth had 165 RBIs. Gehrig hit .373, Ruth hit .356. Plus Ruth drew 137 Walks, while Gehrig drew 109. Tony Lazzeri had 18 HR & 102 RBIs & and hit .309. Lead-off hitter Earle Combs hit .352. Standout pitchers were Waite Hoyt (22-7, 2.63 ERA), Herb Pennock (19-8, 3.00 ERA), and Wilcy Moore (19-7, 2.28 ERA, 19 Saves). But the thing is, once you get past the sublime accomplishments of Ruth and Gehrig that year, as well as the excellent seasons of Lazzeri, Combs, Hoyt, Pennock, and Moore, there were a lot a mediocre players on the 1927 Yankees. As Robert Creamer of Sports Illustrated pointed out, “it may cause raised eyebrows to realize that such journeymen as Gazella, Wera, Durst, Thomas, Paschal, Giard, Grabowski, Morehart and Collins made up almost 40% of that great team’s roster.” {-excerpt from the August 26, 1958 issue of Sports Illustrated, here.}

The 1927 Yankees swept the Pittsburgh Pirates in 4 games to win the ’27 World Series. It was the 24th World Series, and it was first time that an American League team swept a National League team in the competition. (Note: NL Teams had swept their AL opponents 3 times previously: the Chicago Cubs swept the Detroit Tigers in the 1907 WS; the Boston Braves swept the Philadelphia Athletics in the 1914 WS; and the New York Giants swept the Yankees in the 1923 WS.)

And then, the 1928 Yankees would go on to sweep the St. Louis Cardinals in the 1928 World Series. That was the first time a team had ever swept back-to-back World Series contests. No other MLB team has accomplished that feat of back-to-back World Series sweeps…but the New York Yankees went on to do it two more times…in 1938 & ’39, and in 1998 & ’99.

And those two Yankee teams, along with, of course, the 1927-28 Yankees, show up on many, if not all, lists of greatest-ever MLB teams…such as:
{Bleacher Report’s Official Rankings of the 50 Greatest Teams in MLB History, by Joel Reuter at BleacherReport.com, from March 2014},
{Tom Verducci’s Top 10 Teams of All Time, by Tom Verducci at si.com},
{Determining the Best Major League Baseball Team Ever From 1902-2005, from Baseball-Almanac.com},
{The Best MLB Teams Of All-Time, According To Elo, by Reuben Fischer-Baum at FiveThirtyEight.com, from May 2016}…
(For the record, the first 3 of the 4 lists above rank the 1927 Yankees as the best MLB team ever; the list at the 538.com ranks the 1927 Yankees the second-best ever, giving the nod to the Joe DiMaggio-led Yankees of 1939.)

Below: the 1927 New York Yankees & Babe Ruth’s record-setting 60 Home Run season…
1927_ny-yankees_ruth_gehrig_combs_lazzeri_ruth-hits-60-hr_yankees-sweep-pirates-in-1927-world-series_f_.gif
Photo and Image credits above – 1927 NY Yankees road jersey script logo, from mitchellandness.com. “Murderers Row”, featuring Gehrig, Ruth, Combes, Lazzeri [colorized photo from 1929], photo unattributed at flickr.com/[Willie Brown]. Babe Ruth, photo unattributed at sabr.org. Ruth crosses the plate and is congratulated by teammate Bob Meusel, after hitting the historic 60th Home Run, photo by NY Daily News at nydailynews.com. New York Daily News front page from Oct. 1 1927 [Babe Ruth hits historic 60th HR), via Baseball by B Smile [twitter.com/@bsmile]. Game 4 of the 1927 World Series, Oct. 6 1927 – NY 4, Pittsburgh 3: photo from the stands at Yankee Stadium…action from the 1st-inning, as Babe Ruth (who later hit a HR in the 5th) has just singled; Earle Combs rounds 3rd to tie the game up 1-1. The Yankees swept the Pirates in 4 games, for their second WS title. This was the first sweep of a National League team by an American League team…photo unattributed at Old Time Baseball Photos twitter.com/[@OTBaseballPhoto].

1927 MLB stats leaders…
ERA, Wilcy Moore (NYY). Wins, Charlie Root (CHC). WAR for pitchers, Tommy Thomas (CHW). BAvg, Harry Heilmann (DET). HR, Babe Ruth (NYY). RBI, Lou Gehrig (NYY). OPS, Babe Ruth (NYY). WAR, Babe Ruth (1927).


Photo and Image credits on the map page…
1927 WS champions New York Yankees…
1927 NY Yankees road jersey script logo, from mitchellandness.com. Babe Ruth [photo from 1927], photo from Getty Images via biography.com. Lou Gehrig [photo circa 1927], unattributed at fineartamerica.com. Earle Combs [photo circa 1926], unattributed at ebay.com. Tony Lazzeri [photo circa 1927], from Baseball Hall of Fame via si.com/all-time-yankees-lineup. Waite Hoyt [photo circa 1927], photo from National Baseball Hall of Fame Library via Getty Images via gettyimages.com. Wilcy Moore [colorized photo circa 1929], colorized photo unattributed at pinterest.com. Bob Meusel [photo circa 1927], unattributed at espn.com. Manager, Miller Huggins [photo circa 1924], unattributed at pinterest.com.
1927 WS G4 ticket, from pixels.com.
1927 WS press pin, from may16.hugginsandscott.com.
“Murderers Row”, featuring Gehrig, Ruth, Combes, Lazzeri [colorized photo from 1929], photo unattributed at flickr.com/[Willie Brown].
1927 MLB stats leaders…
Wilcy Moore (NYY) [photo circa 1928], unattributed at pinterest.com. Charlie Root (CHC) [photo circa 1927], unattributed at sabr.org. Harry Heilmann (DET) [photo from 1927], unattributed at quora.com. Tommy Thomas (CHW) [photo circa 1927], photo by Sporting News and Rogers Photo Archive via Getty Images via gettyimages.co.uk. Babe Ruth (NYY) [photo circa 1927], McMahon Archive at amazon.com. Lou Gehrig (NYY) [photo circa 1928], unattributed at mondoudinese.it. Babe Ruth (NYY) [photo circa 1927], from Bettman-Corbis/Getty Images via si.com.

Colorized photo of Philadelphia Athletics 1925-27 elephant-logo jersey, photo unattributed and colorized by Natalia Valiukevich/mediadrumworld.com via dailymail.co.uk/article.

___
Thanks to all at the following links…
Sources:
-Baseball-Reference.com, 1927 AL season; 1927 NL season.
-Baseball Hall of Fame’s Dressed to the Nines (uniforms illustrated by Marc Okkonen), exhibits.baseballhalloffame.org/dressed_to_the_nines/database.htm.
-US cities’ populations (1920 figures), biggestuscities.com/1920.
-Attendances. Source: baseball-reference.com/leagues/MLB/1927-misc.shtml.
Most logos. Source: SportsLogos.net, sportslogos.net/[MLB logos].

May 29, 2019

1926 Major League Baseball: map with crests & uniforms, final standings and stats leaders; champions: St. Louis Cardinals.

Filed under: Baseball,Baseball-1926 MLB season,Retro maps — admin @ 8:27 pm

mlb_al_nl_1926-map_w-uniforms_logos_standings_stats-leaders_1926-ws-champs_st-louis-cardinals_post_f_.gif
1926 Major League Baseball: map with crests & uniforms, final standings and stats leaders; champions: St. Louis Cardinals


By Bill Turianski on 29 May 2019; twitter.com/billsportsmaps.

Sources:
-Baseball-Reference.com, 1926 AL season; 1926 NL season.
-SportsLogos.net.
-Baseball Hall of Fame’s Dressed to the Nines (uniforms illustrated by Marc Okkonen), exhibits.baseballhalloffame.org/[Dressed to The Nines database].
-US cities’ populations (1920 figures), biggestuscities.com/1920.
-Attendances. Source: baseball-reference.com/leagues/MLB/1926-misc.shtml.

Links…
-An article on the St. Louis Cardinals circa 1926 to 1934…1926-34: The St. Louis Cardinals Were as Dominant as the Great Yankees Teams (by Harold Friend at bleacherreport.com).
-An article on Rogers Hornsby, who has the 2nd-best all-time Batting Average in MLB history (at .358, which is second only to Ty Cobb’s .367 BAvg)…Rogers Hornsby (by C. Paul Rogers III at sabr.org). {Excerpts: ‘Any conversation about the greatest hitter in baseball history must include Rogers Hornsby…’ …‘Although the assessment seems rather harsh given the competition, Bill James has characterized Hornsby as perhaps the biggest “horse’s ass” in baseball history, ahead of even Ty Cobb’.}
-An article on Grover Cleveland Alexander…Alexander provides ultimate relief for Cardinals in 1926 World Series (by Craig Muder at baseballhall.org).

-Here is a link to my map-and-post of 1925 MLB: 1925 Major League Baseball: Map with logos & uniforms. Including final standings, top players, and attendance + 1925 World Series winners: Pittsburgh Pirates. That post (from April 2019) also contains descriptions of the map template used there (and here), as well as a city-by-city look at Major League attendance from the 1920s.

From 1903 to 1952 (50 seasons), there were no franchise-shifts in Major League Baseball. The 16 MLB teams from this 50-year period played in only 9 American cities…New York City (3 teams), Chicago (2 teams), Philadelphia (2 teams), Detroit, Cleveland, St. Louis (2 teams), Boston (2 teams), Pittsburgh, Washington, and Cincinnati.

Below: a chart of 1920s USA city populations, with 1926 MLB teams noted…
1926_mlb_cities_populations_top-25-USA-city-populations-1920_h_.gif

In 1926, led by player/manager Rogers Hornsby, the St. Louis Cardinals defeated the New York Yankees in 7 games, to win their first World Series title. The Cardinals have won the second-most World Series titles, 11 (their last being in 2011). Those eleven World Series titles won by St. Louis are second only to the 27 titles won by the New York Yankees.

1926 MLB stats leaders…
ERA: Lefty Grove (Philadelphia Athletics).
Wins: George Uhle (Cleveland Indians).
BAvg: Heinie Manush (Detroit Tigers).
HR: Babe Ruth (New York Yankees).
RBI: Babe Ruth (New York Yankees).
OPS: Babe Ruth (New York Yankees).
WAR: Babe Ruth.(New York Yankees)
WAR for pitchers: George Uhle (Cleveland Indians).
___
Photo and Image credits on the map page…
1926 WS champions St Louis Cardinals (banner)…
Shoulder-patch crest, from hofmwholesale.com. 1926 STL cap, from dugout-memories.com. 1926 STL WS ring, from pinterest.com. 1926 WS [Sportsman's Park] program, from baseball-almanac.com/ws/yr1926.
Rogers Hornsby [photo circa 1926], unattributed at rogershornsby.com. Rogers Hornsby [1961 Golden Press card] from amazon.com. Les Bell [photo from 1926], gettyimages.com. Bob O’Farrell [photo circa 1926], unattributed at sabr.org. Ray Blades [photo circa 1930], photo by Sporting News and Rogers Photo Archive via gettyimages.com. Jim Bottomley [photo circa 1925], unattributed at baseballhall.org/hall-of-famers/bottomley-jim. Bill Sherdel [photo from 1929], photo by Sporting News and Rogers Photo Archive via gettyimages.com.

1926 MLB stats leaders…
Lefty Grove (PHA) [photo from 1925], photo by Charles M Conlon via sports.mearsonlineauctions.com. George Uhle (CLE) [photo from 1926], photo by George Rinhart/Corbis via gettyimages.ca. George Uhle (CLE) [photo from 1927], photo by Sporting News and Rogers Photo Archive via gettyimages.co.uk. Heinie Manush (DET) [photo circa 1924], unattributed at findagrave.com. Babe Ruth (NYY) [photo circa 1925], unattributed at pinterest.com. Babe Ruth (NYY) [colorized photo circa 1926], unattributed/colorized by Jecinici via reddit.com/r/yankees.

-Colorized photo of Philadelphia Athletics 1925-27 elephant-logo jersey, photo unattributed and colorized by Natalia Valiukevich/mediadrumworld.com via dailymail.co.uk/article.

Thanks to all at the links below,
-University of Texas at Austin online archive (Perry-Castañeda Library Map Collection), legacy.lib.utexas.edu/maps/united_states.html.
-Baseball-Reference.com, 1925 AL season; 1925 NL season.
-Major League Baseball (en.wikipedia.org).
-SportsLogos.net.
-Baseball Hall of Fame’s Dressed to the Nines (uniforms illustrated by Marc Okkonen), exhibits.baseballhalloffame.org/dressed_to_the_nines/database.htm.
-MLB.cm/shop.
-US cities’ populations (1920 figures), biggestuscities.com/1920.

April 12, 2019

1925 Major League Baseball: Map with logos & uniforms. Including final standings, top players, and attendance + 1925 World Series winners: Pittsburgh Pirates.

Filed under: Baseball,Baseball-1925 MLB season,Retro maps — admin @ 1:13 pm

mlb_al_nl_1925-map_w-uniforms_logos_standings_stats-leaders_1925-ws-champs_pittsburgh-pirates_post_u_.gif
1925 Major League Baseball: map with crests & uniforms, final standings and stats leaders; champions: Pittsburgh Pirates


By Bill Turianski on 12 April 2019; twitter.com/billsportsmaps.

Sources
-Baseball-Reference.com, 1925 AL season; 1925 NL season.
-Major League Baseball (en.wikipedia.org).
-SportsLogos.net.
-Baseball Hall of Fame’s Dressed to the Nines (uniforms illustrated by Marc Okkonen), exhibits.baseballhalloffame.org/dressed_to_the_nines/database.htm.
-MLB.cm/shop.
-US cities’ populations (1920 figures), biggestuscities.com/1920.

This is a new template and category: MLB retro maps. I plan on posting maps of MLB, from 1925, on into the 1930s.

Aspects of the map-and-chart:
A). 1925 location-map of the 16 MLB teams. Home cities listed, then franchises listed in smaller text below the home-city name. Each team (franchise) has at least one logo from that year (in this case, 1925); the logos are sized to reflect average attendance from that season: the higher-drawing teams have larger logos-and-or-multiple-logos. In this case, that applies to the top-drawing teams in the NL in 1925 (the Pirates, the NY Giants, the Brooklyn Robins [aka Dodgers], and the Cubs), and it applies to the top-drawing teams in the AL in 1925 (the Philadelphia Athletics, the White Sox, the Senators, the Tigers, and the Yankees). Similarly, the lower-drawing teams in MLB that season have much smaller logos on the map (in this case, such as the Red Sox and the Phillies).

B). Population of US cities (1920 figures). A small chart showing the 25-then-largest cities of the USA in 1920 is shown at the upper-left-hand side of the map. MLB representation-by-city is noted there. Populations of MLB cities in the 1920s, and drawing-power of the 16 MLB teams from this era, is discussed below.

C). Attendance {data from baseball-reference.com}.  1925 average attendances are shown at the upper-right of the map. They are also shown below. Further below is an article about MLB attendance team-by-team, circa the 1920s.

D). World Series champions (for 1925, the Pittsburgh Pirates). World Series champions are represented by a prominent section at the top of the map. Shown are uniforms and logos, and World Series winners’ rings (or jeweled stick-pin, in this case). Also shown is photo of a ticket from one of the WS games that year (or maybe a souvenir program from the WS that year, or a Press pin). A photo of the manager of the WS winner is shown, along with 5 or 6 or 7 photos of the top players on the WS-winning team that year. (Top players are determined by WAR [Wins After Replacement].) Players who have been elected to the Baseball Hall of Fame [HoF] are noted, by a bronze-colored square with year of HoF election listed.

E). Top players in MLB for that season are shown at the foot of the map. Photos of stats leaders in several categories are shown…for Pitchers: ERA, Wins, and WAR (Pitchers); for Position-Players: Batting Average (BAvg), HR, RBI, OPS, and WAR. Again, HoF players are noted.

F). MLB team sections: flanking sections, in alphabetized chart-form, show the 8 NL franchises (of 1925) on the far-left of the map, and the 8 AL franchises (of 1925) on the far-right of the map.

(Note: all 16 of the MLB franchises from this era still exist, although, of course, some franchises [9 franchises] have moved to different cities.) In each franchise’s rectangular box is shown their uniforms from that season, and at least one of their primary logos from that season, along with a narrow bar that is in the team’s colors that season. A photo of the present-day-franchise’s home ball cap is shown [2019 caps]. And franchise info is shown for each team, including: years of existence [seasons in NL or AL], location(s), league-titles [Pennants] and MLB titles [WS titles], plus any franchise movements. Standard abbreviations for each team are used. As far as former teams go, to avoid any confusion, I used baseball-reference.com’s abbreviations. {Here: baseball-reference.com/about/[team_IDs](aka abbreviations).}

G). NL and AL final standings and the World Series result, for that year, are shown in the lower-right-hand side of the map, in a rectangle which is the approximate color of a faded old newspaper. I used a Times Roman font in this section to further evoke the newsprint style of that era.

I tried to make the map look like it was printed in a newspaper from ninety years ago, but then inlaid with full-color logos.

I will post my 1926 MLB map (featuring 1926 WS champions the St. Louis Cardinals), in late May 2019.

    A look at MLB attendance, circa the mid-1920s, by city

(There were 10 cities with MLB teams back then)…

1925 MLB Average Attendance
PHA 11.2 K
CHW 10.8 K
WSH 10.7 K
DET 10.6 K
PIT 10.4 K
NYG 10.2 K
NYY 8.8 K
BRO 8.5 K
CHC 8.0 K
CIN 6.1 K
SLB 5.9 K
CLE 5.4 K
STL 5.3 K
BSN 4.1 K
PHI 3.9 K
BOS 3.5 K
Source:
baseball-reference.com/[1925/MLB/attendance+misc.].

Overall, MLB attendances from the 1920s are rather low by modern standards. But this was in an era before night games, and A-shift workers were at work when most MLB games were played back then (in other words, the working-class baseball fan in the 1920s would usually only be able to get to the ballpark on weekends). Circa 1925, a high-drawing MLB team would be defined as one who drew as little as 10-to-13 K. When the Yankees started dominating in the 1927-28 time period, they were still playing to a whole lot of empty seats at Yankee Stadium, drawing only 15.1 K per game in 1927, and 13.9 K in ’28. It wasn’t until after World War II that MLB teams began drawing in the 15-to-25-K range, and even into the 1950s, the attendances seem pretty low compared to modern figures. For example, 30 years after 1925, in 1955, the top-drawing MLB team was the Milwaukee Braves at 23.1 K per game, while the New York Yankees, then at the peak of their domination of Major League Baseball, were drawing 2nd-best at just 19.3 K.

Generally speaking, the three biggest influences on crowd-size were (and still are): the size of the city itself, the success of the ball club at that point in time, and the quality of the venue.

New York, NY (this city had 3 MLB teams in 1925): The 3 New York City-based teams generally had higher attendances than, say, teams from much smaller cities, like Cincinnati: that’s just logical [NYC had about a 5.6 million population in 1920].

Brooklyn Dodgers: In 1925, the Brooklyn National League ball club was then known as the Robins, although many Brooklynites did also call them the Dodgers. Brooklyn was pretty bad for long periods of time in both the 1920s and the ’30s, and in 1925 they finished in second-to-last (7th place), but Brooklyn still drew a decent 8.1 K per game at Ebbets Field.

New York Giants: The New York baseball Giants, at the Polo Grounds in northern Manhattan, were good enough for 2nd place in the NL in 1925, and the Giants drew a solid 10.2 K per game. The Giants were a dominant team of the early 1920s, coming off of 4 straight NL Pennants and 2 WS titles (in 1921 & ’22).

New York Yankees: A mile east of the NY Giants, across the narrow Harlem River, in the Bronx, were the then-upstart New York Yankees, at their new palace of baseball, Yankee Stadium. The Yankees had been renters of the Giants at the nearby Polo Grounds from 1913 to 1922, but the Giants kicked the Yankees out when they started stealing their media-attention and drawing better than them. (The original Yankee Stadium had opened in April 1923.) The Yankees had won their first AL pennants in 1921 and ’22, and were first-time World Series champions in 1923. The Yankees drew 13-to-15-K per game through these 3 years (1921-23). The Yankees had an off-season in 1925, and finished in 7th in the AL, and their gates reflected that, with an average crowd of 8.8 K (down about 7 K per game, from four years earlier).

Chicago, IL (this city had 2 MLB teams in 1925): America’s second-city back then was Chicago, IL [Chicago had a population of 2.7 million in 1920]. Chicago’s 2 MLB teams – the White Sox and the Cubs – drew well, especially when they fielded competitive teams, but even when losers, both still drew better than most (similar to the 3 NYC teams). Both teams had been successful earlier on, but by the mid-1920s had fallen into mediocrity.

White Sox: At the old Comiskey Park on the South Side of Chicago, the AL’s White Sox drew 10.1 K per game as a 5th place team in 1925.

Cubs: The Chicago Cubs finished in last in the National League in 1925, yet still drew 8.0 K per game at Cubs Park [which was re-named Wrigley Field in 1926].

Philadelphia, PA (this city had 2 MLB teams in 1925): Third-largest city in America in 1920 was Philadelphia, PA [1.8 million population back then]. And there, it was a case of one Philly ball club with very strong drawing power (the Philadelphia Athletics), and one Philly ball club which was a perennially poor-drawing basement-dweller (the Philadelphia Phillies).

Philadelphia Athletics: The Athletics were successful (6 AL pennants and 3 WS titles up to that point), and they had an excellent venue back then (Shibe Park). In 1925, as a 2nd-place team, the Athletics drew best in MLB, at 11.2 K per game.

Philadelphia Phillies: The Philadelphia Phillies played at the bandbox that was the Baker Bowl; in 1925 they drew 2nd-lowest in 1925, at 3.9 K per game, and finished in 6th.

St. Louis, MO and Boston, MA (both these cities had 2 MLB teams each in 1925): Of the 5 cities with multiple MLB teams in this era (New York City, Chicago, Philadelphia, St. Louis, Boston), the two smallest of those cities, St. Louis and Boston, had teams that very often struggled at the gate, especially when they were lousy. (Both St. Louis and Boston only had about .75 million people back in 1920.)

Boston, MA: The Boston Red Sox were bad in the 1920s, and averaged sparse crowds at Fenway Park, in the abysmal 3-to-4 K-per-game range; ditto the Boston Braves, at Braves Field.

St. Louis, MO: St. Louis had a big-team/small-team-dynamic like the one in Philadelphia: one very-often-competitive team (the St. Louis Cardinals) that drew generally much better than the local basement-dwellers (the St. Louis Browns). Ironically, the better-drawing and more successful team in St. Louis – the Cardinals – were renters to the sad sack Browns, at the old Sportsman’s Park there.

Detroit, MI and Cleveland, OH: In the 1920s, there were two cities that only had one Major League team (an American League team), yet were slightly larger than the two-team cities of St. Louis and Boston. Those two cities were Detroit, MI [the 4th-largest city in the USA in 1920 with a .99 million pop], and Cleveland, OH [at .79 million, the 5th-largest in 1920].

Detroit Tigers: At Navin Field [Tiger Stadium], Detroit could draw strong crowds: they drew 10.6 K per game as a mediocre .513 Pct/4th place team in 1925. The Tigers remained a top-5-drawing team through most of the 1920s.

Cleveland Indians: Cleveland had less drawing power; they drew 5.4 K in 1925 at League Park, as a 6th place team. The following season of 1926 saw the Indians in a pennant-race, yet they drew an underwhelming 7.8 K.

(Note: the 8th-largest city circa the 1920s was Baltimore, MD [.73 million], but Baltimore, which had a very successful NL franchise in the late 1800s [Baltimore Orioles (I) (1882-99)], was shut out of the Majors from 1903 to 1953. Baltimore had had an AL team in the American League’s first two seasons [Baltimore Orioles (II) (1901-02)], but that franchise moved to New York in 1903, to become the NY Highlanders [then changed their name to the NY Yankees in 1913].) Baltimore would have to be content with a minor league ball club for five decades, before the city lured the struggling St. Louis Browns AL franchise to move to Baltimore and become the Baltimore Orioles (III) in 1954.)

Pittsburgh Pirates: Ninth-largest city in America in the 1920s was Pittsburgh, PA [.58 million]. The Pirates played at Forbes Field from 1909 to 1970. Pittsburgh drew well when they were winning (like in the 1925-29 time period). And the Pirates had the highest NL attendance, and the 5th-highest attendance in all of MLB in 1925, at 10.4 K per game. Under manager Bill McKechnie, the 1925 Pirates were the Major League champions, defeating the reigning champs, the Washington Senators, 4 games to 3, in the 1925 World Series.

Washington, DC and Cincinnati, OH: That covers 14 of the 16 MLB teams circa 1925. The other two MLB teams back then came from considerably smaller cities: Washington, DC [14th-largest US city in 1920 at .43 million], and Cincinnati, OH [16th-largest US city in 1920 at .40 million]. Back then, Washington, DC and Cincinnati, OH, both with populations of around 400,000, were almost half the size of cities like St. Louis or Boston. So it’s not surprising that both MLB teams from these two smaller cities generally drew low crowds.

Washington Senators: But in 1925, the Washington Senators were reigning World Series champs (the Senators won their only WS title in 1924). And in 1925, the Washington Senators were en route to a second-straight AL pennant title, and consequently had some of the largest crowds that year (the Senators drew 3rd-best in all of MLB in 1925, at 10.7 K per game at Griffith Stadium). But to give you an idea of how unusual that was for the often hapless Senators, that 10.7 K per game that Washington drew in 1925 would not be surpassed by the team until 21 years later, in 1946.

Cincinnati Reds: As for Cincinnati, they could maintain somewhat decent crowds when marginally competitive. In 1925, the Reds finished in 3rd in the NL, 7 games above .500, and drew 6.1 K. Which is not bad at all for the team from the smallest MLB city of the 1920s. The Reds played at Crosley Field (1912-1970).

1925 MLB stats Leaders.
ERA: Dolph Luque, Cincinnati Reds.
Wins: Dazzy Vance, Brooklyn Robins.
Batting Avg: Rogers Hornsby, St. Louis Cardinals.
HR: Rogers Hornsby, St. Louis Cardinals.
RBI: Rogers Hornsby, St. Louis Cardinals.
On Base+Slugging Pct (OPS): Rogers Hornsby, St. Louis Cardinals.
Wins Above Replacement (WAR):
(Position Players): Rogers Hornsby, St. Louis Cardinals.
(WAR for Pitchers): Herb Pennock, New York Yankees.

___
Photo and Image credits on the map page…
Base map: Outline map of USA from University of Texas at Austin online archive (Perry-Castañeda Library Map Collection), legacy.lib.utexas.edu/maps/united_states.html; legacy.lib.utexas.edu/maps/united_states/usa_blank2.jpg.

Banner: 1925 WS champs, Pittsburgh Pirates…
1925 WS ticket, from hugginsandscott.com. Ticket-stub segment, from sports.ha.com/1925-world-series-game-seven-full-tickets-sheet.1925 Pirates uniforms, illustrations by Marc Okkonen at exhibits.baseballhalloffame.org/dressed_to_the_nines/[1925-PIT]. 1925 Pirates jersey [original], from sports.mearsonlineauctions.com. 1925 Pirates jeweled pin (1925 WS champions pin), from tjscollectiblesinc.com. Bill McKechnie [photo from 1925 WS], unattributed at wilkinsburghistory.wordpress.com. Kiki Cuyler [photo from 1925], unattributed at sabr.org. Max Carey [photo circa 1922], unattributed at sportsecyclopedia.com. Glenn Wright [colorized photo from 1925], photo unattributed/colorized by Baseball In Color at twitter.com/@BaseballInColor; unattributed at pinterest.com. Vic Aldridge [photo from 1925], unattributed at amazon.com. Pie Traynor [colorized photo from 1925], photo unattributed/colorized by Baseball In Color at twitter.com/@BaseballInColor. Lee Meadows [photo from 1927], from Detroit Public Library digitalcollections.detroitpubliclibrary.org.

1925 MLB Stats leaders…
Dolph Luque [photo circa 1923], photo from twitter.com/[@Reds]. Dazzy Vance [photo from 1925], photo unattributed at ebay.com. Rogers Hornsby [photo from 1925], photo by Sporting News and Rogers Photo Archive via Getty Images at gettyimages.com. Rogers Hornsby [US Postal Service stamp from 2000], from mysticstamp.com. Herb Pennock [photo circa 1926], photo unattributed at 1927-the-diary-of-myles-thomas.espn.com/herb-pennock.

Colorized photo of Philadelphia Athletics 1925-27 elephant-logo jersey, photo unattributed and colorized by Natalia Valiukevich/mediadrumworld.com via dailymail.co.uk/article.

Thanks to all at the links below,
-University of Texas at Austin online archive (Perry-Castañeda Library Map Collection), legacy.lib.utexas.edu/maps/united_states.html.
-Baseball-Reference.com, 1925 AL season; 1925 NL season.
-Major League Baseball (en.wikipedia.org).
-SportsLogos.net.
-Baseball Hall of Fame’s Dressed to the Nines (uniforms illustrated by Marc Okkonen), exhibits.baseballhalloffame.org/dressed_to_the_nines/database.htm.
-MLB.cm/shop.
-US cities’ populations (1920 figures), biggestuscities.com/1920.

December 6, 2018

American Football League: 1961 AFL season, map with helmets/jerseys & final standings + offensive stats leaders; champions: Houston Oilers.

Filed under: AFL (gridiron football),AFL, 1961 map/season,Retro maps — admin @ 9:32 am

afl_1961_2nd-season_map_w-final-standings_o-stats-leaders_champions-houston-oilers_post_h_.gif
American Football League: 1961 AFL season, map with helmets/jerseys & final standings + offensive stats leaders; champions: Houston Oilers


By Bill Turianski on 6 December 2018; twitter.com/billsportsmaps.
Links…
-1961 AFL season
-1961 AFL Championship Game (en.wikipedia.org).
-1961 AFL season (pro-football-reference.com).
-1961 AFL teams’ uniforms (illustrations by Gridiron Uniforms Database at gridiron-uniforms.com/[AFL 1961]).

    The AFL (of 1960-69) had a 10-year battle with the established pro football league, the NFL.

In 1970, the AFL essentially won the battle, by virtue of the fact that the NFL allowed all 10 of the AFL franchises to join the NFL, in a full dual-league merger. Plus, the AFL won the last two match-ups with the NFL…Super Bowl III (1968 season) saw the AFL’s New York Jets beat the NFL’s Baltimore Colts, and Super Bowl IV (1969 season) saw the AFL’s Kansas City Chiefs beat the NFL’s Minnesota Vikings.

The map (click on image at the top of the post)…
The map shows the primary helmets and jerseys worn by the 8 AFL teams of 1961, the second season of the American Football League (IV) (1960-69). At the lower-right of the map-page are the final standings of the 1961 AFL, along with home jerseys and helmets of the 8 AFL teams of 1961. At the bottom-right corner are the attendance figures for the 1961 AFL, with comparisons to 1960 figures. At the upper-right of the map-page are standout players for the champions, the 1961 Houston Oilers. Below that are 1961 AFL offensive leaders in the following categories: Passing Yardage, QB Rating & TD Passes: George Blanda, Houston Oilers. Rushing Yardage and Yards from Scrimmage: Billy Cannon, Houston Oilers. Receiving Yards: Charlie Hennigan, Houston Oilers. Total TDs: Bill Groman, Houston Oilers.

The AFL survived its first season of 1960 in debt, but relatively unscathed. Although there was one franchise shift in 1961 (the Los Angeles Chargers moved 120 miles south to San Diego), the 8-team AFL stayed afloat, abetted primarily by the league’s five-year television contract with ABC. In 1961, the AFL as a whole averaged 17.9 K per game, which was a slight increase of 7% from their first season (when the new league drew 16.5 K per game). The true explosion in attendance (and popularity) for the AFL was about 4 years further down the road, though. (By 1965, the AFL would have an overall league-attendance of 31 thousand per game, a figure which was led by huge, plus-40-K-size crowds in New York City and Buffalo, NY.) The AFL as a whole lost about $2 million in its second year. But that was less than half the losses of the first season. There was a definite sense that, after two seasons battling the NFL, the AFL was no longer threatened with survival. In fact, in 1961, three teams – the Boston Patriots, the Buffalo Bills, and the Houston Oilers – did not end up in the red.

Below: chart showing 1960 & 1961 AFL attendances (overall-league-average, and all 8 team-averages ([home regular season games])…
afl_1960_1961_avg-attendances_oilers_chargers_bills_texans_patriots_titans_broncos_raiders_b_.gif
Above: Attendance from: profootballresearchers.org/archives/Website_Files/Coffin_Corner/13-04-430.pdf .
Helmet-icons by: gridiron-uniforms.com. Logos via sportslogos.net. Chart by billsportsmaps.com 2018.

    In 1961, the two repeat divisional champions – the Houston Oilers and the San Diego Chargers – were also the best drawing teams.

The Chargers and the Oilers both benefited from the fact that they were from cities which, back then, had no other major-league competition [Major League Baseball would soon place teams in both cities: Houston Astros in 1962, San Diego Padres in 1969]. Both the Oilers and the Chargers drew 27.8 K per game in 1961.

Below are brief profiles of the 8 AFL teams circa 1961…

Houston Oilers.
In 1960, the powder-blue-clad Houston Oilers, drawing a solid 20 K per game, had won the first AFL title (over the Los Angeles Chargers) {1960 AFL map/season, billsportsmaps.com}. And in ’61, in the midst of securing their second-straight title, the Oilers increased their crowds by over 7 thousand per game (at a league-best 27.8 K per game). But after 5 games in the 1961 season, with the Oilers at 1-3-1, owner Bud Adams (AFL co-founder with Lamar Hunt) had fired head coach Lou Rymkus. His replacement was Wally Lemm, who led the Oilers to 9 straight wins to finish the season. And so, on Dec 24 1961, in San Diego, the Oilers faced the Chargers in the AFL title game again. Led by QB/K George Blanda and HB Billy Cannon, and a defense that only gave up 3 points on the day, the Houston Oilers repeated as champions {see illustration further below}.

In 1960, rejected NFL QB George Blanda had came out of retirement to join the Houston Oilers as a 33-year-old. Blanda had been QB/K for the Chicago Bears from 1950-58, but he retired when he learned that George Halas intended to demote him to only placekicking duties. So when the AFL got started up, Blanda realized he could get another shot as a starting QB. In 1960 and ’61, Blanda led the Houston Oilers to the first two AFL titles, setting a TD passing record that stood for 23 years. Blanda threw 36 TD passes in 1961, and was selected as the Associated Press AFL Most Valuable Player. (That 36-TD-passes record was matched by YA Tittle of the NFL’s New York Giants two years later in 1963, and was not beaten until the NFL added 2 games to the season, and was first surpassed by Dan Marino in 1984; and is now held by Tom Brady with 50 TD passes.)

Below: Hall of Fame player who was on the 1961 Houston Oilers: George Blanda (QB/K) [Blanda was 1961 AFL MVP].
houston-oilers-1961_george-blanda_hall-of-fame_d_.gif
Images above – gridiron-uniforms.com/[AFL 1961]; 1962 Fleer card at pinterest.com.

One of Blanda’s main targets as he led the Oilers to those two consecutive AFL titles was Charlie Hennigan. Hennigan was a WR who had played for a small college in Louisiana (Northwestern State), and he had never gotten a chance in the NFL (he wasn’t even drafted by an NFL team). Hennigan was working as a high school football coach and Biology teacher before the AFL came along. In 1961, Hennigan had 12 TD Receptions and had a record-setting 1,746 yards receiving that season. This was a pro football record that stood for 34 years.

Other offensive standouts for Houston in ’61, besides the record-setting Blanda and Hennigan, were…Billy Cannon (HB, with a league-best 948 yards rushing and league-2nd-best 1,534 yards from scrimmage), Charley Tolar (FB, with 796 yards from scrimmage), and Bill Groman (WR, with 1,175 yards receiving and a league-best 18 total TDs). Houston’s offense was so explosive in 1961 that the Oilers ended up scoring 100 points more than any other AFL team that season. The Oilers scored 513 points in 1961 – an average of 36.64 per game. To this day, that is the 4th-best ever in pro football. {See this chart I made from 2013: All-time top 5 pro football offenses…#1: Rams 1950; #2: Broncos 2013; #3: Patriots 2007; #4: Oilers [AFL] 1961; #5: Bears 1941.}

From 1960-64, the Oilers played at the fondly-remembered Jeppesen Stadium, which was basically a glorified high school football stadium (at 36-K-capacity). (The Houston Oilers would go on to play in the Houston Astrodome from 1968 to 1996. The franchise moved to Nashville, TN, as the Tennessee Titans, in the late-1990s.)

San Diego Chargers.
After the 1960 season, the LA Chargers had given up on trying to compete for fans with the NFL’s Los Angeles Rams. So the Chargers moved down the freeway to San Diego, into Balboa Stadium [a former racetrack], where a second deck had just been added, making it a 34-K-capacity venue. In 1961, the dark-pastel-blue-clad and gold-lightning-bolt-bedecked San Diego Chargers drew 12 thousand per game more than they had drawn in LA, in 1960. But the Chargers peaked too soon in ’61, and coasted once they’d clinched the division, and then lost to the Oilers, again, in the 1961 AFL title game. And a worrying sign was that the 1961 title game did not sell out (5 thousand tickets went unsold at Balboa Stadium on December 24th, 1961). (The Chargers, under innovative head coach Sid Gillman, would go on to appear in 3 more AFL title games [5 in total], but would only win one AFL title – in 1963, when they demolished the Patriots 51-10. The Chargers would move into the 50-K-capacity San Diego Stadium in 1967, playing there until 2016. The franchise moved back to Los Angeles in 2017.)

Below: Hall of Fame player who was on the 1961 San Diego Chargers: Ron Mix (OT).
chargers-1961_hall-of-fame_ron-mix_b_.gif
Images above – gridiron-uniforms.com/[AFL 1961]; 1961 Fleer card from amazon.com.

Buffalo Bills.
Third-best drawing AFL team in 1961 was the up-and-coming Buffalo Bills, who drew 19.0 K at the rock-pile known as War Memorial Stadium. Despite their ramshackle venue, the Buffalo Bills would increase their crowd-size significantly in the following years, up to 43 K per game, en route to their 1964 and ’65 AFL titles. Buffalo might have played in a dump, but the franchise, owned by Detroit-based auto-dealership-heir Ralph Wilson Jr, was one of the three most stable franchises in the early AFL. (The other two stable early-AFL franchises being the Dallas Texans, owned by AFL founder Lamar Hunt, and the Houston Oilers, owned by AFL co-founder Bud Adams, both of whom came from big-oil-money.) In 1961, the Bills were still wearing their original colors of dark-blue-and-silver. The following year (1962), the Bills’ introduced their red-standing-buffalo helmet-logo, and their blue-white-red colors. (The Buffalo Bills would play at War Memorial Stadium until 1972, moving into their purpose-built 80-K-capacity stadium in 1973, in suburban Orchard Park, NY, located 11 miles south-east of Buffalo. The Bills are the only NFL team to lose four consecutive Super Bowl games [1990-93 seasons].)

Below: Hall of Fame player who was on the 1961 Buffalo Bills: Billy Shaw (OG).
buffalo-bills-1961_billy-shaw_hall-of-fame_c_.gif
Images above – gridiron-uniforms.com/[AFL 1961]; 1962 Fleer card from amazon.com.

Dallas Texans.
Fourth-best drawing AFL team in 1961 was the Dallas Texans, a franchise that would end up in Kansas City, Missouri a couple years later [as the Chiefs]. The red-and-gold clad Texans had been the top draw in the AFL in the first season, drawing 24.5 K per game. This was a particularly impressive figure, when one considers the fact that the Dallas Texans of 1960 had to compete for fans with the also-brand-new NFL expansion team, the Dallas Cowboys. But by 1961, competition with the Cowboys, for the local fan-dollar, was starting to erode the Texans’ support. Attendance fell 7 K per game, to 17.5 K in 1961. Dallas Texans owner-and-league-founder Lamar Hunt was beginning to see that his upstart AFL team could not compete locally with the long-established NFL, especially if (and when) the then-basement-dwelling Cowboys improved. The Dallas Texans would go on to win the 1962 AFL title, only to up stakes and move to Kansas City in 1963. (The Kansas City Chiefs went on to win 2 AFL titles [1966 & 1969], and the Chiefs won the last game ever played by an AFL team, Super Bowl IV [Jan 1970], over the Minnesota Vikings. The Chiefs have not appeared in a Super Bowl game since then.)

Below: standout player who was on the 1961 Dallas Texans: Abner Haynes (HB) [1960 AFL MVP & 1960 AFL Rookie of the Year].
dallas-texans-1961_abner-haynes_1960-afl-mvp_b_.gif
Images above – gridiron-uniforms.com/[AFL 1961]; 1962 Fleer card from amazon.com.

Boston Patriots.
Fifth-best drawing AFL team in 1961 was the Boston Patriots, who drew almost exactly the same sized crowds in their first two seasons (16.8 K in ’60; 16.5 K in ’61). The red-white-and-blue clad Patriots played at Boston University’s Nickerson Field. In their first season, the Patriots sported a bizarre-looking helmet-logo: a blue 18th-century-style tri-corner hat, floating on a white field atop red uniform-numbers {see it in the attendance chart further above, or here, at helmethut.com}. They wisely scrapped that confusing logo, and in 1961, the Patriots introduced their new helmet logo, a Minuteman-in-a-3-point-stance-hiking-a-football (aka Pat Patriot; that logo remained up to 1992). As mentioned before, the Patriots broke even in 1961, and this was an example of the relative stability that this franchise offered to the AFL in its wild and woolly early years. But the Patriots in their first eleven years had a vagabond-like existence, playing in 4 different venues…at Boston University (1960-62), then at MLB’s Fenway Park (1963-68), then at Boston College’s Alumni Stadium [in Chestnut Hill, MA] (in 1969), and then at Harvard Stadium (in 1970). In 1971, the Patriots finally got a purpose-built stadium, Foxborough, located completely outside of Boston, 23 miles south-west of downtown Boston, and 21 miles north-east of Providence, RI [hence their name-change to a more regional moniker, the New England Patriots]. (The Patriots would not win a title until 2001, but have now won 5 Super Bowl titles [last in the 2016 season].)

Below: standout player who was on the 1961 Boston Patriots: Gino Cappelletti (SE/K) [1964 AFL MVP].
boston-patriots-1961_gino-cappelletti_b_.gif
Images above – gridiron-uniforms.com/[AFL 1961]; 1962 Fleer card from psacard.com/team-sets/1960-1969-decade-patriots.

In 1961, there were two struggling AFL franchises: Oakland and New York, plus another bad-drawing team, in Denver.
The Oakland Raiders.
The Oakland Raiders were the last AFL franchise to organize, and this hurt them considerably, because the Raiders had no time to secure a viable venue. The largest football venue on the East Bay was in Berkeley: the University of California’s 81-K-capacity Memorial Stadium. But the Cal administrators refused to let the Raiders play there. So the Raiders were forced to play in San Francisco for their first two seasons. In 1960, the black-helmeted Raiders played at the home of the NFL’s San Francisco 49ers, at Kezar Stadium, and they drew just 9.4 K per game. After their first season the Raiders franchise was half-a million in debt and needed a $400,000 loan from Bills owner Ralph Wilson, Jr. to stay afloat. Then in 1961, the Raiders were forced to play at the windy and cold MLB-venue, Candlestick Park, and the Raiders drew a pathetic 7.6 K per game, and posted the league’s worst record (2-12). All this was because there was no suitable venue yet, across the Bay in Oakland. And the city of Oakland would not finish building the delay-plagued Oakland Coliseum complex for five more years. The Raiders threatened to re-locate, and the city of Oakland responded by slapping together a temporary stadium that was basically scaffolding. That was Frank Youell Field, located in a mixed-industrial area near downtown Oakland. It was supposed to be temporary, but thanks to multiple delays in the building of the Oakland Coliseum, the Raiders ended up playing at the small 22-K-capacity Youell Field for four years (1962-65) {see Raiders in the Youell Field era, in this illustration}. (Al Davis would be hired by the Raiders as head coach/GM, in January 1963, introducing the Raiders’ silver-and-black colors that year.) (The Raiders moved to Los Angeles, CA in 1982. After 13 years in LA, the Raiders moved back to Oakland, CA in 1996. The Raiders will move out of Oakland for the second time in 2019 or 2020, this time to play in Greater Las Vegas, NV. The Raiders won the 1967 AFL title, and have won 3 Super Bowl titles [last in the 1983 season].)

Below: Hall of Fame player who was on the 1961 Oakland Raiders: Jim Otto (C).
raiders-1961_jim-otto_hall-of-fame_d_.gif
Images above – gridiron-uniforms.com/[AFL 1961] ; 1963 Fleer card from marketplace.beckett.com.

New York Titans.
The NY Titans were stuck playing at the decrepit old Polo Grounds on the northern tip of Manhattan, NYC. The Titans were drawing poorly for a big-city team (at 15-K-per-game, which most observers felt was a grossly inflated figure). And the Titans ownership group was so cash-strapped that the following year, in order to meet payroll, the franchise would need big cash infusions from Dallas Texans owner-and-league-founder Lamar Hunt. (In 1963, the dark-blue-and-gold clad New York Titans franchise changed ownership, and became the green-and-white clad New York Jets. Then in 1964, the NY Jets would move out of the soon-to-be-demolished Polo Grounds, and into the big new municipal venue built by the City of New York, Shea Stadium in Queens, NYC. And in the ensuing years (1964-on), the Jets’ league-leading attendance would go on to skyrocket past 50 K per game, then past 60-K per game [and to full-capacity at Shea] by ’67. The New York Jets went on to win the 1968 AFL title, then the plucky Jets upset the NFL’s Baltimore Colts to win Super Bowl III [Jan. 1969]. The Jets have not appeared in any title game since then. The NY Jets have played in the state of New Jersey since 1984 [sharing a venue with the NY Giants].)

Below: Hall of Fame player who was on the 1961 New York Titans: Don Maynard (E).
new-york-titans-1961_hall-of-fame_don-maynard_b_.gif
Images above – gridiron-uniforms.com/[AFL 1961]. 1962 Fleer card, unattributed at pinterest.com.

Denver Broncos.
In 1961, the brown-and-mustard-yellow clad Denver Broncos were also drawing poorly, pulling in just 10.6 K per game. But time would later show that the Broncos’ sparse crowds in their first few seasons was mainly a result of how bad the team was (the Broncos went 3-11 in 1961). First proof of that was a year away: in 1962, the now-orange-and-blue clad Broncos won 4 more games, going 7-7, and drawing over 14 thousand more per game, at 25.4 K. (The Denver Broncos have remained on the same site in Denver since their inception in 1960…playing at Bears Stadium/Mile High Stadium [for 41 years up to 2000], and then at Broncos Stadium at Mile High [since 2001]. The Denver Broncos have won 3 Super Bowl titles [last in the 2015 season].)

Below: standout player who was on the 1961 Denver Broncos: Lionel Taylor (SE) [5-time All-AFL].
denver-broncos-1961_lionel-taylor_c_.gif"denver-broncos-1961_lionel-taylor_c_.gif"
Images above – gridiron-uniforms.com/[AFL 1961]; 1961 Topps card from vintagecardprices.com.

    1961 AFL Championship game (the Houston Oilers beat the Chargers in the title game, for the second straight season)…

The 1961 AFL title game was marred by poor officiating. It also featured 13 turnovers. Oilers QB George Blanda gave up 5 interceptions. But his 35 yd TD pass to Billy Cannon in the 3rd Q was the difference (see photos below). The irony was that the Houston Oilers, who had a high-powered offense that set records in 1961, won the AFL title that year thanks to a defense that kept the Chargers from scoring a TD.
http://billsportsmaps.com/wp-content/uploads/2018/12/houston-oilers_1961_afl-champions_balboa-stadium_george-blanda_billy-cannon_charlie-hennigan_n_.gif
Photo and Image credits above – 1961 AFL title game at Balboa Stadium, program from afl-football.50webs.com. George Blanda scrambling, photo by Hy Peskin at hypeskin.com/1961-afl-championship-houston-oilers-at-san-diego-chargers. George Blanda [photo from 1961 AFL Title game], photo by Hy Peskin at gettyimages.com. Billy Cannon on sideline, photo by Hy Peskin at hypeskin.com. Billy Cannon making a reception, photo by David F. Smith/Associated Press via nytimes.com/2017/11/02/sports/houston-championships. Chargers coaches berate lineman, photo unattributed at goldenrankings.com/AFLchampionship1961. Los Angeles Examiner headline Dec 25 1961, “Old Pro Blanda Whips Gillman Again”, from ebay.com. George Blanda scrambling, photo unattributed at fs64sports.blogspot.com. Oilers [1960 photo] in huddle, unattributed at sportsecyclopedia.com/nfl. Charlie Hennigan, unattributed at nflpastplayers.com. Oilers players on bench [photo circa 1961], screenshot from Full Color Football #1 uploaded by TheAFLHistory at youtube.com.
__
Photo and Image credits on the map page…
Houston Oilers,
Oilers players on bench [photo circa 1961], screenshot from Full Color Football #1 uploaded by TheAFLHistory at youtube.com. Reproduction of 1960-61 Houston Oilers helmet, photo from supersportscenter.com. George Blanda [photo circa 1964], unattributed at goldenrankings.com. George Blanda [photo from 1961 AFL Title game], photo by Hy Peskin at gettyimages.com. Don Floyd [1961 Fleer card], from marketplace.beckett.com. Billy Cannon [photo circa 1961], unattributed at fanbase.com. Charley Tolar [1965 photo/re-done as quasi=1961 Fleer card], from boblemke.blogspot.com. Bill Groman [photo from 1960], photo unattributed at sportsecyclopedia.com/[Houston Oilers]. Tony Banfield [1962 Fleer card], from footballcardgallery.com. Charlie Hennigan [photo circa 1964], unattributed at crazycantoncuts.blogspot.com. Al Jemison [1962 Fleer card], from ebay.com.

Offensive stats leaders on map page,
George Blanda [photo circa 1961], photo unattributed at fs64sports.blogspot.com. Billy Cannon [photo circa 1962], from AP via chron.com/sports. Charlie Hennigan [photo from 1961 AFL title game], photo by http://hypeskin.com/wpbeta/1961-afl-championship-houston-oilers-at-san-diego-chargers//wpbeta/1961-afl-championship-houston-oilers-at-san-diego-chargers/”>hypeskin.com. Bill Groman [1961 Fleer card], from amazon.com.

Thanks to,
-Blank map by anonymous US federal government employee, at File:StatesU.svg (commons.wikimedia.org).
-Thanks to Sportslogos.net for 1960-era AFL team logos.
-Thanks to Buffalo Bills official site for original Bills logo (1960-61).
-Thanks to Infinite Jets blog for hard-to-find full-color NY Titans logo.
-Thanks to the Coffin Corner newsletter, for this pdf, profootballresearchers.org/archives/Website_Files/Coffin_Corner/13-04-430.pdf [AFL attendance by team 1960-69] .
-Thanks to the contributors at pro-football-reference.com.
-Thanks to the contributors at AFL 1961 season (en.wikipedia.org).
-Special thanks to Tim Brulia, Bill Schaefer and Rob Holecko of The Gridiron Uniform Database, for giving billsportsmaps.com the permission to use football uniforms illustrations from Gridiron Uniform Database {GUD}.

« Newer PostsOlder Posts »

Powered by WordPress