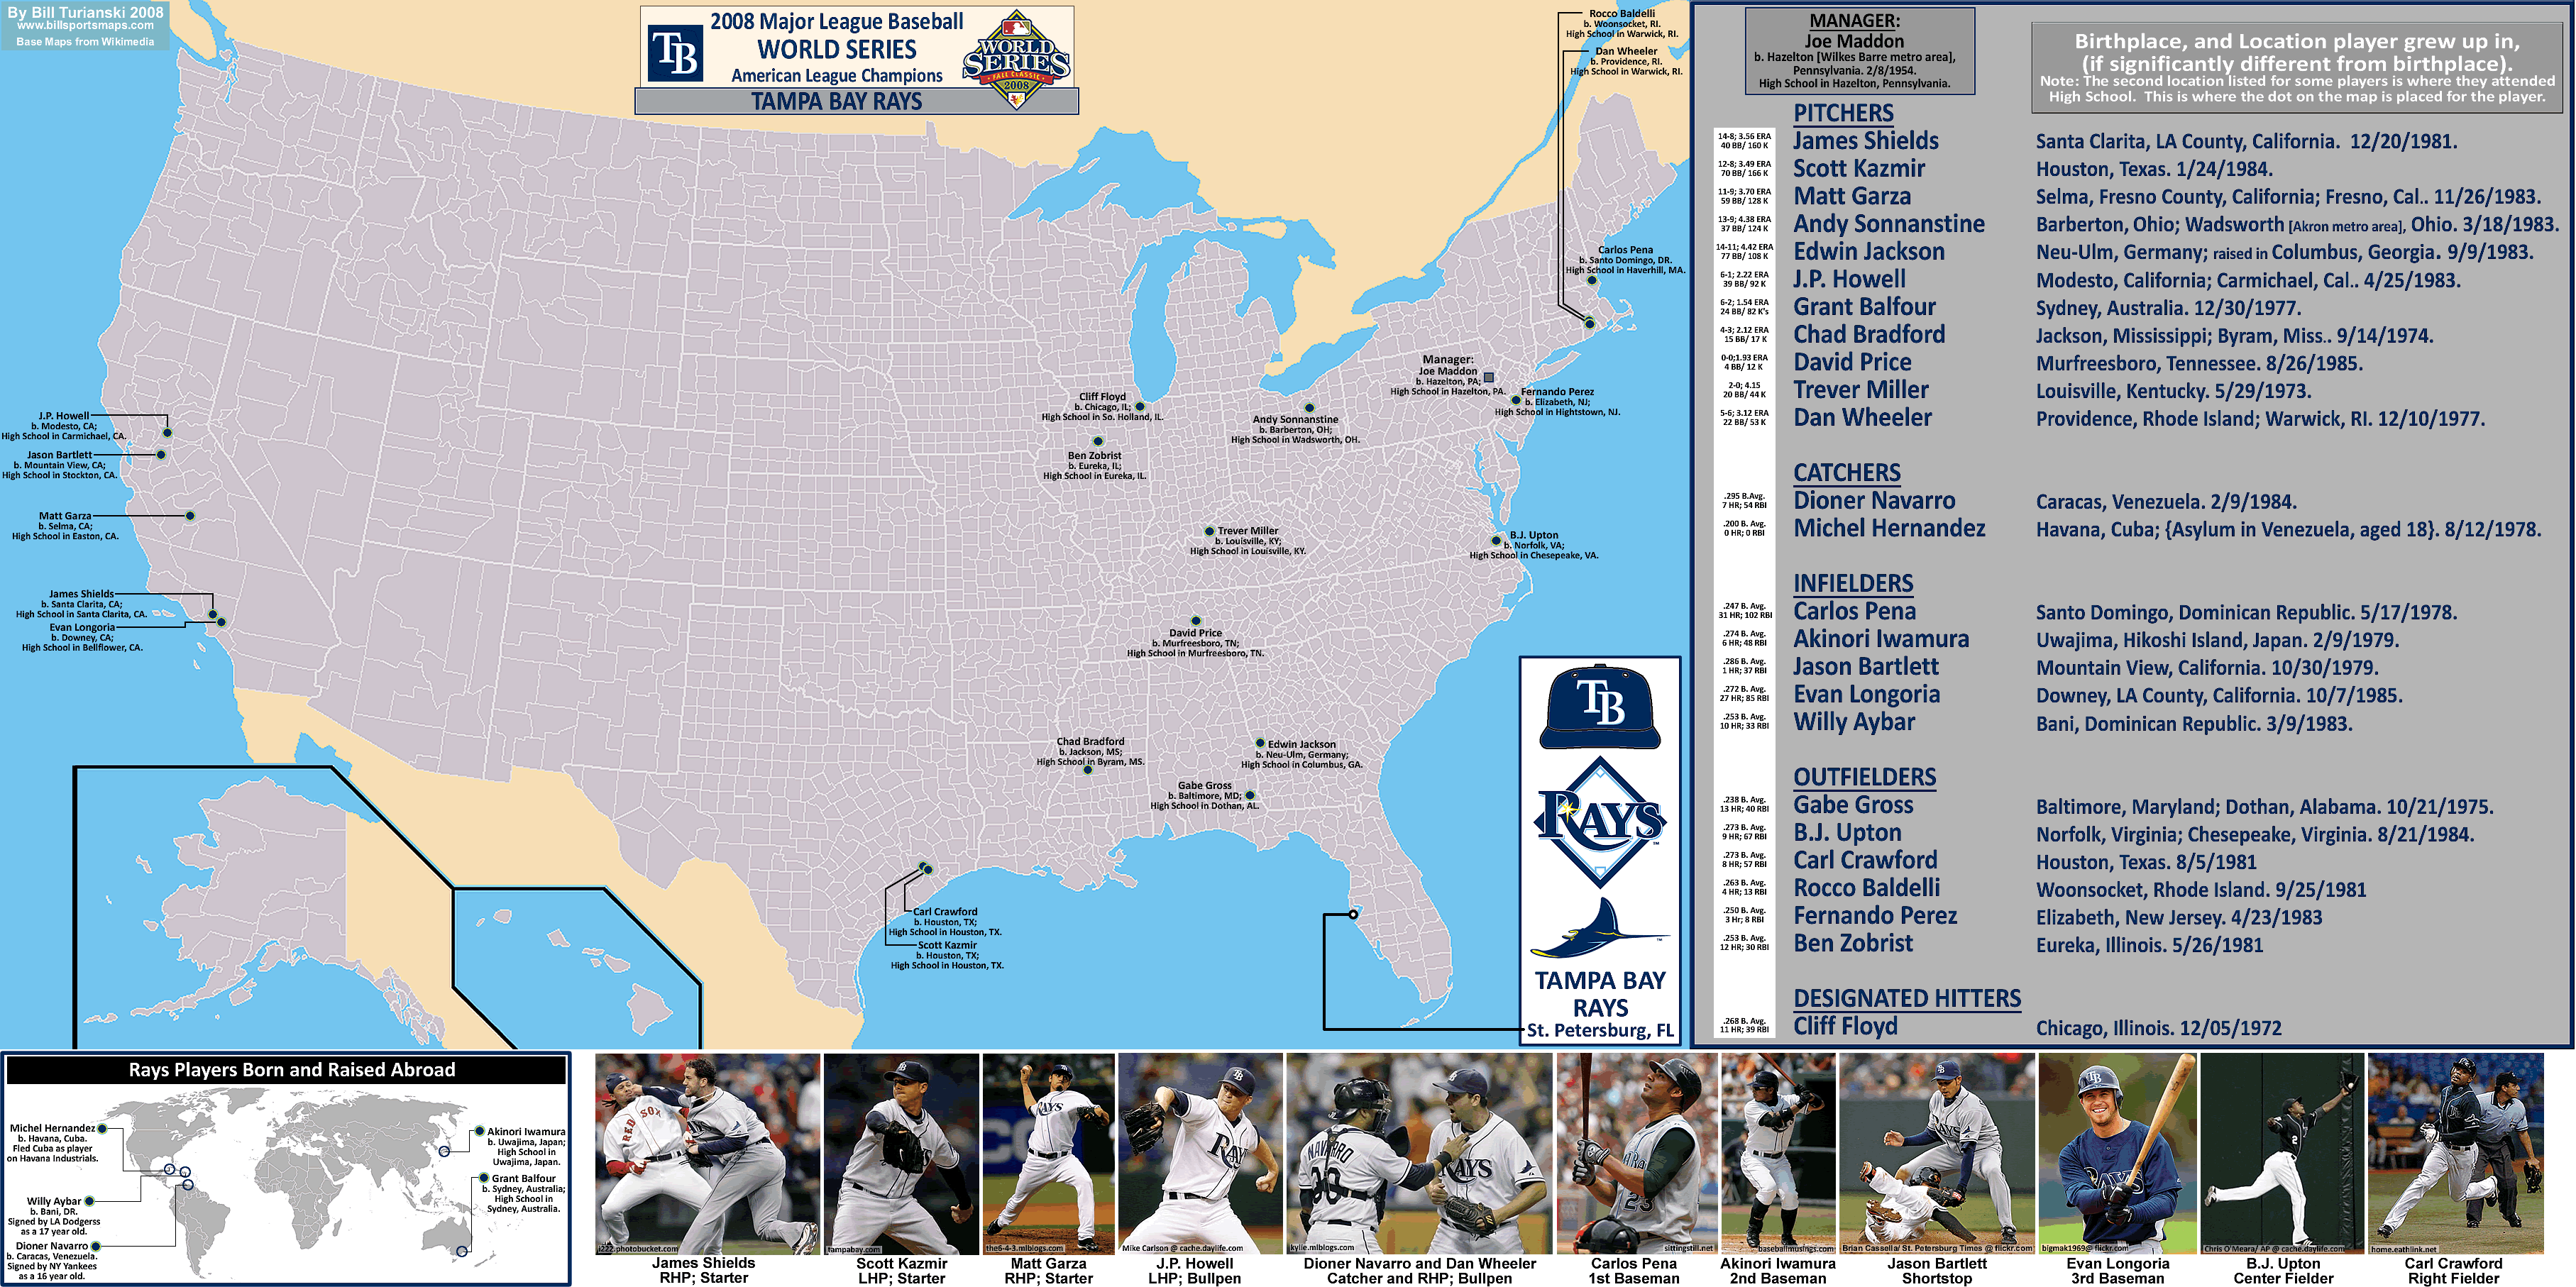
billsportsmaps.com

April 7, 2009

Major League Baseball, 2008 attendance map.

Filed under: Baseball,Baseball >paid-attendance — admin @ 5:23 pm

mlb_08attendance_map_post.gif


Please note: to see the most recent MLB paid-attendance map-and-post, click on the following: category: Baseball >paid-attendance.

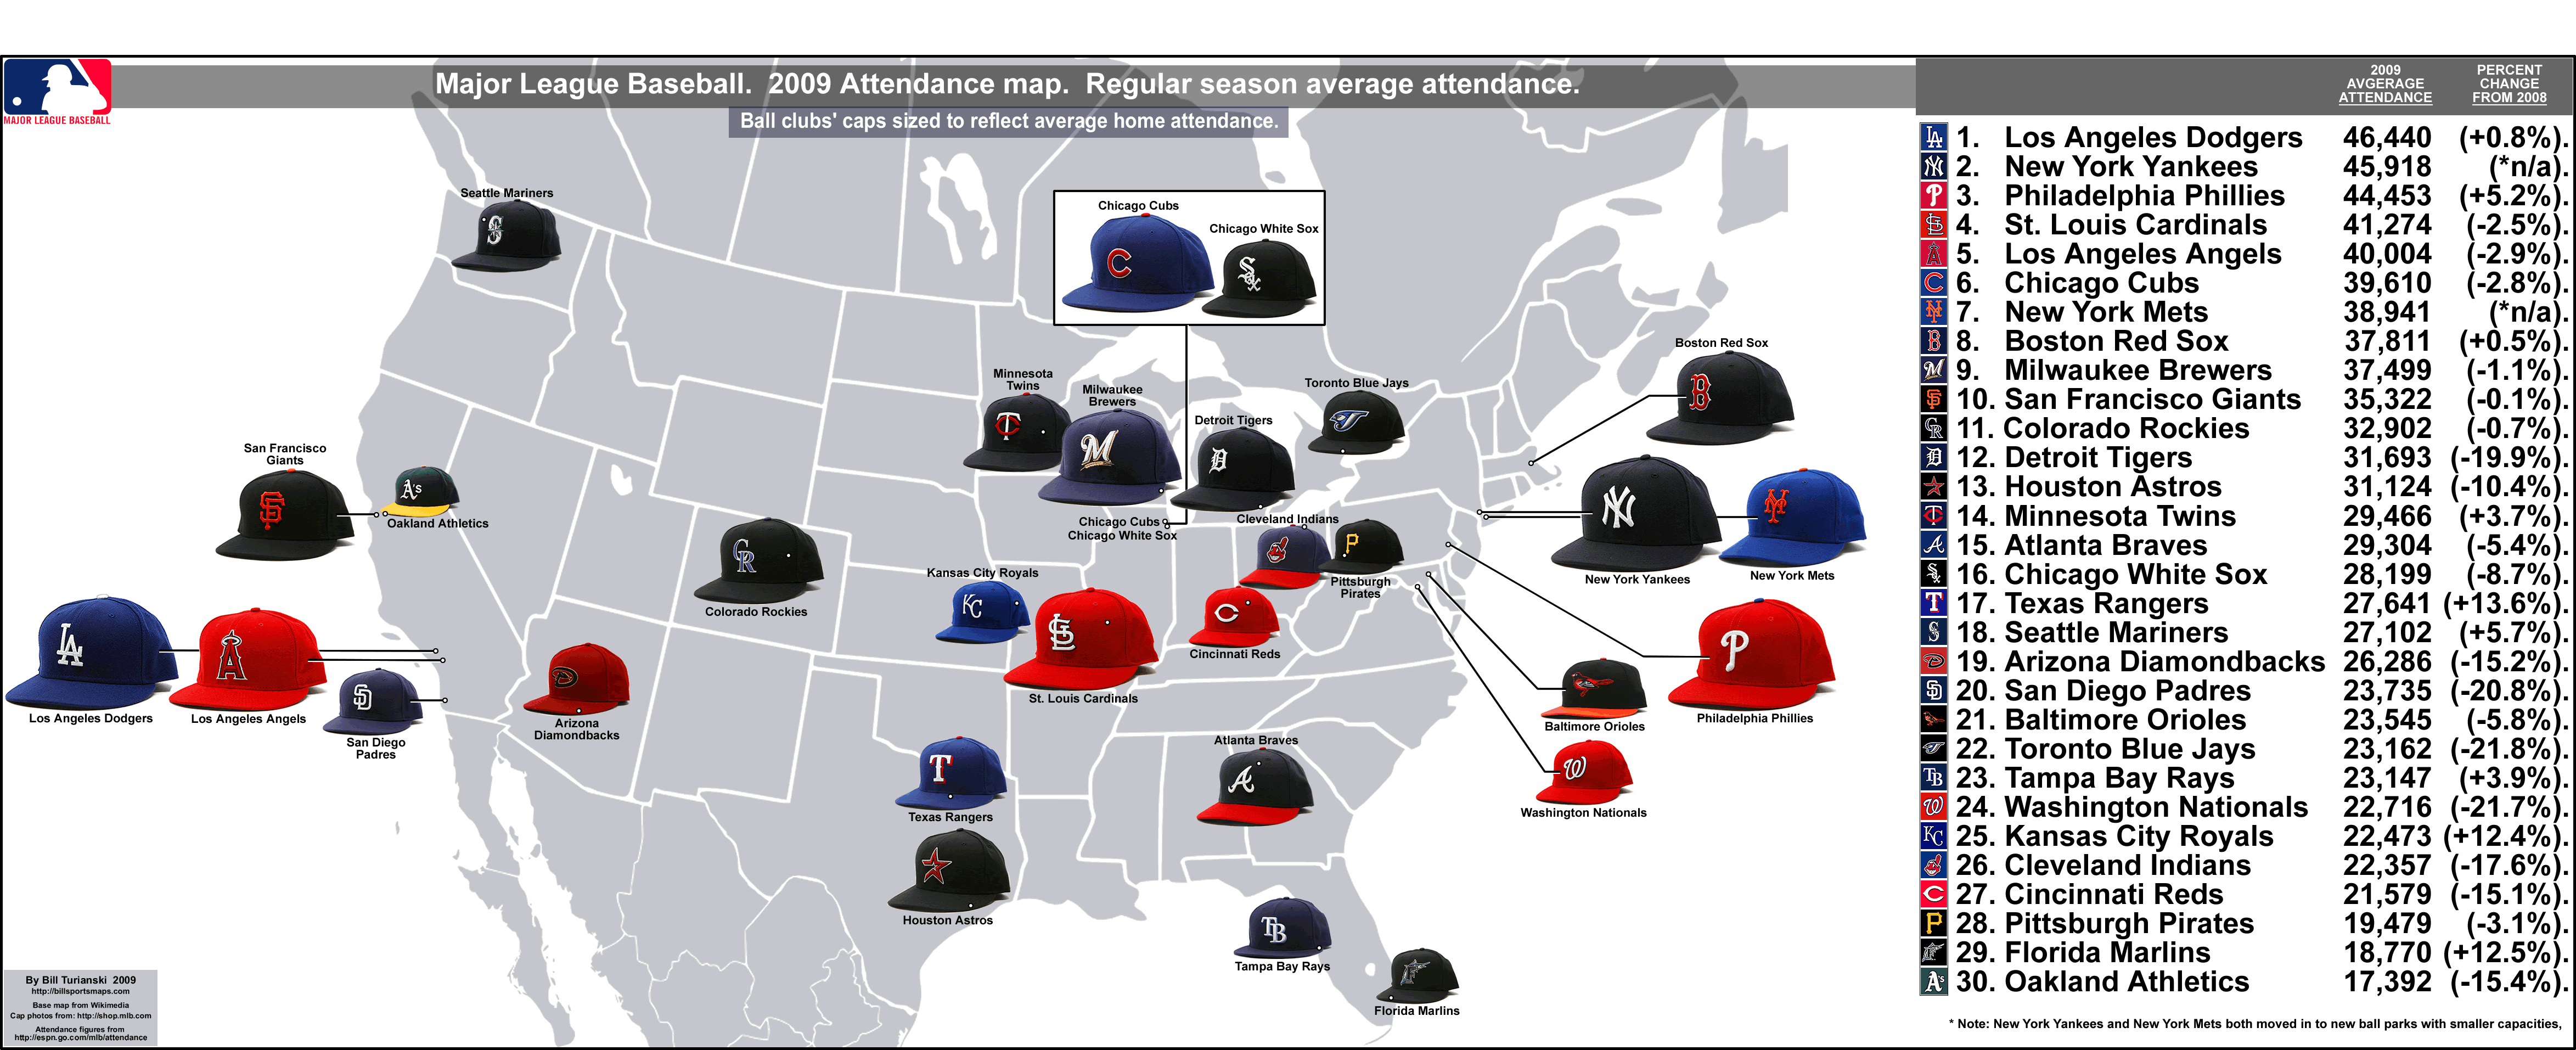
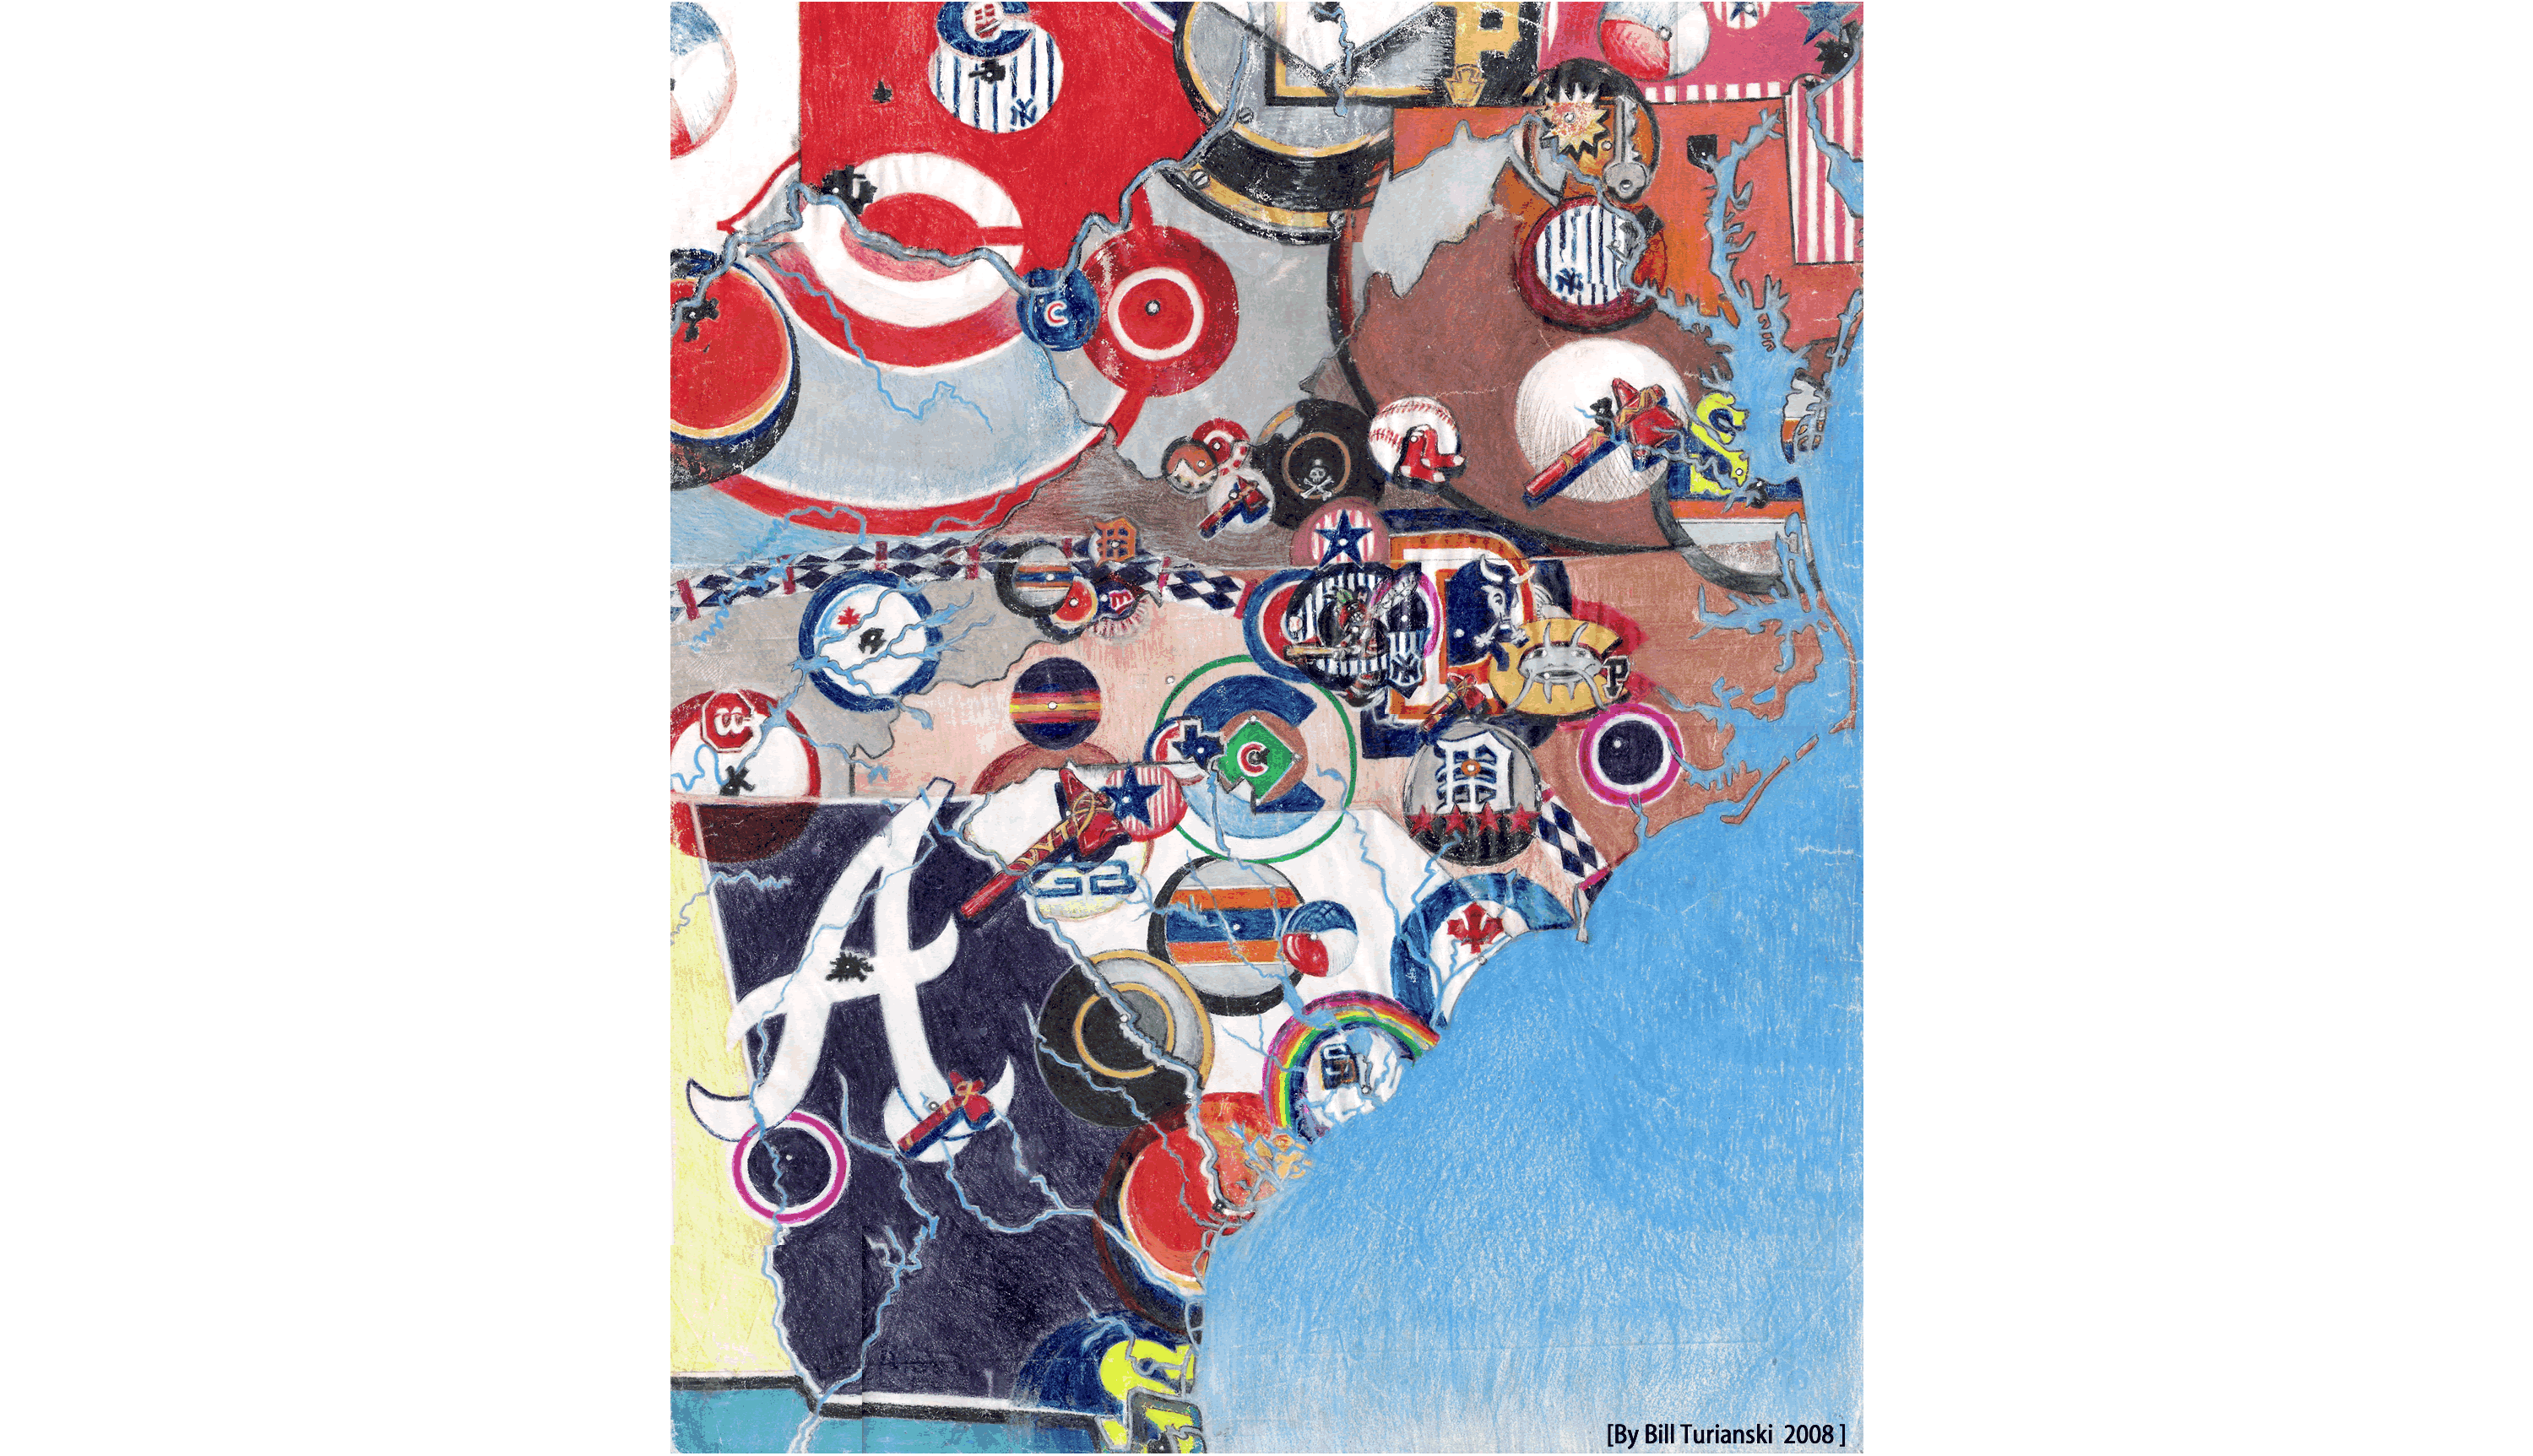
On the map,  each MLB team’s 2008 average attendance is listed on the far right.  On the map itself, each ball club’s cap crest is sized to reflect their 2008 gate figures.   Last season’s overall attendance was the second highest ever,  at 32,516 per game, 1.4% behind the record-setting figures of 2007.

Here are the top 5 drawing ball clubs from 2008, and their gate figures from five seasons before, in 2003…

[One note...In 2008, the Boston Red Sox drew to 104.0% capacity, and the Chicago Cubs drew to 99.1% capacity  {capacity-based 2008 gate figures , here}.  Both these ball clubs have smaller sized parks than the top 5 teams listed below.  Of course,  much of the charm of Boston's Fenway Park and Chicago's Wrigley Field is just this intimate (and well-aged) atmosphere,  so it is sort of pointless to debate whether these two clubs would be pulling in top-5-drawing-ball-club numbers if their parks were bigger.  Because if their parks were bigger,  the two ball clubs wouldn't be playing in Fenway and Wrigley, but rather in new ball parks, because there is basically no room for significant expansion at both sites. And both the Red Sox and the Cubs would be crazy to move out of these priceless landmarks.]

1. New York Yankees. 2008: 53,069 per game / 2003: 42,785 [1st highest].  I remember going to Yankees games in the early 1990′s, when there would never be more than 25,000 on a weekday game. In 1990 , the Yankees averaged 24,771 per game. After the New York Yankees’ dominance of the 1996-2000 period (with 4 World Series Titles and 4 AL Pennants in 5 years), the crowds swelled.  By 2000,  the Yankees were averaging 38,193. There followed average gates of 40,811 (2001), 43,323 (2002), 42,263 (2003), 46,609 (2004), 50,502 (2005), 52,445 (2006), and 52,729 (2007).

The Yankees’ on-field failures in the latter part of the last five seasons have not in the least affected their gigantic crowds, but of course the gate figures will go down this season only because the new Yankee Stadium has a smaller capacity. Yankee Stadium (II) seats 52,325, around 4,100 less than the final capacity of  the old Yankee Stadium.  Compare this to the situation in the late 1980′s and early 1990′s.  After the Yankees great run in the late 1970′s and early 1980′s,  the organization started spending unwisely on a revolving door of over-the-hill players and/ or players unable to handle the full-glare media presence in New York City. The team underachieved for years, and fans just stopped showing up. People like to be associated with a winner. Of course, the Yankees did make the playoffs every season from 1995 to 2007,  and in comparison,  the Yankees did not make the playoffs from 1982 to 1994.  So even if the team plays in the most populous metropolitan area in the USA, the sparse crowds of the 1980′s and early 1990′s are understandable. 

The new stadium probably assures attendances won’t fall off, even if the Yankees continue to fall short of a successsful season…except for one crucial factor. That is the combination of increased ticket prices coming at a time of a severe economic downturn.  I guess we’ll see. One thing should be remembered: even in the Yankees’ greatest eras, their attendance was not as good as it has been in the last 12 years.

When Roger Maris hit his 61st home run on the last day of the 1961 season, there were just 23,154 in attendance (the Yankees averaged 21,577 that year, and that was a championship season). 

Many call the 1927 Yankees (featuring Babe Ruth, Lou Gehrig, Bob Muesel, and Tony Lazzeri, aka “Murderers’ Row” {see this}) one of the (if not the ) greatest-ever baseball lineups.  Average attendance in Yankee Stadium in 1927 ?  15,117 per game {see this, from Baseball-Reference.com}. OK, granted, the bulk of home games then were during working hours, and NYC was far less populous than today. But still.

In 1978, the World Champion Yankees drew merely 28,855 per game en route to their second straight title. The Yankees’ highest gate figures through the 1970′s and 1980′s was in 1980, when the AL Pennant winning Yankees drew 32,437 per game.  So when was the Golden Age of Baseball? If you measure that by gate figures, we’re living in it. 

Here is Wikipedia’s page on the new Yankee Stadium {click here}.

2. New York Mets. 2008: 51,165 / 2003: 28,406 [16th highest in MLB]. In 2001, the year after the Mets last won the NL Pennant, the ball club drew 32,818 per game. Their average gate then shrunk by over 4,000 to 28,406 by 2003. This was in the bottom half of the league, at 16th highest. But the franchise turned this around mainly by improving their squad… By 2007, with their new crop of players coming into their own and bringing excitement to the dreary, unfriendly and jet-flight-path-cacaphonous confines of Shea Stadium (the place sucked,  basically), the crowds for Mets games increased dramatically (41,723 per game in 2006; 47,580 per game in 2007). And two straight seasons of choking in September will not hurt the gate figures this season. Nevertheless, the figures will go down, because like their cross-town rivals, the Mets are moving into a shiny new ball park with a smaller capacity. But it seems to me the Mets made their new park a bit too small.  Citi Field will seat just 42,000, which is 15,000 less than Shea Stadium, and 9,165 less than what the Mets drew last season. Maybe it won’t matter, and gate figures will start falling anyways, if the divided-by-cultures (Anglo players vs. Latin players) Mets team continues to meltdown when it matters most.  Here is a nice article about how crucial the 2009 season is for the Mets, by ex-Deadspin.com editor Will Leitch, from the March 15, 2009 edition of New York Magazine  {click here}.

3. Los Angeles Dodgers. 2008: 46,056 / 2003: 38,748 [4th highest]. A couple years ago, there was talk about how the Angels were starting to challenge the Dodgers for fan-base supremacy in southern California. But the Angels, as improved an organization as they are in the last decade, will probably never outdraw the Dodgers. Dodger Stadium is simply an incredible place. The entire stadium is re-painted every off-season, it is perpetually spic-and-span, and it is home to a ball club with as much tradition, history, and (eventual) success as any in the baseball world. And the voice of the Dodgers is the venerable and mellifluous Vin Scully. My brother told me about a Dodgers blog he came across called Vin Scully Is My Homeboy {click here}, which pretty much answers the question of whether the LA Dodgers will be able to tap into the ever-growing Latino baseball fan market, now that the Angels are owned by a Latin American.

4. St. Louis Cardinals. 2008: 42,353 / 2003: 35,930 [7th highest]. Speaking about first class organizations and huge fan bases, the Cardinals have drawn over 30,000 per game in 21 of their last 24 seasons. In the late 1970′s they were stagnating, though, and drew only 17,101 per game in 1980. The Cardinals won their ninth World Series title two seasons later, in 1982, and drew 26,073 per game that year. By 1985, the NL Pennant winning Cardinals were drawing 32,563 per game. Since then, the only years the ball club has drawn below 30,000 per game were in 1991 and 1992, when they drew in the 29,000′s; and in the strike-shortened 1995 season, when manager Joe Torre was fired midway through the season and the team finished 62-81 (the Cardinals drew 24, 344 per game that year). The next season, 1996, current manager Tony LaRussa took over, and the team’s fortunes and gate figures began their ascent. It is ironic to consider that the Cardinals had their worst recent year at the gate when Joe Torre was in charge, since Torre was the man who managed the Yankees to their last 4 Titles and shepherded the Bronx ball club into their most lucrative period ever. 

But getting back to St. Louis…their huge fan base has only gotten bigger after the opening of Busch Stadium (III) in 2006 {see the stadium’s page on Wikipedia, here}, and their surprise World Series title later that year. It was a surprise because that Cardinals team had peaked 2 seasons earlier, and at just 83-78, the 2006 Cardinals squeaked into the playoffs, where they shocked the Mets (who have never recovered) thanks to a late 7th game home run by weak hitting catcher Yadier Molina {recap, here}. The Cardinals, now veterans of the post-season grind, then used that momentum to dismantle the upstart Detroit Tigers in the Fall Classic, 4 games to 1. The 2006 St. Louis Cardinals became the team with the least amount of victories to ever win the World Series; it is their 10th World Series title, second to only the New York Yankees 27 World Series Titles.

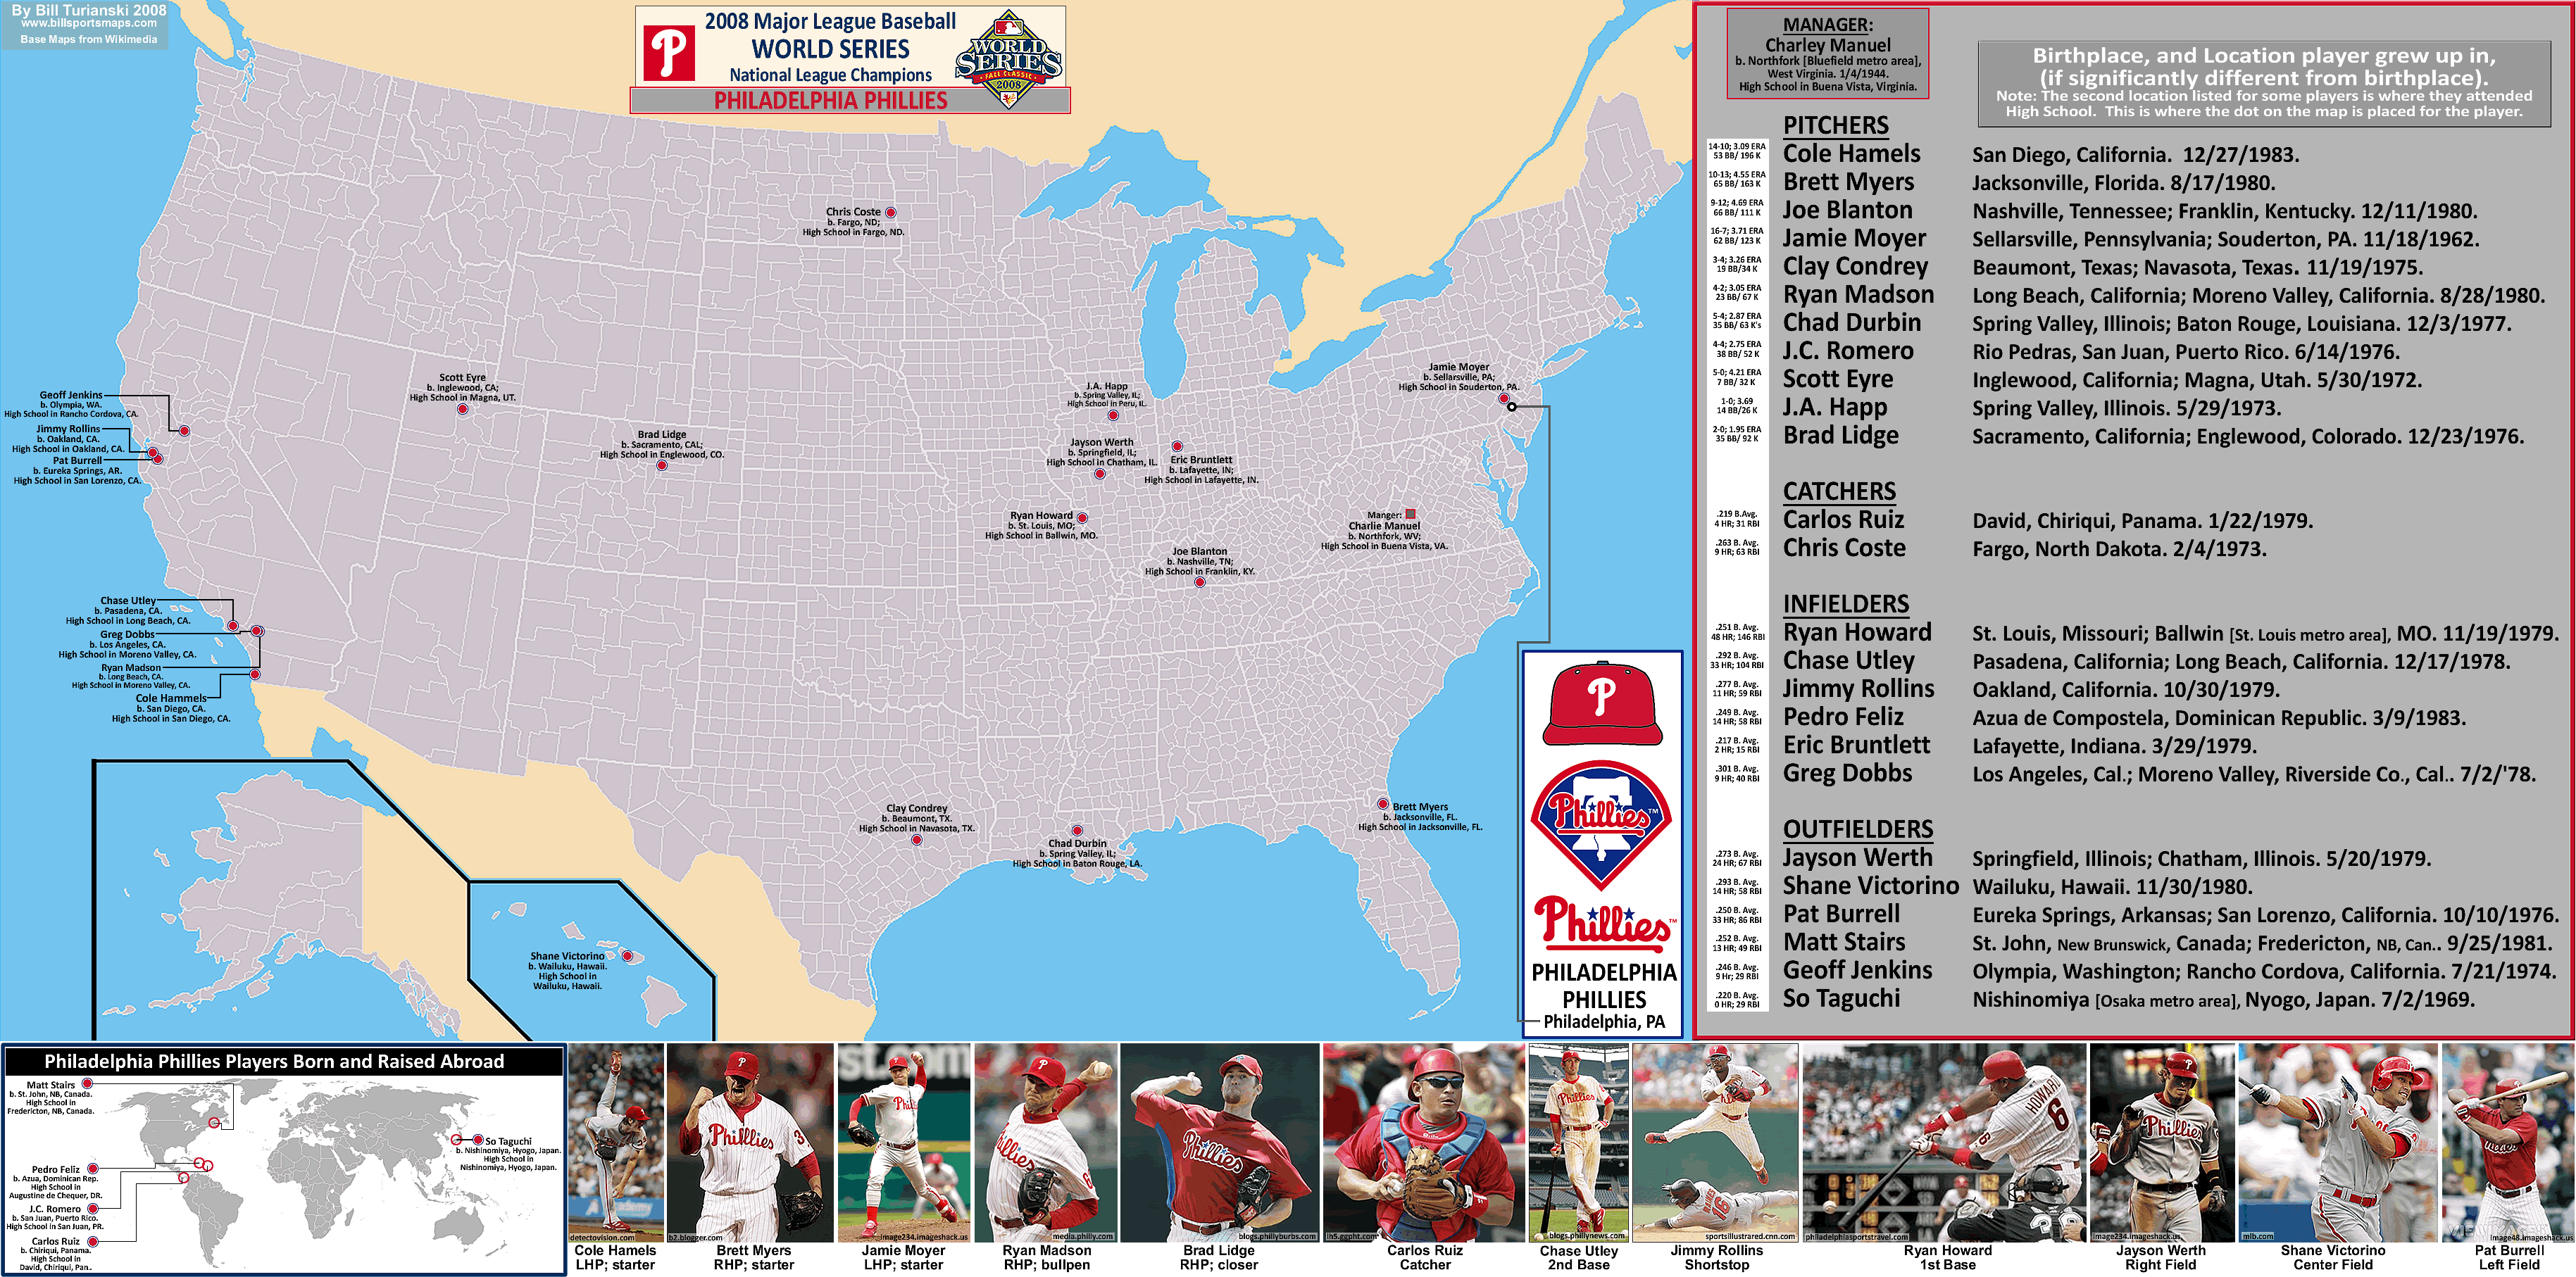
5. Philadelphia Phillies. 2008: 42,254 / 2003: 28,973 [14th highest in MLB].  The Phillies went through decades of futility sprinkled with periods of disappointment, with only one World Series title (in 1980) in over 120 years of existence.  But last October, they buried a good deal of that negativity by bestowing the city of Philadelphia with it’s first major league sports title in 30 years. There are three factors which contributed to the Philadelphia Phillies’ near-100% capacity gate figures last year. First off, the club has had 7 out of 8 winning seasons since 2001.  Secondly, the city has always boasted committed (if ill-mannered) fans. And third, the Phillies moved into a new ball park in 2004 {Citizens Bank Park page at Wikipedia, here}.

The Phillies were drawing in the 30,000′s in the years leading up to their first championship in 1980. But the large crowds fell away as the years went by after that, and the franchise reached a level of mediocrity in a god-awful ugly Veterans Stadium that moldered in it’s concrete-encased,  plastic-turf covered gloom.  Te hugely entertaining NL Pennant winning Phillies of 1993, led by such colorful characters as John Kruk,  Mitch Williams,  and Kurt Schilling, produced a two-year spike in gate figures, with the ball club pulling in 38,737 per game in 1993. The next season showed almost the same figures, but by 1997, the ball club was in the basement, and the average gate was only 18,403.  The Phillies’ record improved in the years from 1998 to 2003 on a generally uphill progression, and the gate figures improved too, but not drastically, with the high point here being the last year in Veterans Stadium, 2003, with an average crowd of 27,901. 

Still that’s not half-bad for a horrible stadium,  perhaps the worst of it’s ilk,  which was the now-dreaded multi-purpose,  circular concrete stadium  {see this} {see this, on Veterans Stadium,  from BallParksOfBaseball.com site}. City planners thought they were pretty smart,  building stadiums for both their MLB and NFL teams. What they didn’t really look into was the fact that these stadiums were doomed to be lousy venues for both sports. 

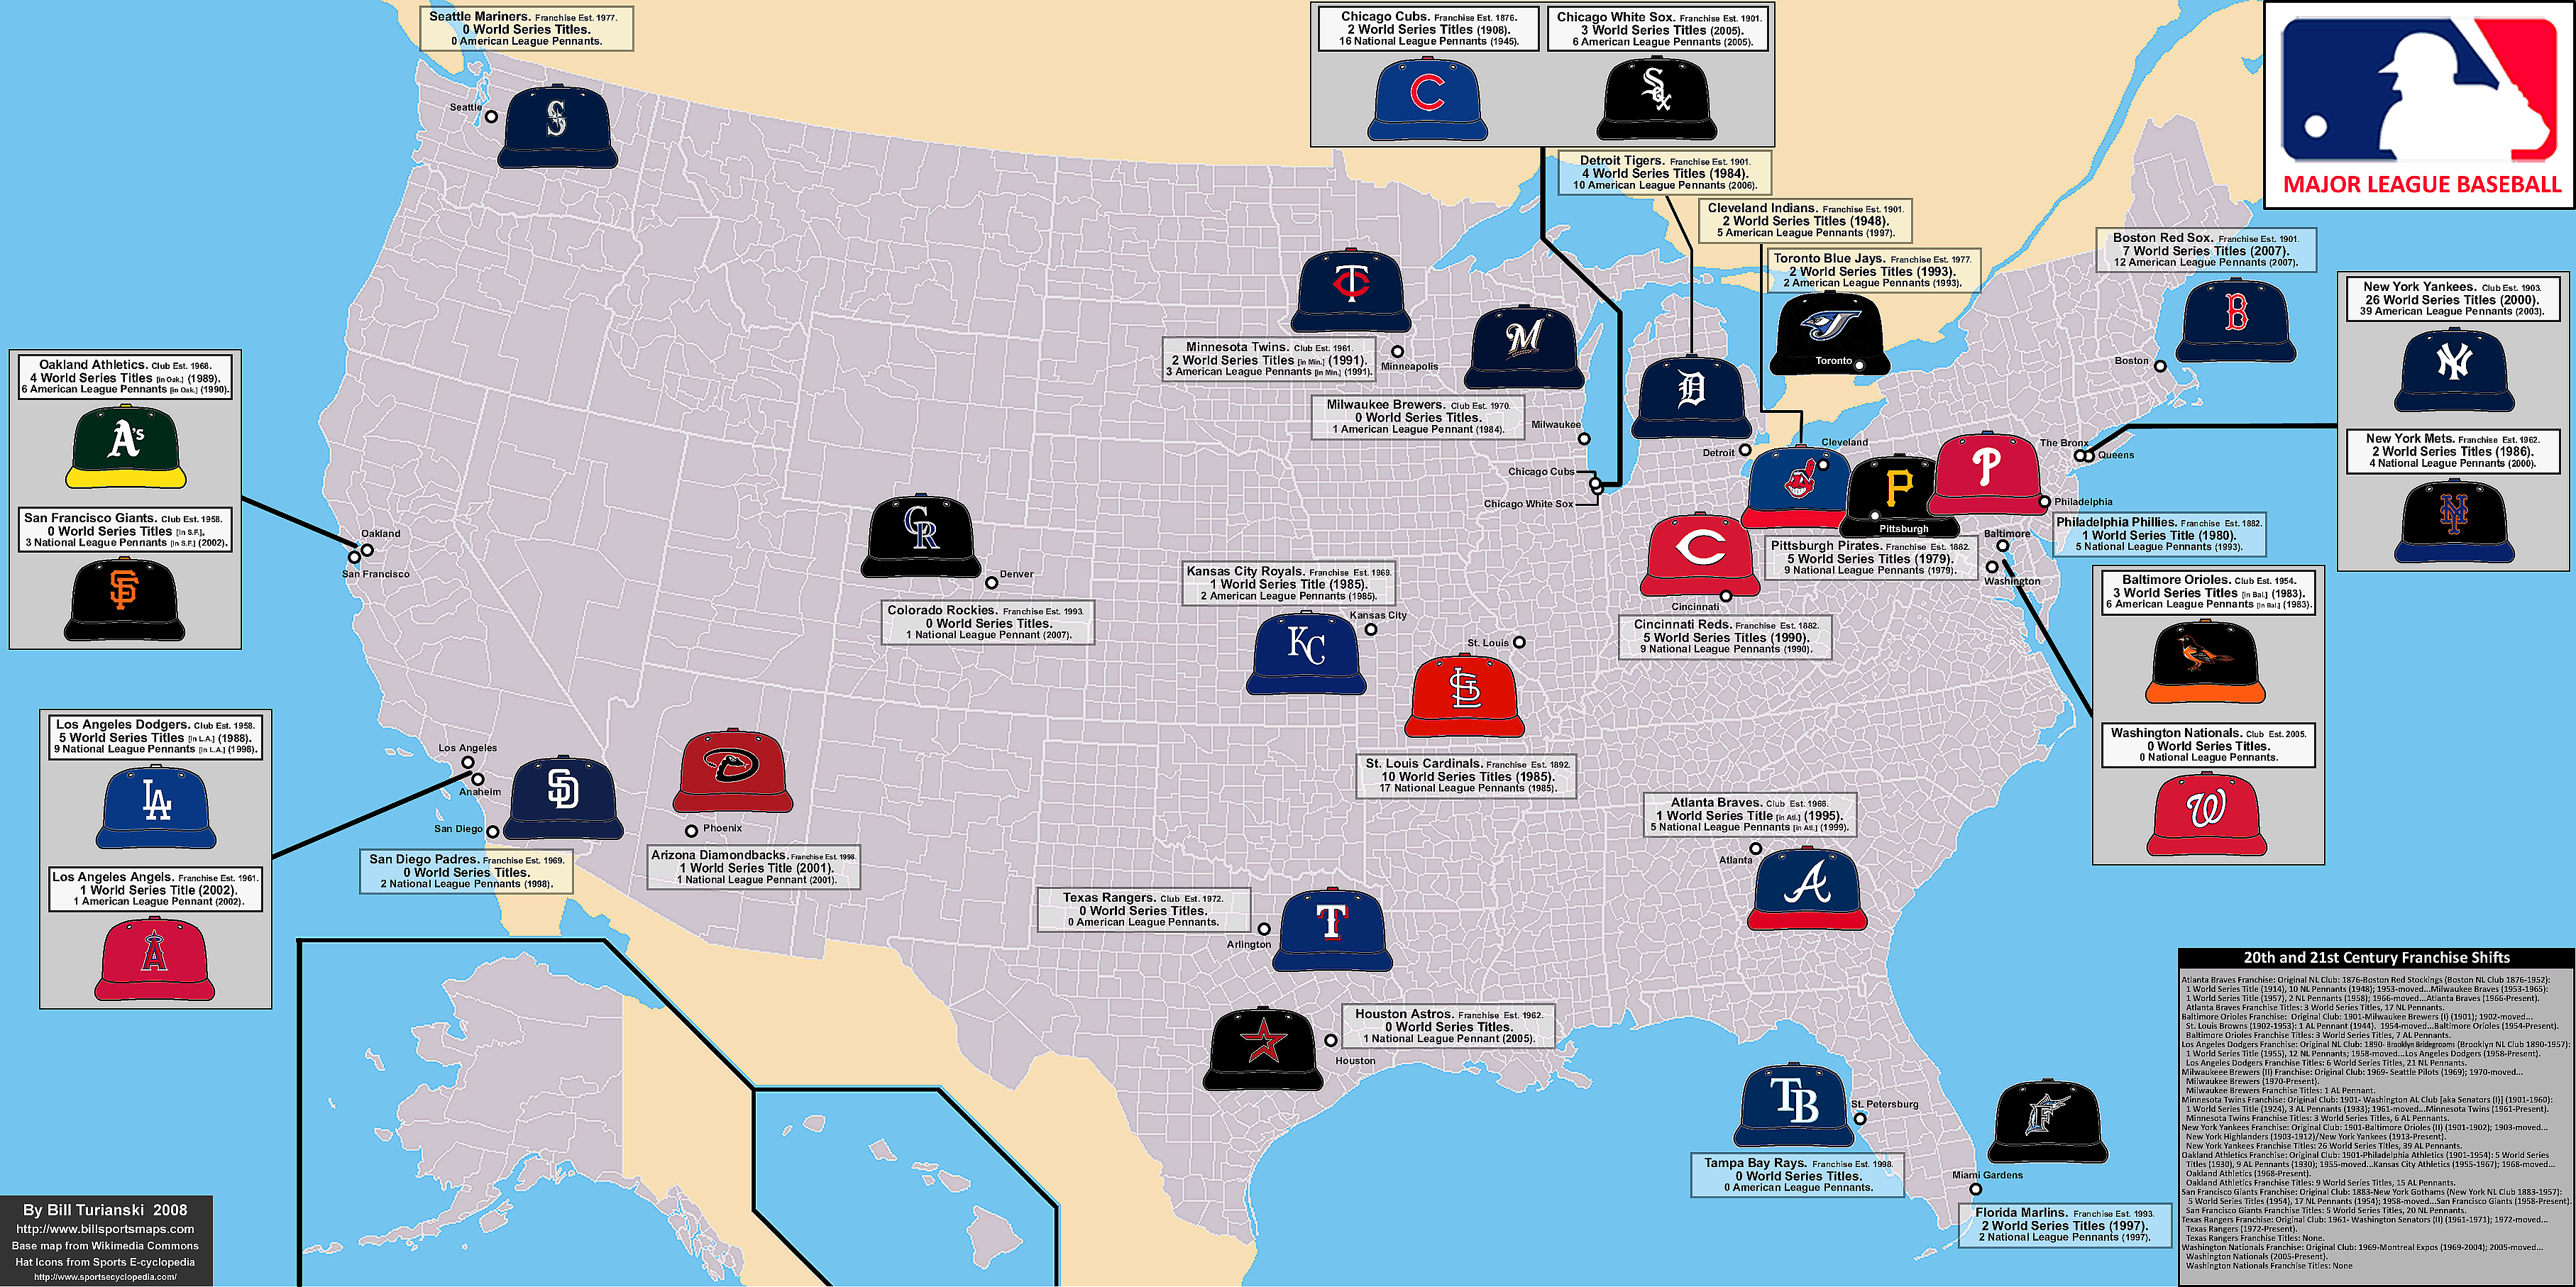
These monstrosities plagued Major League Baseball throughout the 1960′s, the 1970′s, the 1980′s,  and into the mid-1990′s. There is little doubt, in retrospect, that this type of stadium began depressing baseball attendance figures by the mid 1980′s, when these stadiums began to age in a rather ungraceful way, and baseball fans began wondering why they weren’t being allowed to see their city skylines hidden behind a wall of usually empty outfield seats.  So much of the whole attraction of going to a ball game is the unique aspect of each ballpark, a factor which was eliminated by these multi-purpose behemoths. Sight lines were bad, and the seats were invariably too far away from the action on the field. And they were freaking ugly. In the multi-purpose heyday, circa 1985 or so,  about 40% of MLB cities were afflicted by these concrete purgatories…San Francisco, Oakland,  San Diego, Seattle, Houston, St. Louis, Minneapolis, Cincinnati, Pittsburgh, Atlanta, Montreal, and New York (the Mets’ Shea Stadium). The only two that remain are the Minnesota Twins’ Metrodome, and the Oakland Athletics’ Oakland-Alameda County Stadium; and the Twins will be moving into a new, suitably retro-themed open-air ballpark called Target Field, next year {see this}. 

Oakland’s situation, though, is fraught with difficulties. When the NFL’s Raiders moved back to Oakland from Los Angeles (in 1995), the stadium got a Frankenstein makeover that left the Athletics fans behind home plate having to stare at a Death-Star-like structure looming behind center field, a sheer wall of nose-beed football seats that was soon dubbed “Mount Davis”, after the Raiders’ Mephistophelian owner, Al Davis {see this}. Something tells me this issue will never go away, and the A’s will have to move to Sacramento or Las Vegas, or learn to live with Mount Davis.

-   

All baseball fans owe a huge debt to the Baltimore Orioles organization of the early 1990′s, which oversaw the creation of the trailblazing Oriole Park at Camden Yards {see the ball park’s page at Wikipedia, here}. Since then 11 MLB franchises have followed suit by building similar asymetrical ballparks which a) maintain a traditional feel,  while b) being coupled with modern amenities {see this list}. And which have nothing to do with the damn NFL.

Thanks to ESPN for the attendance figures {click here}.  Thanks to Baseball-Reference.com for attendance figures from earlier seasons {click here (set at 1990)}.   Thanks to the contributors to the pages at Wikipedia {MLB page, here}

October 22, 2008

2008 Baseball World Series, Tampa Bay Rays: Team Roster, with Birthplaces and Home Towns Listed.

Filed under: Baseball — admin @ 3:32 pm

mlb_tampa-bay-rays-2008worldseries-roster_birthplace-map_post_a.gif


The map features the full 25-man Tampa Bay Rays World Series roster.  The locations on the map are for where each Tampa Bay Rays player (and their manager) went to high school.  Instead of making this map one that records birthplaces,  I tried to make it better reflect where each player grew up  (ie,  their home town).

Here are the 5 longest serving players on the Devil Rays/ Rays…1. Carl Crawford, OF (since July 20, 2002).   2. Rocco Baldelli, OF (since March 31, 2003).   3. B.J. Upton, OF (since August 2, 2004).   4. Scott Kazmir, P (since Aug. 23, 2004).   5. Edwin Jackson, OF (since April 22, 2006).

As with the Phillies current roster,  the Rays have 2 players who went to high school in the same town.  Rocco Baldelli and bullpen pitcher Dan Wheeler both attended schools in Warwick, Rhode Island.  Two Latin American players now on the Rays were signed in their teens by MLB clubs.  Venezuelan catcher (and All-Star) Dioner Navarro was signed by the New York Yankees when he was 16.  Dominican outfielder Willy Aybar was signed by the Los Angeles Dodgers when he was 17.  And there is one Ray,  back-up catcher Michel Hernandez,  who fled Cuba when his ball club,  Havana Industrial,  was playing in Mexico,  in 1996.  18 years old at the time,  Hernandez sought and received asylum in Venezuela,  where he still lives.

Tampa Bay Rays’ regular season statistics  {Click here}.

Philadelphia Phillies’ regular season statistics  {Click here}.

Here is a nice feature on the MLB site that ties in with the two roster/hometowns maps I posted today:  {Click here for mlb.com’s Pennant Traces}.

___
Thanks to the contributors to the Tampa Bay Rays pages on Wikipedia {Click here}.  Thanks to Baseball Cube  {Click here}.

2008 Baseball World Series: Philadelphia Phillies, Team Roster with Birthplaces and Home Towns Listed.

Filed under: Baseball — admin @ 5:44 am

mlb_philadelphia-phillies-2008worldseries-roster_birthplace-hometown-map_post_b.gif


The map features the full 25-man Philadelphia Phillies World Series roster. The locations listed on the map are for where each Philadelphia Phillies player (and their manager) went to high school.  Instead of making this map one that records birthplaces,  I tried to make it better reflect where each player grew up (ie, their home town). 

Here are the 5 longest serving players on the Phillies…1. Pat Burrell, OF (since May 24, 2000).   2.  Jimmy Rollins, SS (since September 17, 2000).   3. Chase Utley, 3B (since April 4, 2003).   4. Ryan Madson, P (since September 27, 2003).   5. Ryan Howard, 1B (since September 1, 2004). 

It is interesting to note that two Phillies relief pitchers were born in the small north-central Illinois town of Spring Valley, a couple hours’ drive south-west of Chicago.   J.A. Happ ended up attending high school in neighboring Peru, Illinois;  Chad Durbin’s family moved down South when he was young,  and he attended high school in Baton Rouge, Louisiana.  Also,  two Phillies players attended high schools in the same town, Moreno Valley,  in Riverside County, California (just east of Los Angeles:  reliever Ryan Madson,  and 3rd baseman Greg Dobbs.

I have added regular season statistics for each player.  During the baseball playoffs, baseball broadcasts usually don’t show the regular season stats for players in the course of the game.  After the first game of the post season, they will pretty much only show players’ current post season stats,  as if the regular season stats no longer are relevant.   So,  for the pitchers,  there are individual numbers for W-L, ERA, Walks,  and Strikeouts;  for the position players,  there are the numbers for Batting Average,  Home Runs, and Runs Batted In.  I could not squeeze in stats like games played,  innings pitched,  and on-base percentage,  but you can get full  Philadelphia Phillies Regular Season statistics here… {Click here (USA Today site) }.  Tampa Bay Rays Regular Season statistics here {Click here}. 

Thanks to the contributors to the Wikipedia pages of the Philadelphia Phillies {Click here},  and the Tampa Bay Rays {Click here}.

Thanks to Baseball Cube {Click here}. 

Thanks to Diamond Mind Baseball/ SAT Repository site  {Click here},  for linking to this post.

October 9, 2008

Major League Baseball: Map with all 30 ball clubs, showing each club’s titles; with a list showing 20th and 21st Century franchise shifts.

Filed under: Baseball — admin @ 3:27 pm

baseball-mlb30hats_post_b.gif


(Note: my most current map of MLB teams an be found at the following, category: Baseball > Paid-Attendance.)

A little while back,  I got a question asking if I had made,  or knew of,  a chart showing all the franchise shifts in Major League Baseball.   So when I was making this map,  I decided to add a table showing all the franchise shifts in MLB during the 20th and 21st Centuries.  No bells and whistles like colors and logos,  though  (maybe I’ll do one like that in the future),  just the ball clubs’ names,  years in existance,  franchise shifts,  and titles.  

I skipped the 19th Century franchise shifts…there were a whole lot of fly-by-night ball clubs in the formative years of the National League.  But for the record,  here are the defunct 19th Century National League ball clubs that won NL Pennants…Providence Grays,  2 NL Pennants (1879 and 1884).   Detroit Wolverines,  1 NL Pennant (1887).   Baltimore Orioles (I),  3 (consecutive) NL Pennants (1894-1896).   For the complete list of National league Pennant winners from 1876 to 1968 (the extra tier of playoffs began in 1969),  {Click here}. 

The National League was founded in 1876.  In total,  there were 27 National League franchises from the 19th century  {see this}.   No NL ball club has folded since 1899.  The 8 franchises that survived the NL’s contraction from 12 teams to 8 teams,  after the 1899 season,  are still in the National League today  {see this},  although the Chicago Cubs are the only NL ball club that has remained in the same city,  uninterrupted,  since 1876.   I know this gets confusing,  but the Chicago Cubs were originally called the Chicago White Stockings (I).   [This ball club had no connection to the American League franchise formed a quarter-century later.]   It wasn’t until 1902,  and two name changes (the Chicago Colts,  then the Chicago Orphans),  that the NL Chicago ball club officially became the Chicago Cubs.   

The Atlanta Braves’ franchise also dates back to 1876;  this ball club began as the Boston Red Stockings (aka Red Caps).  [Again,  this National League Boston club had no connection with that American League franchise formed a quarter-century later who later became the Boston Red Sox.]  The Braves’ franchise has went through 10 name changes and 3 cities. 

The third and fourth oldest National League franchises still in existence both date back to 1883.  They are the Philadelphia Phillies (originally known as the Philadelphia Quakers) and the San Francisco Giants (originally the New York Gothams;  but known as the New York Giants from 1885 to 1957).  

The fifth oldest NL franchise is the Pittsburgh Pirates,  who joined the National League as Allegheny (no city name and no plural, initially),  in 1887.  The club had left the rival late 19th Century major league called the American Association (which existed from 1882 to 1891;  see this).   The ball club got their present name after the Philadelphia Athletics of the AA accused them of piracy,  in acquiring one of Philadelphia’s best players.  The Pittsburgh club took the pejorative and used it to their advantage,  renaming themselves the Pittsburgh Pirates in 1891.  Not incidentally,  this affair was one of the contributing factors which led to the demise of the American Association,  the next year.

The sixth and seventh oldest NL franchises both date to 1890.  They are the Cincinnati Reds and the Los Angeles Dodgers.  The Reds were not connected with the two Cincinnati Red Stockings ball clubs,  the first being the first nationally successful pro baseball club (from 1866 to 1870 and pre-dating the National League…see this).  The latter Cincinnati Red Stockings were a founding member of the National League in 1876,  but were expelled from the league in 1880 for serving beer at games,  and for violating ballpark lease arrangements.  The present-day Cincinnati Reds joined the National League in 1890,  leaving the American Association  (see this time-line of the American Association).  Another club left the AA to join the NL in 1890…the Brooklyn Bridegrooms.  This club went through 2 name changes prior to the endearingly anachronistic Bridegrooms moniker,  and 4 more name changes before they officially became the Brooklyn Dodgers (in 1932).  They were known in the period from approximately 1899 to 1910,  bizarrely,  as the Brooklyn Superbas (after a popular acrobatic troupe of the time).  By this time,  the nickname of Trolley Dodgers had gained currency for the Brooklyn club…the story goes that their ball park then was at the confluence of several mass transit lines,  so the fans were literally dodging trolleys and streetcars to get to the park.  But from 1914 to 1931,  the club was officially known as the Brooklyn Robins,  after their manager Wilbert “Uncle Robbie” Robinson.  However,  fans and sportswriters alike used the Dodgers moniker interchangeably in describing the hapless,  yet beloved ”Bums” of Brooklyn.   Of course,  the Brooklyn Dodgers toiled in futility,  then later in agonizing runners-up status (with 6 World Series losses,  the last 5 all to the New York Yankees,  between 1941 and 1953),  until they finally won the World Series in 1955.  The underdog borough of Brooklyn had little time to revel in its new status as champions.   Two years later the management of the Brooklyn Dodgers,  succumbing to the lure of free,  soon-to-be valuable land to build a new stadium,   broke the heart of the borough by moving clear across the country to Los Angeles,  California.

The eighth oldest National League ball club is the St. Louis Cardinals.  They were yet another club that arrived in the National League via the American Association.  This occurred in 1892,  after the AA folded.  They were first known as the St. Louis Brown Stockings.  In 1899, they called themselves the St. Louis Perfectos.  In 1900,  the club changed their name to the St. Louis Cardinals,  but not after the bird,  but the shade of red.   In the 19th Century,  it was traditional for many ball clubs to name themselves after the color of their socks,  and the term cardinal was a more common name for a shade of red back then than it is now.   The Cardinals in fact did not display ornithological iconography until 1922  {see this}.

The American League began in 1901.  All 8 of the founding franchises still exist,  but only 4 are still in the same city…the Chicago White Sox (who began as simply as the White Stockings),  the Cleveland Indians (who began as the Cleveland Blues),  the Detroit Tigers,  and the Boston Red Sox (this ball club had no official nickname until they adopted the Red Sox name in 1908).  For the complete list of American League franchises,  names,  and shifts,  {Click here}.    

For the complete list of AL Pennant winners,  {Click here}.

The map shows all 30 current MLB clubs,  with each club’s primary ball cap.  On the main map,  titles are listed for the city the ball club plays in now.  Total franchise titles are listed in the chart at the bottom.

As with regards to the dots showing each ball club’s geographic placement… I listed the actual city,  town,  or metropolitan borough the ball club plays in  (ie,  the New York Yankees play in The Bronx;  the Florida Marlins play 15 miles north of downtown Miami,  in Miami Gardens,  etc.).

Thanks to the Sports E-cyclopedia site, for the baseball hat icons.  http://www.sportsecyclopedia.com/.

Thanks to all the nameless contributors to the invaluable MLB pages which are on Wikipedia.

July 11, 2008

Baseball of the Southeast, circa 1992.

Filed under: Baseball,Hand Drawn Maps — admin @ 10:43 pm

baseball_southeast_post.gif


Major League Baseball clubs in this map are the Atlanta Braves, the Baltimore Orioles, the Cincinnati Reds, and the Pittsburgh Pirates.  The Phillies logo isn’t included, but you can see Philadelphia in the far upper right of the main map.

All the other teams on the map are minor league ball clubs.  Their parent MLB clubs are indicated by icons depicting the MLB clubs’ colors and logos.  For example,  the blue, orange, and gray circles are New York Mets minor league clubs (or farm clubs);  the blue and sky-blue circles with the maple leaf are Toronto Blue Jays farm clubs; the teams with the red tomahawks are Atlanta Braves farm clubs, and so on.

April 16, 2008

Baseball of the Upper Midwest, circa 1992.

Filed under: Baseball,Hand Drawn Maps — admin @ 6:48 pm

baseball_upper_midwest_post2.gif


I drew this map around 15 years ago, in autumn 1992 through to early 1993.  I ended up doing 3 of this type of map: one of the Northeast (which I’ve already posted);  this one;  and one, of the South, that I will post later this spring.  These maps combine Big League ball clubs with all of the minor-league ball clubs in the region. 

The Major League Baseball clubs in this map are the Chicago Cubs, the Chicago White Sox, the Cincinnat Reds, the Cleveland Indians, the Detroit Tigers, the Kansas City Royals, the Milwaukee Brewers, the Minnesota Twins, and the St. Louis Cardinals.  The Toronto Blue Jays, and the Pittsburgh Pirates emblems are also shown: those two cities are just east of where this map is cut off. 

All the other ball clubs on the map are minor league baseball teams.  These teams are all affiliated with a Major League Baseball parent-club.  [A few of these clubs are defunct; and some have changed names, and/or affiliation] .  The affiliations are indicated on the map by the smaller MLB-club-icons, next to each minor league team’s logo.

To see my map: “Baseball of the Northeast, 1992,” click here. 

To see more of my hand-drawn baseball maps, go to the Categories section on the upper right of the screen, and click on “baseball.”

November 26, 2007

Negro League Baseball, 1920-1950.

Filed under: Baseball,Baseball: Negro Leagues,Hand Drawn Maps — admin @ 7:16 am

negro-leagues_segment_c.gif
Negro Leagues map


Denied entrance into Major League Baseball by the color barrier, black ballplayers organized leagues of their own. These were the Negro Leagues, which existed between 1920 and 1957. The primary leagues were the Negro National League (1920-31; and 1933-48); the Negro Southern League, a minor-league (1920-40);  the Eastern Colored League (1923-28); and the Negro American League (1937-57). [For purposes of this map, records will only go to 1950, after which the Negro American League, the last negro league, essentially played exhibition games.] 

There were many standouts in the Negro Leagues, and 34 players have been elected to the Baseball Hall Of Fame. The first five elected were Satchel Paige (the legendary right-handed pitcher);  Josh Gibson (catcher, and home run king); James ”Cool Papa” Bell (center fielder, and base-stealer extroardinaire);  Buck Leonard (first baseman, slugger); William “Judy” Johnson (third baseman, with a .349 lifetime batting average); and Oscar Charleston (outfielder, and slugger, with a blend of power and speed; and a .376 lifetime batting average). More information about the Negro Leagues can be found at www.blackbaseball.com, and at the Negro Leagues e-Museum @ http://www.coe.ksu.edu/nlbemuseum/,  among other good sites.

Negro League baseball was characterized by fleet-footed action, and hi-jinks, ranging from tomfoolery to deadly serious one-upsmanship. There was more base-stealing than in Major League Baseball, and there was a sense of “playing to the crowd.” The teams knew the fans (particularly the significant portion of white customers) were there to see a show, and the players didn’t disappoint. An example of this was the barnstorming (traveling) club called the Indianapolis Clowns, an outfit similar to the Harlem Globetrotters. But that did not mean that Negro League baseball was an inferior product. During this era, negro baseball squads often defeated white MLB squads in exhibition games. Seasons were generally around 60 to 70 games long. There were no real standardized schedules, and teams operated on a shoe-string budget. 

The Golden Age of the Negro Leagues can be seen as the period from 1933 to 1947. The Washington-Homestead Grays regularly outdrew the Major League Baseball team the Washington Senators in Griffith Park in Washington DC, as they racked up 9 straight Negro National League titles. The Chicago American Giants played in old Comiskey Park, home of the MLB team the Chicago White Sox. The Pittsburgh Crawfords played in the first entirely black-owned ball park, Greenlee Field, and traveled the country in style, in their custom-made bus. The Newark Eagles won the 1946 NNL title, under Effa Manley (the first woman owner-operator to win a championship; she became the first woman inducted into the Baseball Hall of Fame, in 2006). And the Kansas City Monarchs toured the continent with their state-of-the-art portable lighting system. The Kansas City Monarchs would set up shop most anywhere, playing to thousands on a nightly basis. The Monarchs began using lighting for night games in 1930, five years before MLB teams first did. The KC Monarchs ranged throughout the midwest, the upper midwest and Canada. The Monarchs ended up sending more players to Major League Baseball than any other Negro League team. Their star pitcher, Satchel Paige, made more money than most major leaguers. It was an amazing phenomenon, that only ended when blacks were finally able to play in the Major Leagues. In 1947, Jackie Robinson, of the Brooklyn Dodgers, broke the color barrier, and the Negro Leagues days were numbered. Owners saw their star talent go to the white ball clubs, with no financial compensation. By the mid 1950s, the few surviving Negro League clubs were basically playing exhibition games, and the whole era faded away under the public radar. But the legacy of the Negro Leagues cannot be overstated.

I drew the main map in 2001. I added the flanking segments in 2007. I have included the 17 most prominent Negro Leagues ball clubs.

November 8, 2007

Baseball of the Northeast, 1992.

Filed under: Baseball,Hand Drawn Maps — admin @ 9:13 am

92_baseballneast_segment4.gif


I made this map in 1992, back in the days before the internet:  my source for team information was “The Baseball Almanac, 1991″ by Dan Schlossberg.  The minor league team’s affiliations are noted by small crests or icons of the parent club.  The green and tan baseball diamond in the center of New York State represents Cooperstown and the Baseball Hall Of Fame.  Many of the smaller minor league teams shown here are defunct, like the Albany-Colonie Yankees, the Geneva Cubs, the Watertown Indians, the Welland (Ontario) Pirates, the St. Catherines (Ontario) Blue Jays, and the Utica Blue Sox.  Some of the logos here I took the liberty of inventing, like the Blue Sox crest, and the one for the Frederick Keys, in Maryland.  I carved out domains for the Major League teams, trying to be as realistic as possible, while still maintaining a graphic balance.   The New York Yankees got all of Upstate NY, northern and coastal New Jersey, and Fairfield County, Connecticut.  The New York Mets got all of Long Island, NY, plus a Met-colored bar cutting a swath through northern NJ.  This style of representing fan bases proved too problematic and arbitrary, though.  My maps have evolved to where I now usually depict team crests larger or smaller, depending on average attendance.  Showing each team’s “sphere of influence” would entail a census-taking of Herculean scale, and would ultimately be open to dispute. 

November 1, 2007

The Golden Age of Baseball.

Filed under: Baseball,Hand Drawn Maps,Retro maps — admin @ 8:00 pm

mlb_golden_segment5.gif


Between 1903 and 1952, there was no franchise movement among the 8 National League and 8 American League baseball clubs.  This map shows all 16 clubs, with emblems, cap crests and uniform details from that time period.  Included is an inset map of the Greater New York City area.  In it, the locations of Yankee Stadium (NY Yankees), the Polo Grounds (NY Giants), and Ebbets Field (Brooklyn Dodgers) are marked.   The evolution of these three clubs’ crests and the evolution of the ball clubs’ colors are also shown here.  This map was drawn in 1993, and would not have been possible without the incredible book “Baseball Uniforms of the 20th Century” {at Amazon, here}.  That book was researched, written, and illustrated by Marc Okkonen.  His artwork for this book can now be found as the main uniform database (from 1900 to 1994) for the Baseball Hall of Fame site “Dressed to the Nines – A History of the Baseball Uniform“. 

October 22, 2007

The American League, established 1901.

Filed under: Baseball,Hand Drawn Maps,Retro maps — admin @ 11:50 pm

mlb_al_segment2.gif


The World Series starts Wednseday, so this is a good time for a baseball map.  This map was drawn in 2005.  The map includes every ball club that has played in the American League, since its inception in 1901. The American League was created 25 years after the National League, which was formed in 1876.  Since 1903, the winner of each league has gone on to play in the best-of-7-game World Series.  Featured on this map are caps, logos, and cap crests from the past, with the years listed.  Franchise shifts are also noted.

« Newer PostsOlder Posts »

Powered by WordPress