…
Please note: to see the most recent MLB paid-attendance map-and-post, click on the following: category: Baseball >paid-attendance.
…
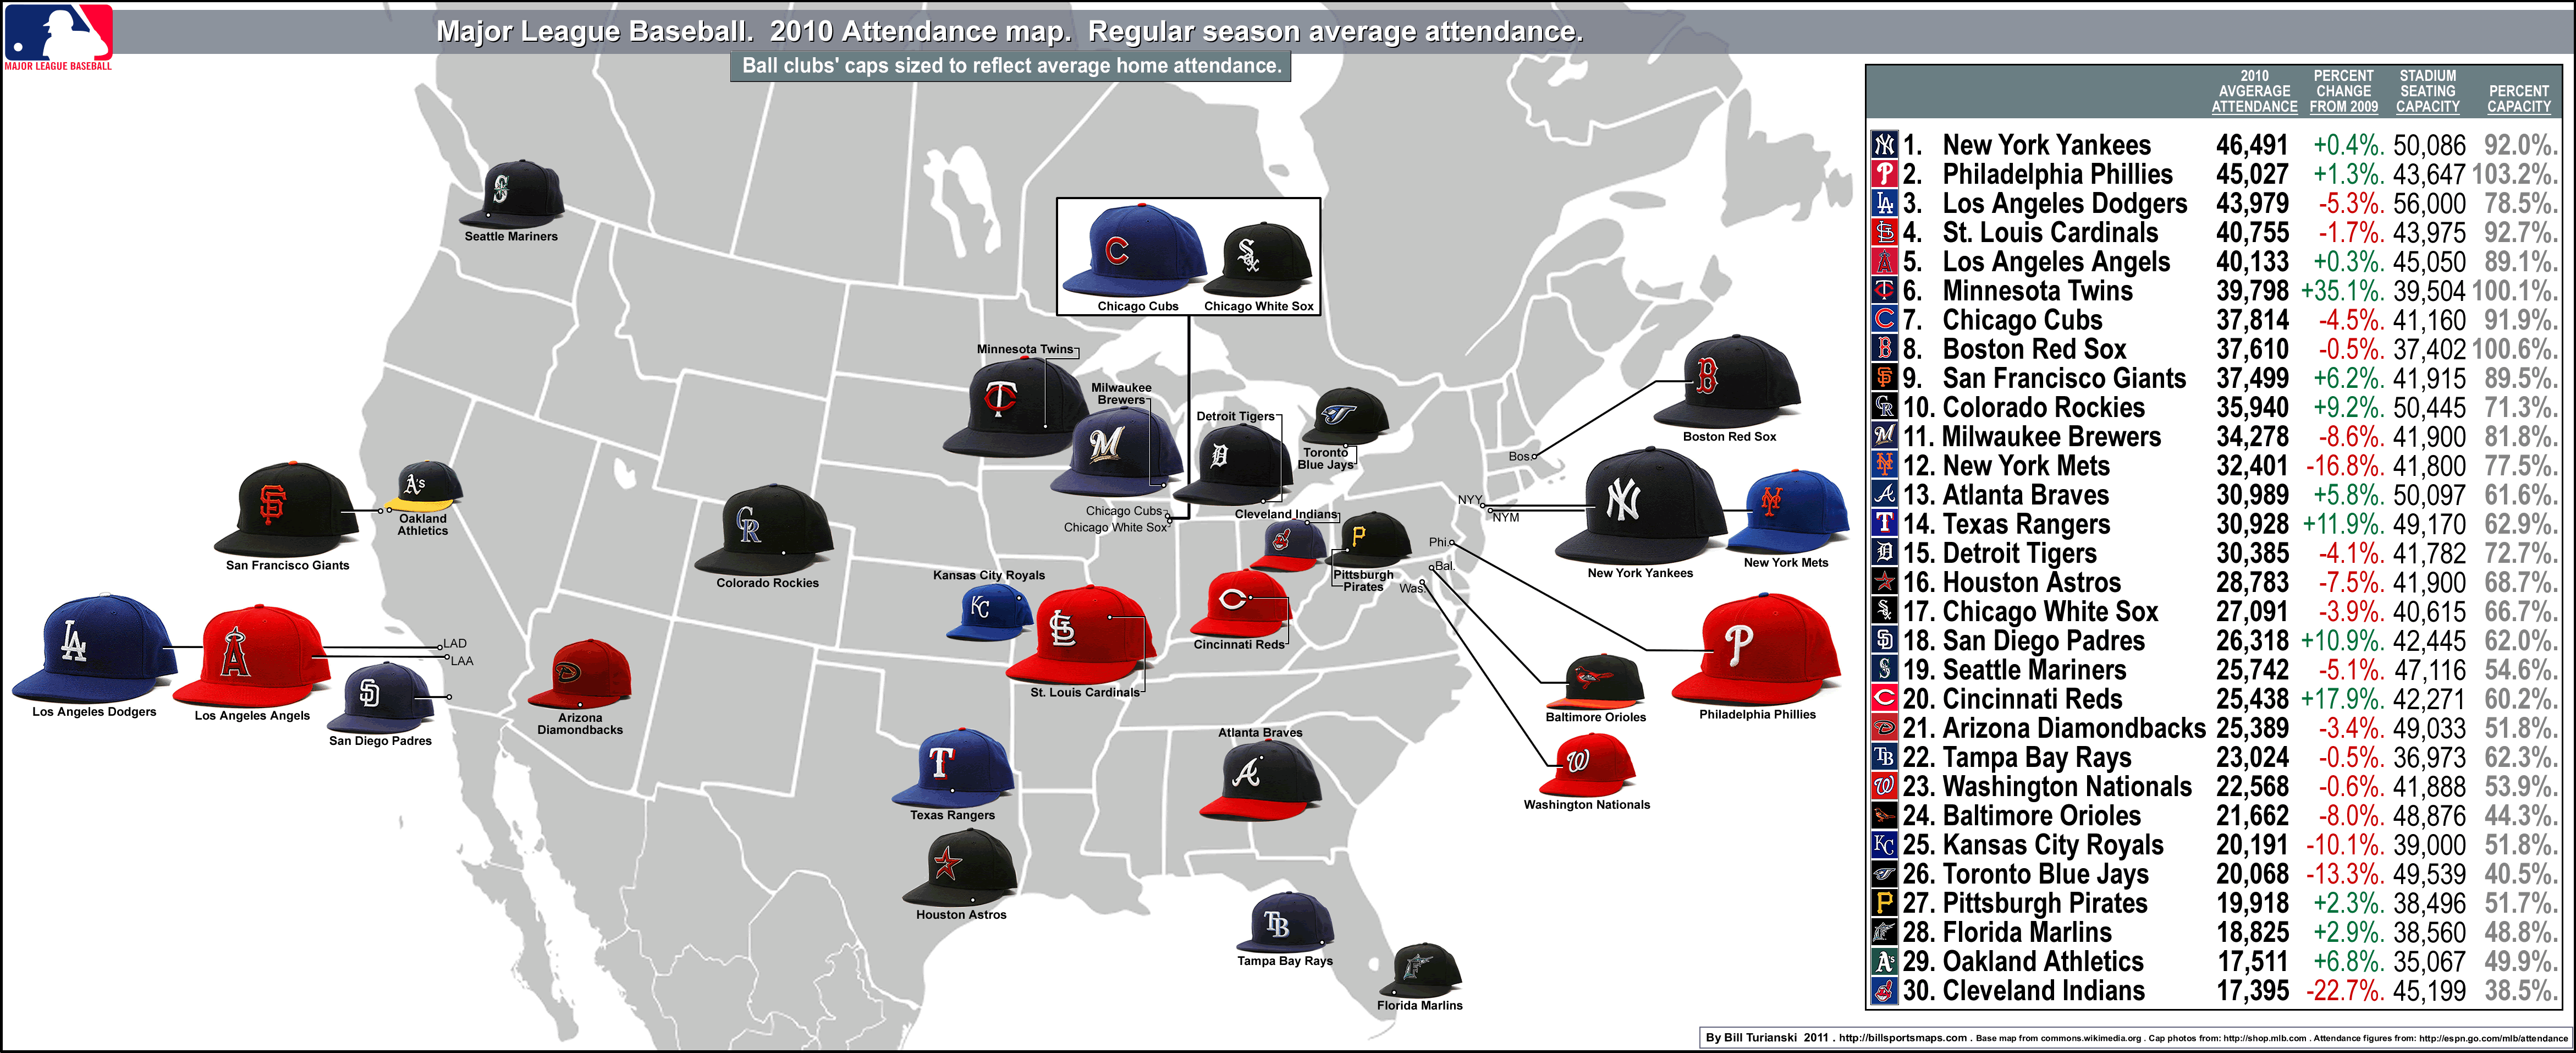
On the far left of the map page you will find, for all 30 MLB teams, four statistics – A). 2010 attendance figures (for home, regular season games). B). 2010 versus 2009 percentage change in average attendance. C). Ballpark seating capacity. D). 2010 percent capacity [average attendance divided by ballpark capacity].
The map shows each ball club’s location, and their home cap. Each cap is sized to reflect the ball club’s 2010 average attendance.
…
From the Biz of Baseball site, from March 29, 2011, by Maury Brown, ‘Is MLB Poised to see an Attendance Rebound in 2011?‘.
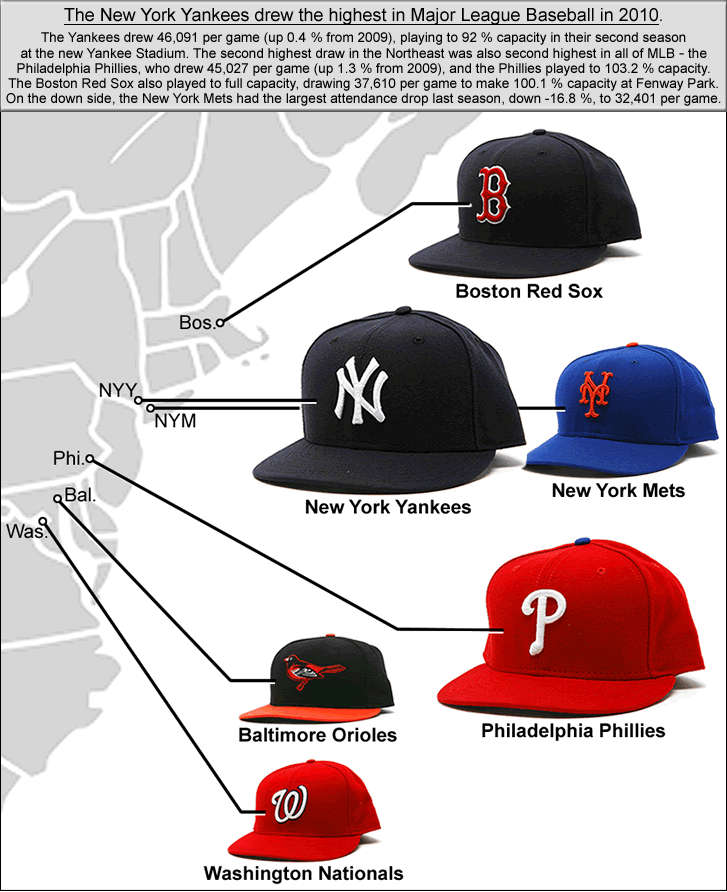
The New York Yankees drew the highest in 2010, supplanting 2009 attendance leaders the Los Angeles Dodgers. The Dodgers had an off-season, and attendance plummeted -5.3 %. Before the New York Yankees new stadium was built (and their capacity shrunk from 56,936 to 50,086), the Yanks were average attendance leaders year-in, year-out for a five-year period (from 2004 to 2008). Before that, the Seattle Mariners were the best-drawing ballclub, from 2001 to 2003. And if that is not surprising enough in context of where the Mariners are today (Seattle was the 19th best draw in the Major Leagues in 2010), then how about the fact that a decade ago, in 2000, the best-drawing ballclub in North America was the now-hapless Cleveland Indians {see this, 2000 MLB attendance, from Baseball-reference.com}. The Cleveland Indians have gone from the best-drawing MLB team to the worst-drawing MLB team in the space of 10 years.
…
The largest percentage increase from 2009 to 2010 was with the Minnesota Twins, who had a 35.1 % increase. Second best percentage increase was the 17.9 % increase at the turnstiles that the Cincinnati Reds produced. Third highest increase was the 11.9 % produced by the Texas Rangers. All three of those teams had playoff-qualifying seasons. For the Twins, both playing in their brand new Target Field and being in yet another playoff run contributed to a 100.1% capacity. That made Minnesota one of 3 teams in Major League Baseball to play to full capacity in 2010 [the other two were the Philadelphia Phillies and the Boston Red Sox].
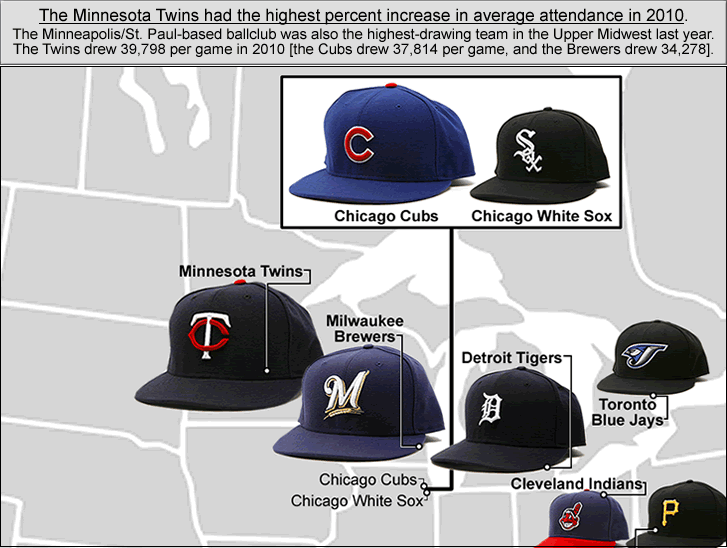
Minnesota ended up with an average attendance of 39,798 per game – which was 10,332 per game higher than the Twins drew in 2009 in their last season at the dreary Metro Dome. Minnesota had the sixth-best average attendance in Major League Baseball last season. Listed below are the top 10 draws in MLB last year.
Here are the top 10 highest-drawing teams in Major League Baseball in 2010…
1. New York Yankees, 46,091 per game (92.0 % capacity); up +0.4 perecent from 2009.
2. Philadelphia Phillies, 45,027 per game (103.2 % capacity); up +1.3 percent from 2009.
3. Los Angeles Dodgers, 43,979 per game (78.5 % capacity); down -5.3% from 2009.
4. St. Louis Cardinals, 40,755 per game (92.7 % capacity); down -1.7 percent from 2009.
5. Los Angeles Angels, 40,133 per game (89.1 % capacity); up +0.3 percent from 2009.
6. Minnesota Twins, 39,798 per game (100.1 % capacity); up +35.1 percent from 2009.
7. Chicago Cubs, 37,814 per game (91.9 % capacity); down – 4.5 percent from 2009.
8. Boston Red Sox, 37,610 per game (100.6 % capacity); down -0.5 perecent from 2009.
9. San Francisco Giants, 37,499 per game (89.5 % capacity); up +6.2 percent from 2009.
10. Colorado Rockies, 35,940 (71.3 % capacity); up +9.2 percent from 2009.
-
Thanks to ESPN, for attendances, here.
Thanks to MLB.com/shop, for ball cap photos.
