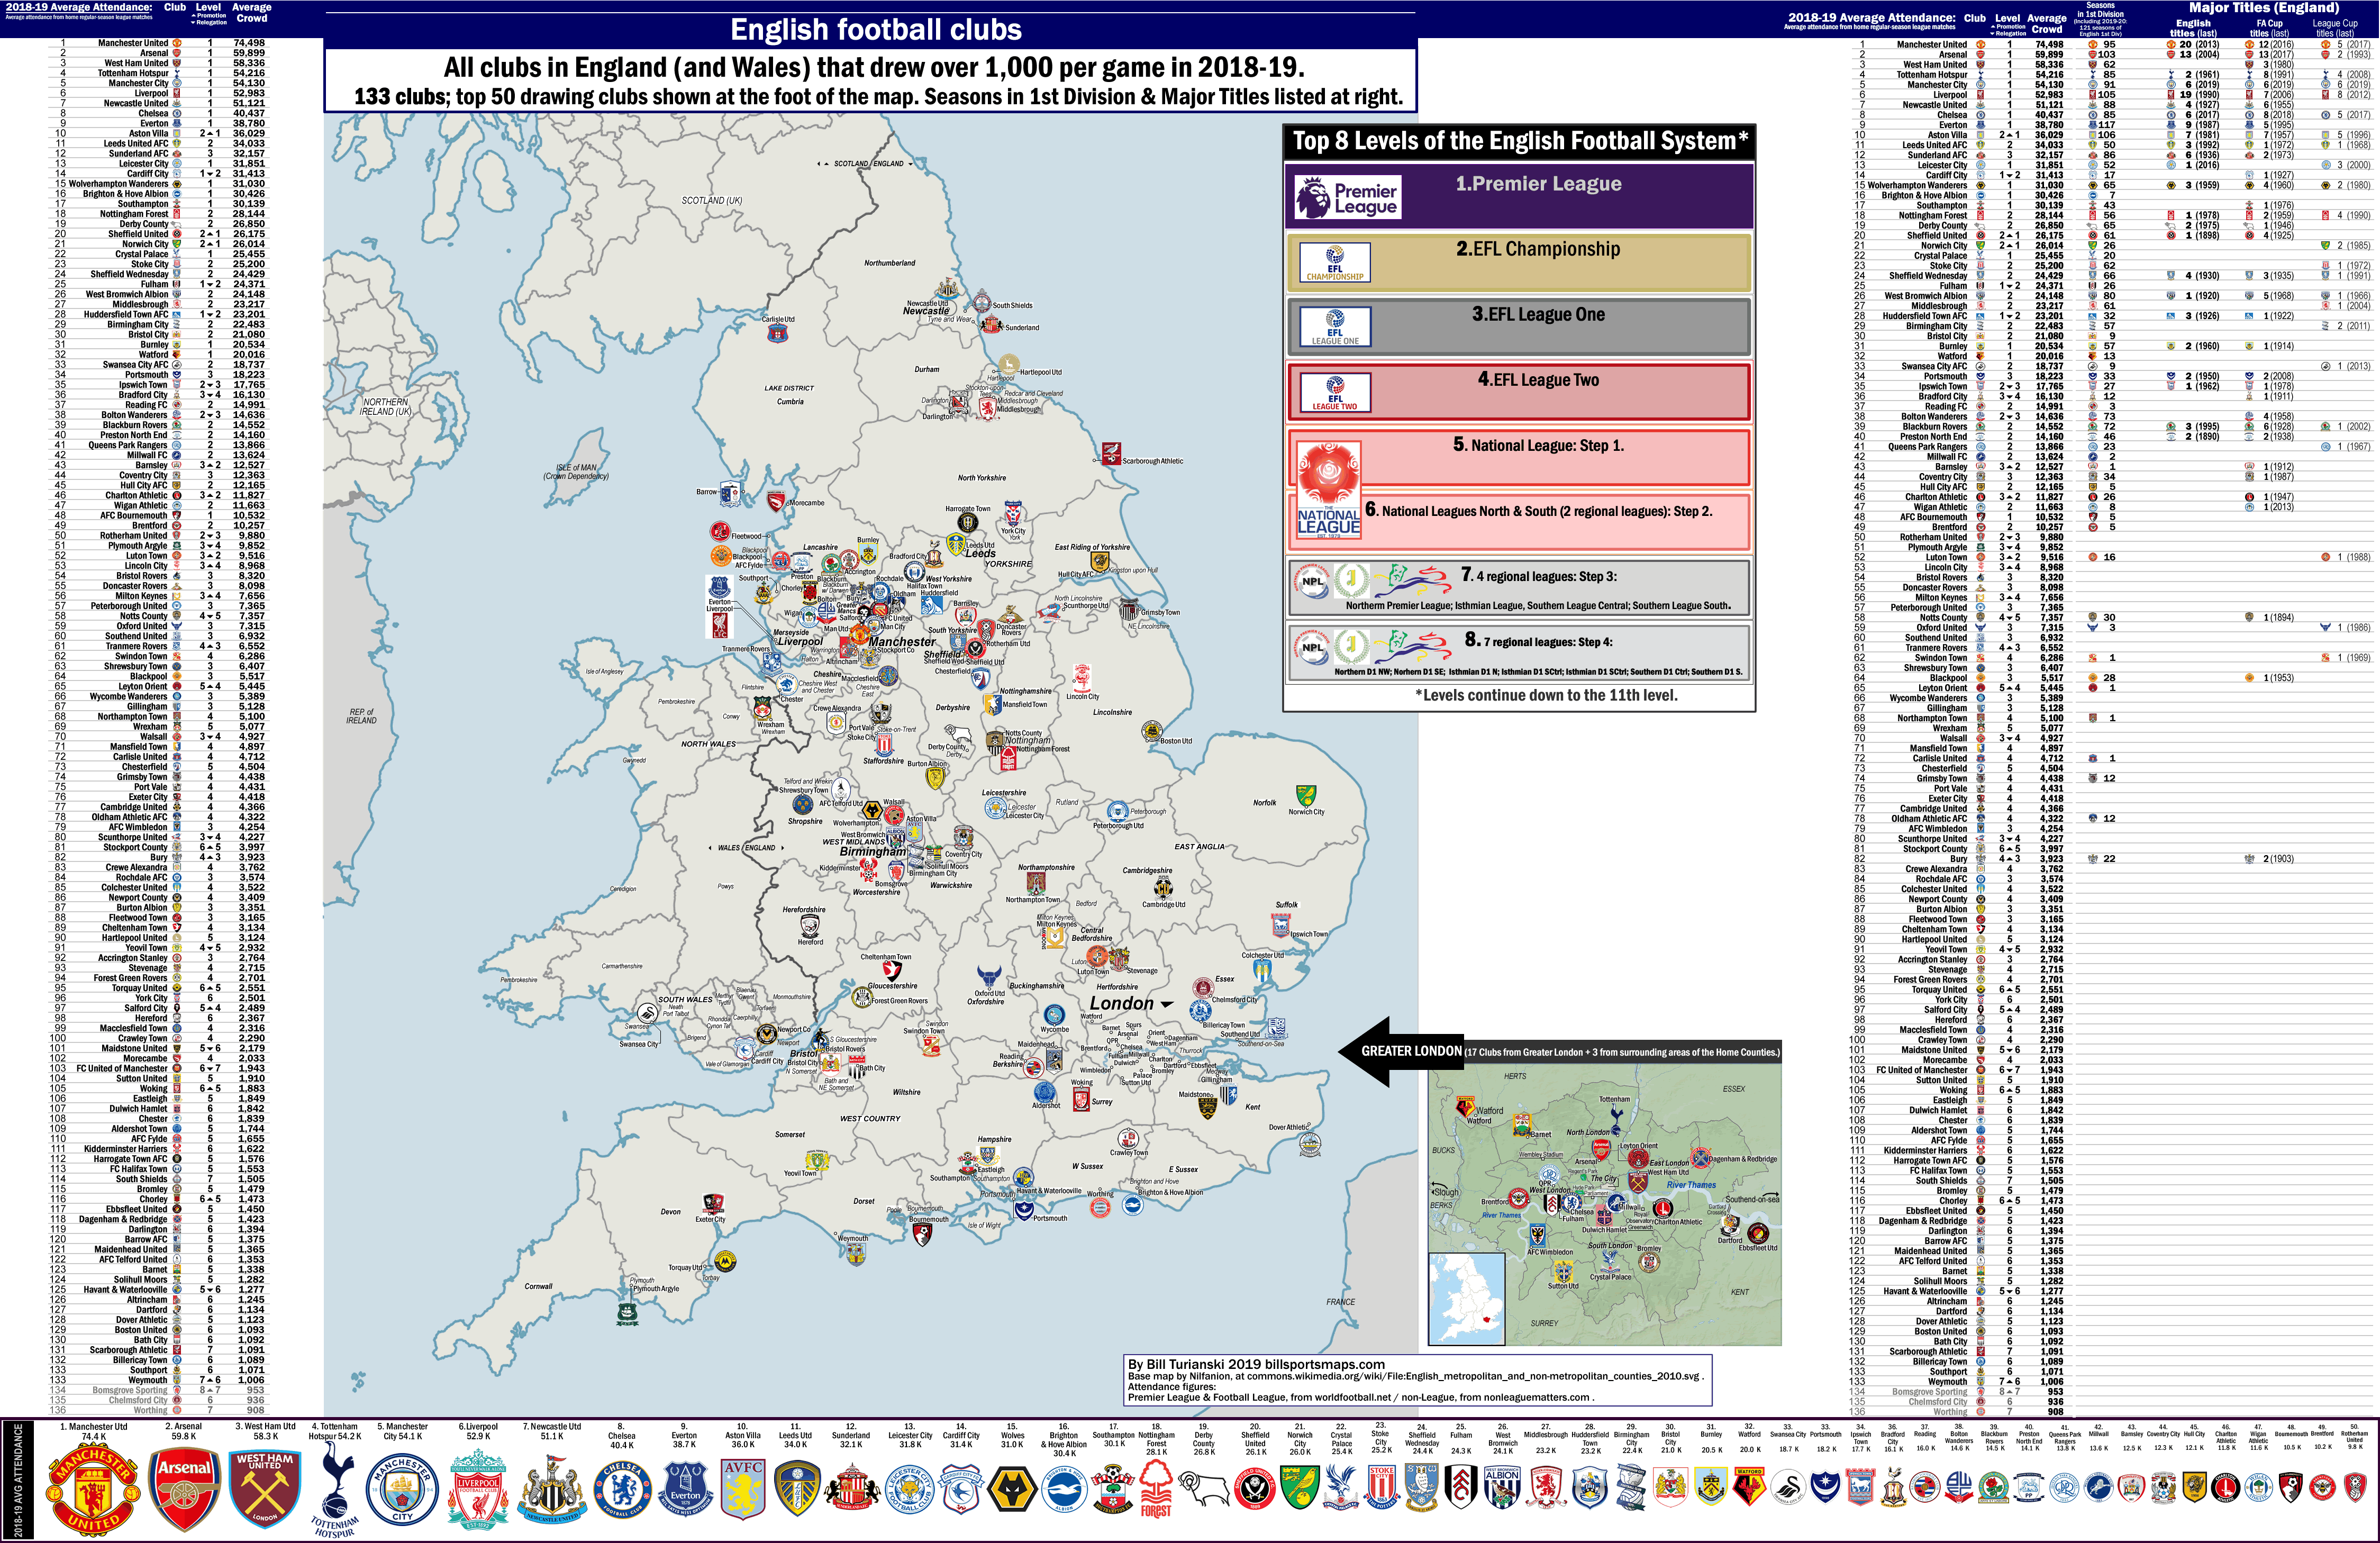
England (including Wales) – map of all football clubs drawing above 1 K per game: 133 clubs, including 41 non-League clubs (2018-19)
…
…
By Bill Turianski on 22 August 2019; twitter.com/billsportsmaps.
Sources…
-Article on defining the largest cities in the UK.. Where are the largest cities in Britain? (citymetric.com).
-List of metropolitan areas in the United Kingdom (en.wikipedia.org).
-Metropolitan and non-metropolitan counties of England (en.wikipedia.org).
Attendance figures…
-worldfootball.net. (Average attendances last season from the 1st division through 4th division.)
-nonleaguematters.co.uk. (Average attendances last season of all non-League clubs, ie from 5th division down.)
The map…
(Note: in bold-17-to-36-point-type, on the map, are listed the 9 largest cities within England {all English cities with more than .6 million inhabitants/see first link above}…Greater London, Manchester, Birmingham, Leeds, Liverpool, Newcastle, Nottingham, Sheffield, Bristol. Also, in 12-to-15-point-type, on the map, are listed the 83 Metropolitan and non-metropolitan counties of England. Also, in 14-point-all-cap-bold-type, are listed prominent British regional names such as: the East Midlands, the West Midlands, East Anglia, the West Country, and the Lake District; as well as North Wales and South Wales.)
The expanded list on the right side of the map shows 7 things…
A) Attendance Rank.
B) 2019 Divisional status (aka level), with promotion or relegation (if applicable) listed.
C) Home domestic league Average Attendance from 2018-19.
D) Seasons that the Club has played in the 1st division (there have been 121 seasons of English 1st division seasons [counting 2019-20]).
E) English titles won (with last title noted).
F) FA Cup titles won (with last Cup-win noted).
G) League Cup titles won (with last cup-win noted).
The map shows all clubs in the English football system which drew above 1,000 per game in 2018-19 (home domestic league matches).
Also, there is an inset-map for all the clubs from Greater London-plus-the-immediate surrounding area [GREATER LONDON (17 Clubs from Greater London + 3 from surrounding areas of the Home Counties).] At the foot of the map-page are shown the crests of the top-50-drawing English-and-Welsh clubs, arranged L-R with their crests sized, to reflect their drawing-power. (The top 50 drawing clubs in the English league system in 2018-19 ended up being all the clubs which drew above 9.8 K per game.)
There were 8 clubs which drew above 40 thousand per game…
-Manchester United (who finished in 6th place in the 2018-19 Premier League, drawing 74.4 K per game).
-Arsenal (who finished in 5th place in the 2018-19 Premier League, drawing 59.9 K per game).
-West Ham United (who finished in 10th place in the 2018-19 Premier League, drawing 58.3 K per game).
-Tottenham Hotspur (who finished in 4th place in the 2018-19 Premier League, drawing 54.2 K per game).
-Liverpool (who finished in 2nd place in the 2018-19 Premier League, drawing 52.9 K per game).
-Manchester City (who finished in 1st place in the 2018-19 Premier League, drawing 54.1 K per game).
-Newcastle United (who finished in 13th place in the 2018-19 Premier League, drawing 51.1 K per game).
-Chelsea (who finished in 3rd place in the 2018-19 Premier League, drawing 40.3 K per game).
And, in 2018-19, there were 32 clubs in the English league system which drew above 20.0 K per game. The 20-thousand-drawing clubs includes the 8 highest-drawing clubs listed above, plus the 24 clubs listed below…
-Everton (1), 38.7 K.
-Aston Villa (2-up-to-1), 36.0 K.
-Leeds United AFC (2), 34.0 K.
-Sunderland AFC (3), 32.1 K.
-Leicester City (1), 31.8 K.
-Cardiff City (1-down-to-2), 31.4 K.
-Wolverhampton Wanderers (1), 31.0 K.
-Brighton & Hove Albion (1), 30.4 K.
-Southampton (1), 30.1 K.
-Nottingham Forest (2), 28.1 K.
-Derby County (2), 26.8 K.
-Sheffield United (2-up-to-1), 26.1 K.
-Norwich City (2-up-to-1), 26.1 K.
-Crystal Palace (1), 25.4 K.
-Stoke City (2), 25.2 K.
-Sheffield Wednesday (2), 24.4 K.
-Fulham (1-down-to-2), 24.3 K.
-West Bromwich Albion (2), 24.1 K.
-Middlesbrough (2), 23.2 K.
-Huddersfield Town AFC (1-down-to-2), 23.2 K.
-Birmingham City (2), 22.4 K.
-Bristol City (2), 21.0 K.
-Burnley (1), 20.5 K.
-Watford (1), 20.0 K.
…
The list goes to 1,000 per game (133 clubs), but I also included, on the list and on the map, all clubs which drew in the 900s…of which there were only 3 clubs: Chelmsford City (6), Bomsgrove Sporting (8-up-to-7), Worthing (7). So that made it 136 teams on the map. Here are all the clubs which just missed out being on the map: that is, all the clubs which drew in the 800s…7 clubs: Wealdstone (6), St Albans City (6), Gateshead (5-down-to-6), Kettering Town (7-up-to-6), Spennymoor Town (6), Blyth Spartans (6), Nuneaton Borough (6-down-to-7).
…
Here is the breakdown, by division (aka level), of…All the clubs in the English football pyramid which drew over 1 K per game in 2018-19 (133 clubs).
1 – Premier League: all 20 clubs.
2 – EFL Championship: all 24 clubs.
3 – EFL League One: all 24 clubs.
4 – EFL League Two: all 24 clubs.
5 – [non-League] National League: 21 of the 24 clubs…The exceptions being Gateshead (who were demoted for financial irregularities, drawing 0.8 K per game), Boreham Wood (who remained in the 5th division drawing 0.7 K per game [an all-time-club record]), and Braintree Town (who were relegated straight back to the 6th division, drawing 0.6 K per game), .
6 – [non-League] 2 regional leagues, National leagues North & South: 18 of the 44 clubs in the 6th level drew above 1.0 K per game (12 in NL-N, 6 in NL-S).
Those eighteen 6th-level clubs which (impressively) drew over 1.0 K were…
-Stockport County (who were promoted to the 5th division, drawing 3.9 K per game).
-Torquay United (who were promoted to the 5th division, drawing 2.5 K per game).
-York City (who drew 2.5 K per game).
-Hereford (who drew 2.3 K per game).
-FC United of Manchester (who were relegated to the 7th level, drawing 1.9 K per game).
-Woking (who were promoted to the 5th division, drawing 1.8 K per game).
-Dulwich Hamlet (who drew 1.8 K per game).
-Chester (who drew 1.8 K per game).
-Kidderminster Harriers (who drew 1.6 K per game).
-Chorley (who were promoted to the 5th division, drawing 1.4 K per game).
-Darlington (who drew 1.3 K per game).
-AFC Telford United (who drew 1.3 K per game).
-Altrincham (who drew 1.2 K per game).
-Dartford (who drew 1.1 K per game).
-Boston United (who drew 1.0 K per game).
-Bath City (who drew 1.0 K per game).
-Billericay Town (who drew 1.0 K per game).
-Southport (who drew 1.0 K per game).
7 – [non-League] 4 regional leagues, Northern Premier/Southern Central/Southern South/Isthmian: 3 of the 88 clubs…
The three 7th-level clubs which (very impressively) drew above 1 K per game were:
-South Shields (who finished in 2nd place in the Northern Premier (losing out in the play-offs), and drawing 1.5 K per game).
-Scarborough (who finished in 8th place in the Northern Premier, drawing 1.5 K per game).
-Weymouth (who finished in 1st place in the Southern League Premier-South [winning promotion to the National League-South], and drawing 1.0 K per game).
…
Here is the current/2019-20 breakdown of the top 50-drawing clubs from last season (ie, all the clubs in the English football pyramid which drew over 9.8 K per game in 2018-19)…
-All 20 clubs in the [current] 2019-20 Premier League.
-23 of the 24 clubs in the [current] 2019-20 EFL Championship, the exception being the just-promoted Luton Town (note: Luton Town are currently drawing above 9.8 K now, and will probably be in the top-50-drawing clubs for the 19/20 season: they are playing to very close to full-capacity (98%-capacity) at their 10.2 K-capacity Kenilworth Road ground).
-4 of the 24 clubs in the [current] 2019-20 EFL League One…Portsmouth, the just-relegated Ipswich Town, the just-relegated Bolton Wanderers, and the just-relegated Rotherham United.
-One of the 24 clubs in the [current] 2019-20 EFL League Two…the just-relegated Bradford City.
___
Thanks to all at the links below…
-Blank map of English Metropolitan and Non-Metropolitan Counties, by Nilfanion, at File:English metropolitan and non-metropolitan counties 2010.svg (commons.wikimedia.org).
-Blank relief map of Greater London, by Nilfanion (using UK Ordnance Survey data), at File:Greater London UK relief location map.jpg.
-en.wikipedia.org/wiki/English_football_league_system#Promotion_and_relegation_rules_for_the_top_eight_levels.
Attendance…
-worldfootball.net (1st division through 4th division).
-nonleaguematters.co.uk (all non-League from 5th division down).
