By Bill Turianski on 2 April 2016; twitter.com/billsportsmaps.
Links…
-Official site…mlb.com.
-Article on 2015 MLB attendance…from Sportsnet.ca, from 10 October 2015, MLB average attendance up slightly in 2015 (sportsnet.ca/baseball/mlb).
-[Current] MLB attendance at ESPN…MLB Attendance Report [current] (espn.go.com).
-2015 MLB attendance at ESPN…MLB Attendance Report – 2015 (espn.go.com).
-
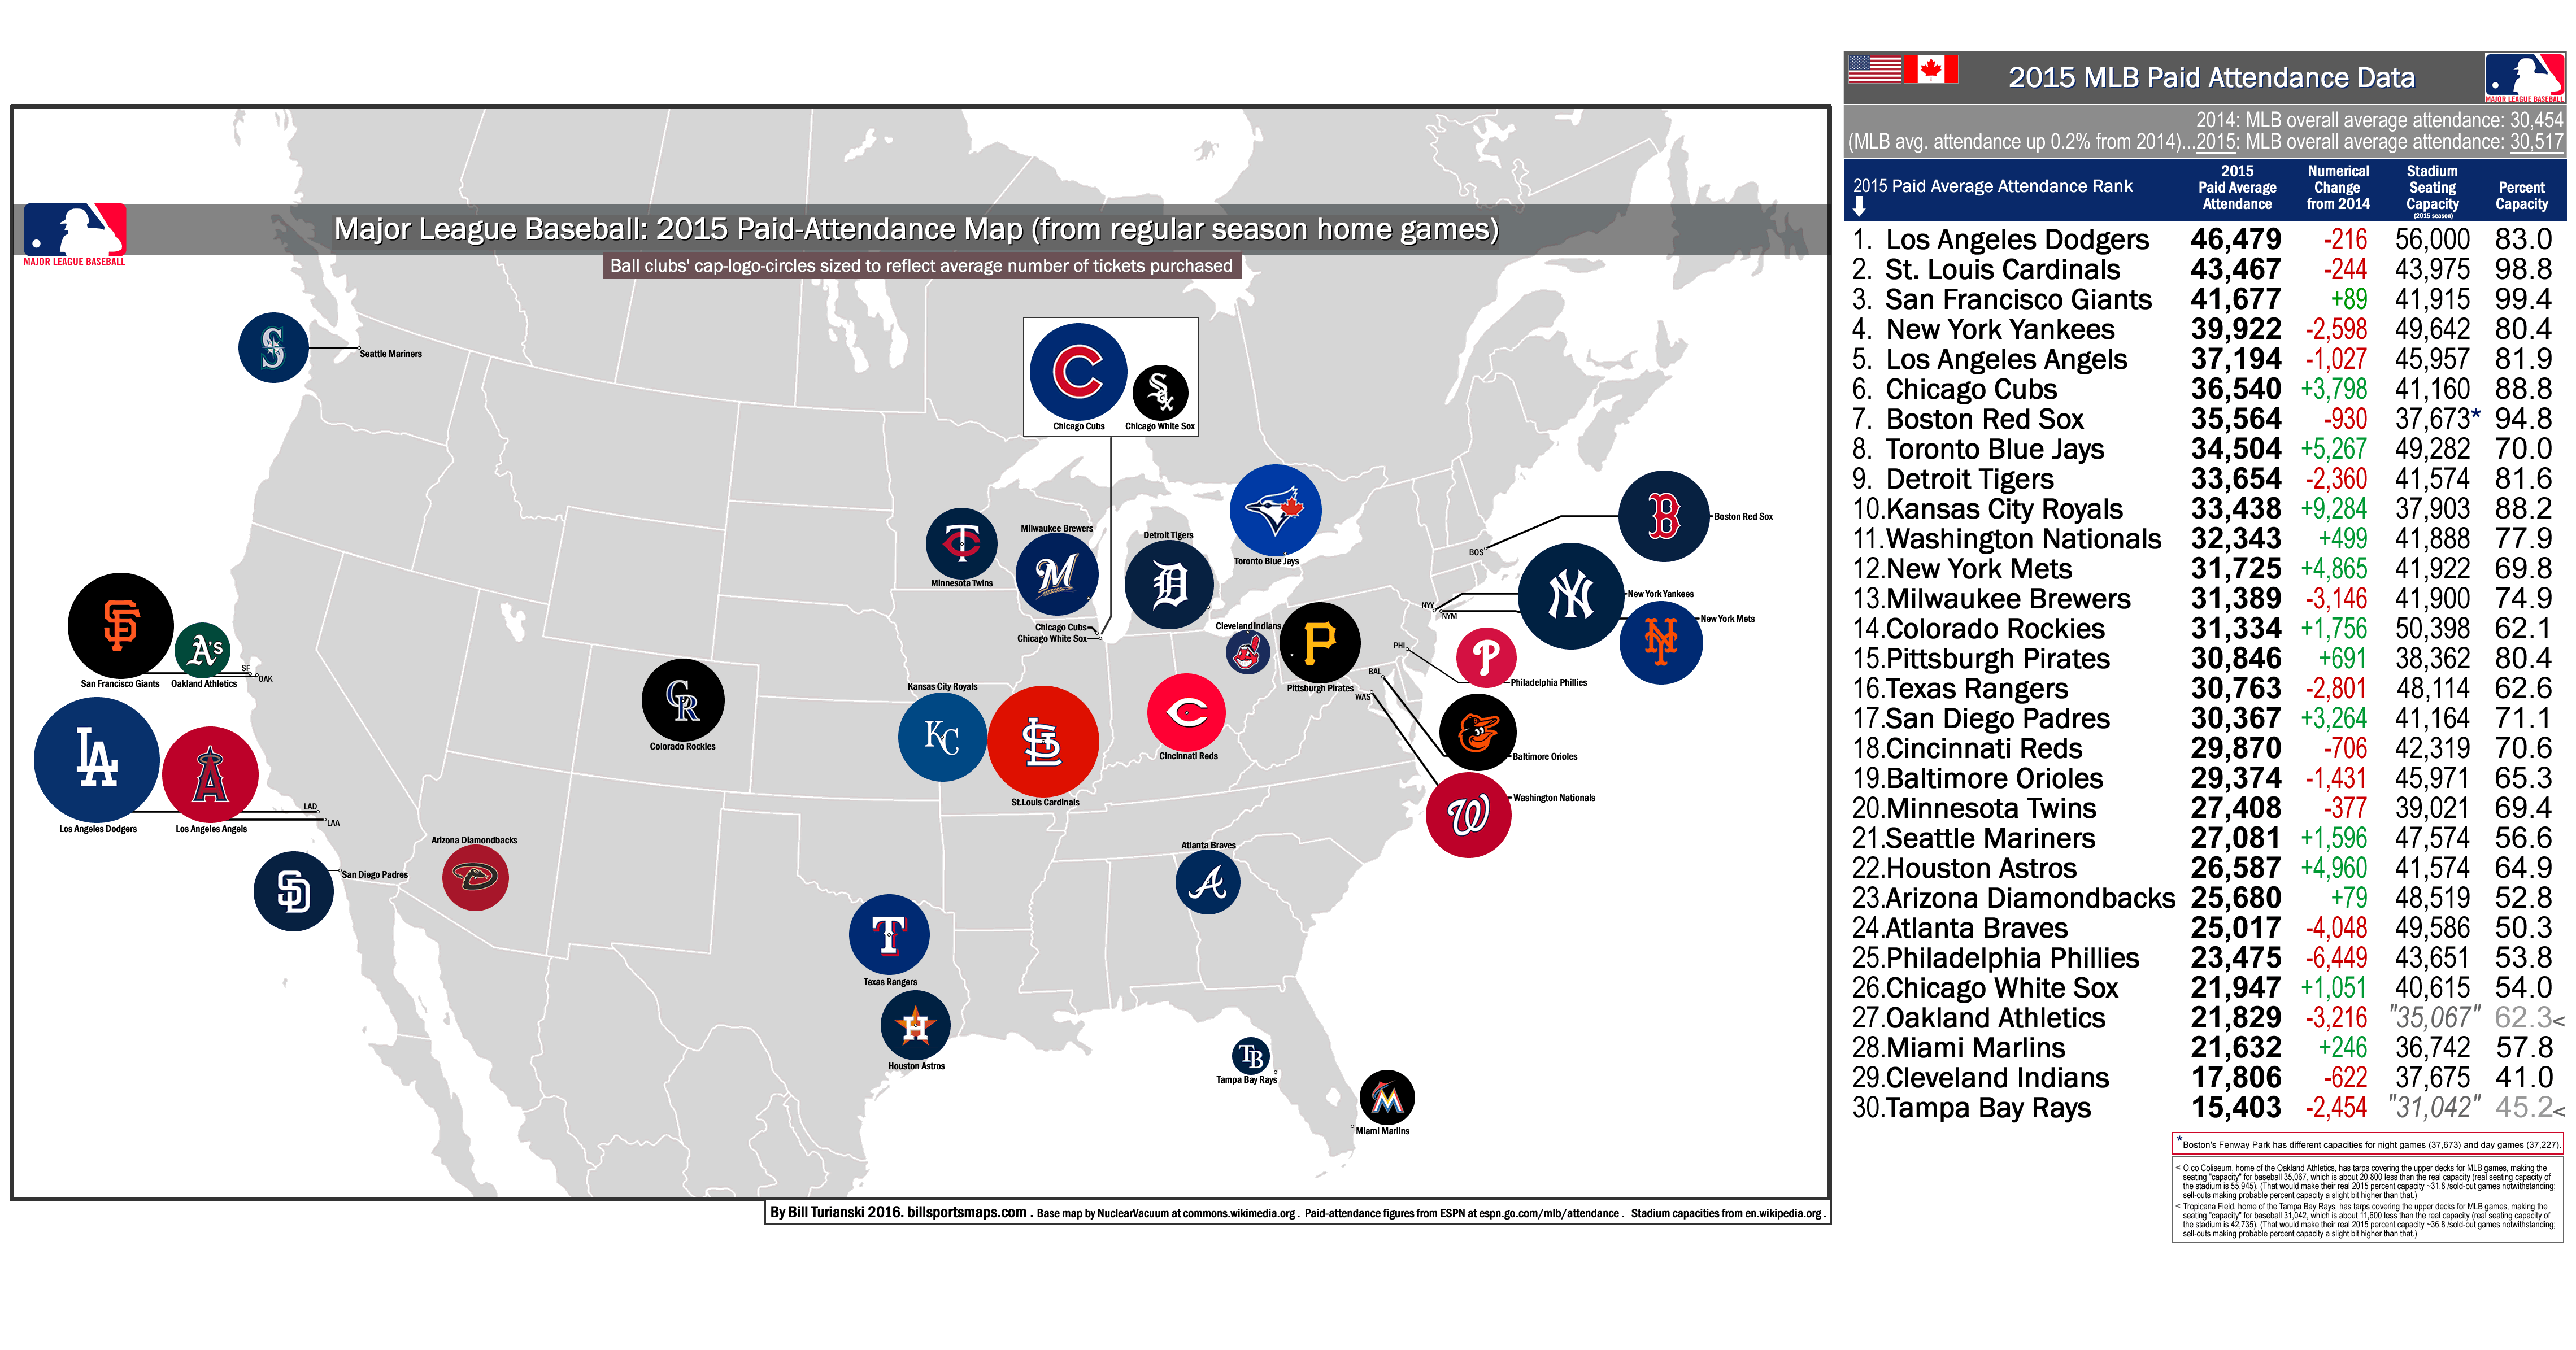
Highest-drawing team in MLB (for the 3rd straight year) – the Los Angeles Dodgers (at 46,479 per game)…
Below: Dodger Stadium (aka Chavez Ravine). Echo Park, Los Angeles, CA. Opened April 10, 1962. Capacity 56,000. 2015 average paid-attendance: 46,479.
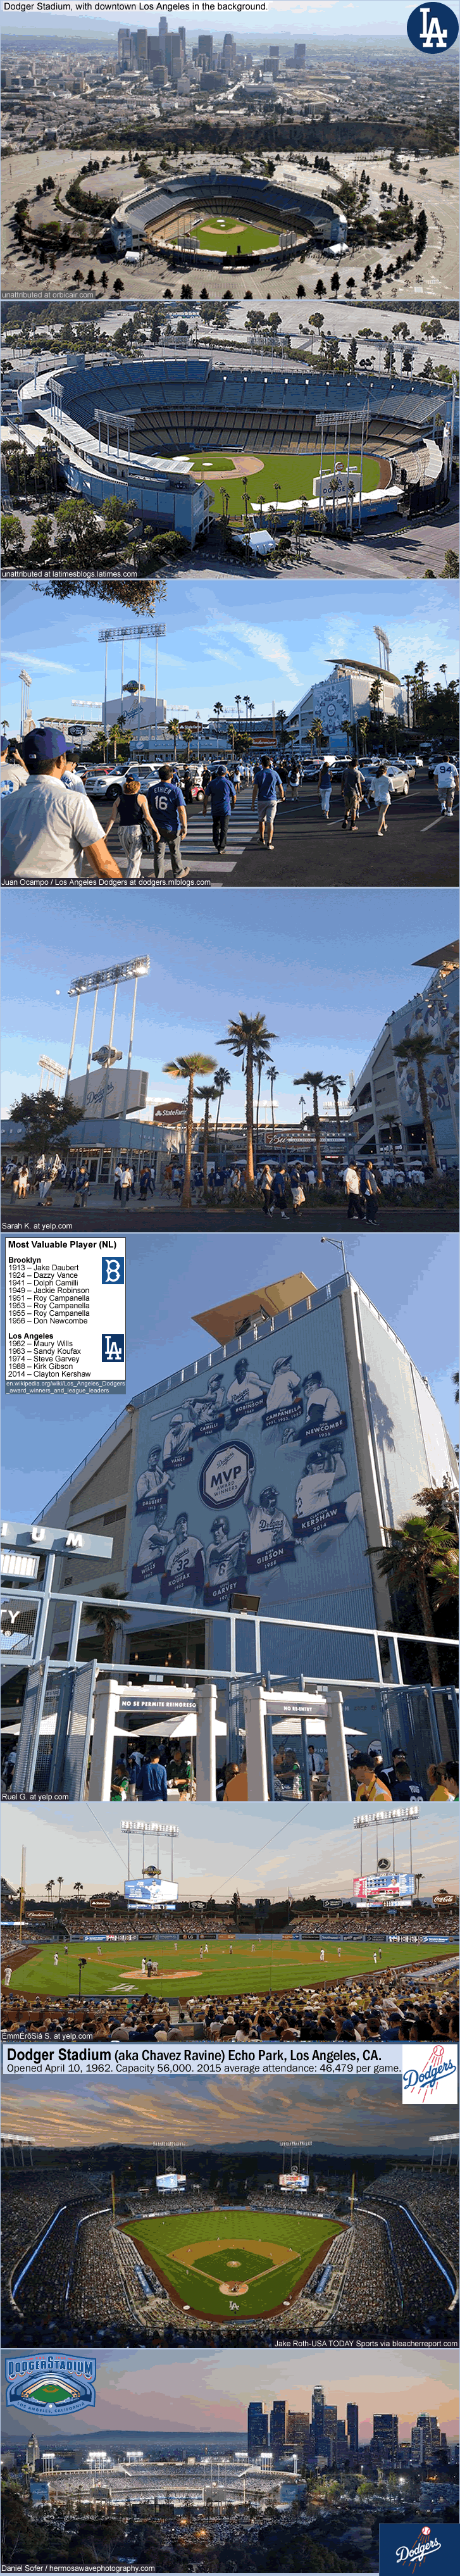
Photo credits above -
Aerial shot of Dodger Stadium with downtown LA in background, photo unattributed at orbicair.com/gi-56684-dodger-stadium. Tight-aerial-shot of Dodger Stadium, photo unattributed at latimesblogs.latimes.com. Exterior-shot/parking-lot-view of Dodger Stadium with fans streaming in, photo by Juan Ocampo/Los Angeles Dodgers at dodgers.mlblogs.com/category/dodger-stadium [photo from 2010]. Exterior-shot of Dodger Stadium front entrance, photo [from Oct. 4 2014] by Sarah K. at yelp.com [Dodger Stadium]. Exterior-shot of giant Dodgers MVPs banner on side of main grandstand, photo by Ruel G. at yelp.com/biz_photos/dodger-stadium-los-angeles. Text-block of Dodgers MVPs, from en.wikipedia.org/wiki/Los_Angeles_Dodgers_award_winners_and_league_leaders. Interior shot at sunset of Dodger Stadium from seats behind home plate, photo by ÉmmÉrōSiá S. at yelp.com/biz_photos/dodger-stadium-los-angeles. View as night falls of Dodger Stadium from upper-deck with large crowd, photo by Jake Roth-USA TODAY Sports at bleacherreport.com. Exterior-ground-level shot of Dodger Stadium at twilight, photo by Daniel Sofer at hermosawavephotography.com.
…
-
Best crowd-size increases in MLB in 2015…
All MLB teams which had an increase of +3,000 per game in 2015…
1). Kansas City Royals, +9,284 per game. The Royals increased from 25th-best crowd-size in 2014 (at 24,154 per game) to 10th-best-crowds in 2015 at (33,438 per game). The Royals won the AL Central/ beat Houston in ALDS/ beat Toronto in the ALCS/ won the 2015 MLB World Series (4 games to 1 over NY Mets).
2). Toronto Blue Jays, +5,177 per game. The Blue Jays increased from 17th-best crowd-size in 2014 (at 29,327 per game) to 8th-best-crowds in 2015 at (34,504 per game). The Blue Jays won the AL East/ beat Texas in ALDS/ lost to Kansas City in the ALCS.
3). Houston Astros, +4,960 per game. The Astros increased from 26th-best crowd-size in 2014 (at 21,627 per game) to 22nd-best crowds in 2015 (at 26,587 per game). The Astros were the lower-seeded-Wild-Card in the AL/ beat NY Yankees in the ALWCG/ lost to Kansas City in ALDS.
4). New York Mets, +4,865 per game. The Mets increased from 21st-best crowd-size in 2014 (at 26,860 per game) to 12th-best-crowds in 2015 (at 31,725 per game). The Mets won the NL East/ beat LA Dodgers in NLDS/ beat Chicago Cubs in the NLCS/ lost to Kansas City in the 2015 MLB World Series (in 5 games).
5). Chicago Cubs, +3,798 per game. The Cubs increased from 11th-best crowd-size in 2014 (at 32,742 per game) to 6th-best-crowds in 2015 (at 36,540 per game). The Cubs were the lower-seeded-Wild-Card in the NL/ beat Pittsburgh in the NLWCG/ beat St. Louis in the NLDS/ lost to NY Mets in the NLCS.
6). San Diego Padres, +3,264 per game. The Padres were the only MLB team in 2015 to have a +3,000-or-more increase in average attendance without making the playoffs, let alone playing above .500 (the Padres were 74-88). The Padres didn’t even have a better record than the previous year (they went 77-85 in 2014). They did have a bunch of young and exciting players and were involved in a lot of high-scoring and come-back games, and fan excitement there in San Diego translated into a healthy attendance increase. {See this article, and the comments there, at the Padres blog at SB Nation, Padres experiencing increased attendance and ratings, by jbox on Apr.27,2015 at gaslampball.com).}
…
-
The 2015 Kansas City Royals:
The Royals were 2015 MLB World Series champions (winning their second MLB World Series title);
& the Royals also had the 2015 MLB best-increase-in-crowds (at +9,284 per game)…
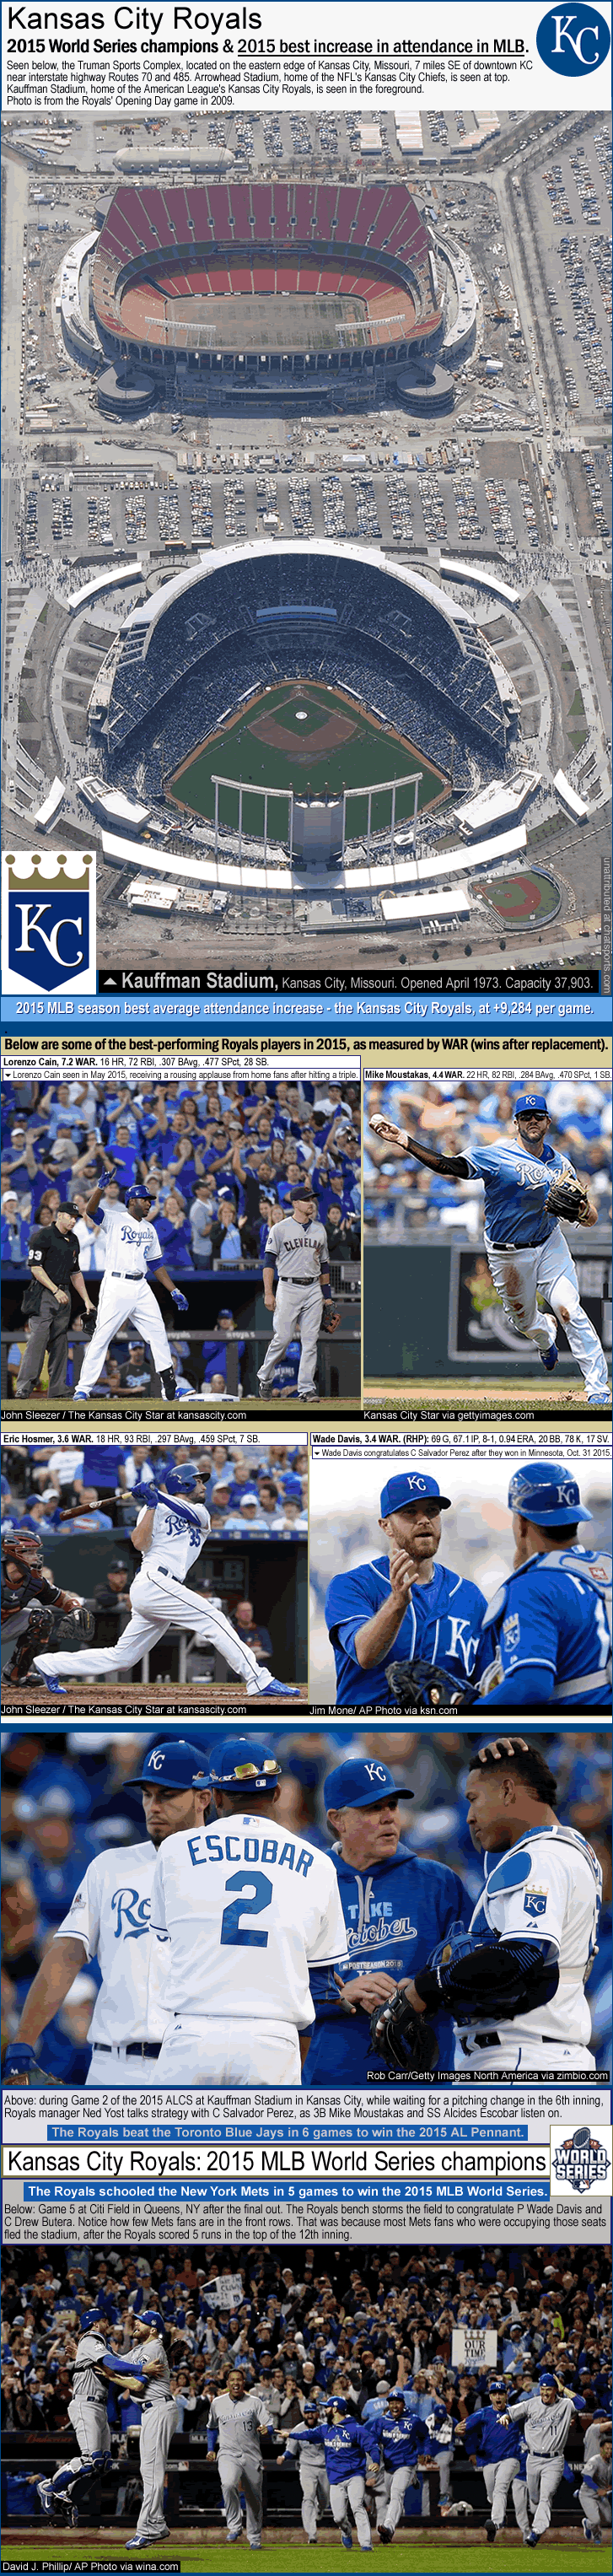
Photo and Image credits above -
Unattributed at chatsports.com. Lorenzo Cain after hitting a triple [May 2015], photo by John Sleezer/ The Kansas City Star at kansascity.com. Mike Moustakas throwing out runner to first, photo by the Kansas City Star via gettyimages.com. Eric Hosmer swinging, photo by John Sleezer/ The Kansas City Star at kansascity.com. Wade Davis congratulates C Salvador Perez after a win, photo by Jim Mone/ AP Photo via ksn.com. Royals manager Ned Yost talking with C Salvador Perez as 3B Mike Moustakas and SS Alcides Escobar listen on, photo by Rob Carr/Getty Images North America via zimbio.com. Royals bench rushing to celebrate after Wade Davis gets final out of 2015 World Series, photo by David J. Phillip/ AP Photo via wina.com.
…
The map, and notes on the chart…
The circular-cap-logos on the map page are all each MLB teams’ 2015 home cap logo. That is, except with respect to Baltimore’s circular-cap-logo, which is of their all-black road cap, because the Orioles wear their white-paneled cap at home, and I wanted to maintain a uniformity to all 30 of the circular-cap-logos on the map. The circular-cap-logos were then sized to reflect crowd size, utilizing a constant gradient (the larger the team’s average paid-attendance, the larger their circular-cap-logo is on the map). If you are unsure about the term “paid-attendance”, my post on MLB paid-attendance from last year can clear that up for you {here, 2014 MLB paid-attendance map}.
On the chart on the map page, this year I decided to scrap the column for Percent-Change-from-previous-season [average attendance], and now I have a column for Numerical-Change-from-previous-season. (I just think it is easier to visualize a numerical-change figure, than it is to visualize a percentage-change figure.)
Notes on Capacity and Percent-Capacity numbers…
On the map page, under the attendance chart, are 3 notes; the following is a further elaboration on them…
1). Boston Red Sox, at Fenway Park. Since 1953, Fenway has had different capacities for day games and for night games: 37,227 seated capacity for day games/ 37,673 seated capacity for night games {see this, Fenway Park/Seating capacity (en.wikipedia.org)}. It was 426 less seats for day games from 1953 up to 2014, and now (currently [2015-16]) it is 446 less seats for day games. During day games, the furthest-to-leftfield centerfield seats – a triangle of seats in the centerfield stands (near the Green Monster) – is kept empty and covered with a triangular dark-greenish-grey tarp (see it at the lower-left of the photo below). This is to make a more uniform background for batters to more easily see pitched balls. Other MLB ballparks have benign backdrops for the batters’ sight-lines; and this is in that area of a batter’s sight-line that is often referred to as “The Batter’s Eye”. From time to time, because of night-game-rain-outs and then re-scheduled day-games with those tickets already having been sold, the Red Sox have been forced to keep that triangle of 400-odd outfield-seats open during a rescheduled day-game. In those cases, they solved the problem by handing out dark green t-shirts to all ticket-buyers who had bought tickets for seats in that triangle…so the batters still had a quasi-dark green background for their sight-line.
-Here is a thread (from 2012), on the subject of the dual/day/night-seating-capacities at Fenway, from Reddit.com/r/sports,
Why is the capacity larger at Fenway Park when it is a night game rather then a day game? (reddit.com/r/sports).
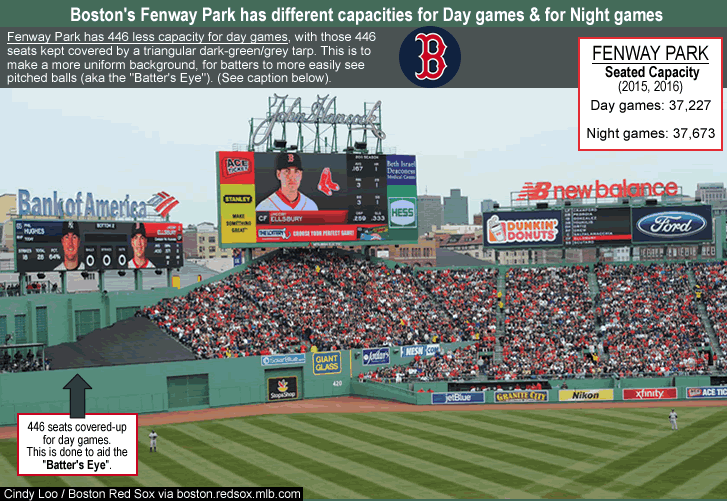
Photo credit above – Cindy Loo/Boston Red Sox via boston.redsox.mlb.com/bos/fenwaypark100/timeline.jsp?year=2011
2). Oakland Athletics, at O.co Coliseum, have tarps covering the upper decks for MLB games, making the seating “capacity” for baseball 35,067, which is about 20,800 less than the real capacity (real seating capacity of the stadium is 55,945). They do this, of course, because the A’s draw so poorly and their stadium is (and always has been) too ridiculously large for the ball club. The O.co Coliseum (originally known as the Oakland-Alameda County Coliseum) is one of the last of the oft-derided and basically hideous structures known as the dual-purpose stadium, a thing that has come and now is thankfully all but gone from the American landscape. Almost every other dual-purpose stadium has been torn down (see next paragraph). Three multi-purpose stadiums in the USA remain: Jack Murphy Stadium in San Diego; RFK Stadium in Washington, DC; and the Houston Astrodome. But besides the San Diego Chargers (NFL) and DC United (MLS), these 3 venues are devoid of big-league tenants and are underutilized (and the Astrodome is virtually condemned).
{Multi-purpose stadium/History in the United States (en.wikipedia.org).} Once there were over a dozen multi-use stadiums in MLB and in the NFL, and they all sucked, because they were designed to host two very incompatible configurations (baseball and gridiron football). They were giant soul-less concrete doughnuts that gave the fan – for either sport – vast yawning empty spaces where there should have been seats, and sight-lines looking upon totalitarian-architecture backdrops of brutal concrete. There were 9 now-demolished multi-purpose stadiums that were built in the USA in the same era or a few years later than the stadium in Oakland (which opened in 1966). Specifically, in San Francisco [which was re-purposed as a multi-use stadium for the 49ers in 1970] (Candlestick Park demolished in 2015). In Minneapolis (the Metrodome demolished in 2014). In Queens, NYC, New York (Shea Stadium demolished in 2007). In St. Louis (Busch Memorial Stadium demolished in 2005). In Philadelphia (Veterans Stadium demolished in 2004). In Cincinnati (Riverfront Stadium demolished in 2002). In Pittsburgh (Three Rivers Stadium demolished in 2001). In Seattle (the Kingdome demolished in 2000). And in Atlanta (Atlanta–Fulton County Stadium demolished in 1997). There is only one multi-purpose stadium still in use in both the NFL and in Major League Baseball, and that is Oakland’s stadium, and its days are numbered. And when it is gone, good riddance.
3). Tampa Bay Rays, at Tropicana Field, also have tarps covering the upper decks for MLB games, making the seating “capacity” for baseball 31,042, which is about 11,600 less than the real capacity (real seating capacity of the stadium is 42,735). The Tampa Bay Rays, as pretty much all baseball fans know, are hands-down, the absolute worst-drawing ball club in the Majors. This, despite, these days, being a very competitive team (most seasons). And the Rays’ dreary and surreal and pathetic stadium is a big reason why. The other major reason why the Rays draw so horribly is because the team is based in Florida. Floridians do not really like to go to baseball games – because there’s not enough tackling and fist-fights in baseball, and because baseball’s pace is too slow and nuanced for Florida Man.
Tropicana Field is like a Bizzarro-world Major League ballpark. The place just exudes a pervasively gloomy atmosphere. And need I say more than catwalks in play all around the roof of the dome? For that matter, how on Earth can it be, that in 2016, Major League Baseball still has a team which plays in a fixed-roof dome? On friggin’ artificial turf (as does Toronto). Look how long the list is, of criticisms about Tropicana Field, at the Trop’s page at Wikipedia, {here, Tropicana Field/Criticisms}. In 2013, USA Today, in a 30-part series, ranked Tropicana Field as the worst MLB venue {see this, Tropicana Field: All dome and gloom, by Joe Mock of BaseballParks.com}. At the StadiumJourney.com site, their review of Tropicana Field notes that…’Tropicana Field is one of those places where you get excited to see the game until you walk into the stadium for the actual game. The concourse areas in the stands have plenty to do and look at. Entering the stadium you will find a wide-open atrium with very colorful displays, but this disappears when you enter the seating bowl. Once inside however, you will encounter one of the dullest professional sports atmospheres anywhere. It feels like going into an early 1980′s time warp. The ugly field and tarp covering the top rows of the upper deck are depressing.’ { – excerpt from Tropicana Field, by Scott Bultman at stadiumjourney.com.}
Hey Major League Baseball – move the Tampa Bay Rays franchise to Montreal, Canada. {See this, from the New York Times on August 18, 2015, Baseball Fever Grows in Montreal With Hope of a New Team, by David Waldstein at nytimes.com/sports.} There’s your Tropicana Field problem solved right there. Then the new-and-improved Major League Baseball would be a product with 50%-less-Florida…and the new-and-improved MLB would be a product with 50%-more Canuck. Like in “the good old days“.
___
Thanks to NuclearVacuum for the blank map, File:BlankMap-North America-Subdivisions.svg (commons.wikimedia.org).
Thanks to ESPN for attendances & percent capacities, espn.go.com/mlb/attendance.
Thanks to Chris Creamer’s Sports Logos.net, for several (~17) of the cap logos, sportslogos.net.
Thanks to Baseball-reference.com, for stats.
Thanks to the contributors at en.wikipedia.org, en.wikipedia.org/wiki/Major_League_Baseball#Current_teams.
Thanks to yelp.com, and photo-contributors there at yelp.com/biz/dodger-stadium-los-angeles.
Thanks to the Kansas City Star for some nice photos of KC Royals stand-outs.
